Hiking And Trail Footwear Market Analysis, Size, and Forecast 2025-2029: North America (US and Canada), Europe (France, Germany, Italy, and UK), Middle East and Africa (UAE), APAC (China, India, Japan, and South Korea), South America (Brazil), and Rest of World (ROW)

Hiking And Trail Footwear Market Analysis, Size, and Forecast 2025-2029:
North America (US and Canada), Europe (France, Germany, Italy, and UK), Middle East and Africa (UAE), APAC (China, India, Japan, and South Korea), South America (Brazil), and Rest of World (ROW)

Published: Dec 2024 199 Pages SKU: IRTNTR44805

Market Overview at a Glance

$8.43 B
Market Opportunity
10%
CAGR
8.4
YoY growth 2024-2025(%)

Hiking And Trail Footwear Market Size 2025-2029

The hiking and trail footwear market size is forecast to increase by USD 8.43 billion at a CAGR of 10% between 2024 and 2029.

  • The global hiking and trail running footwear market is undergoing significant transformation, driven by shifting consumer preferences toward premium, feature-rich products and trail running shoes. Demand is accelerating as buyers increasingly seek high-quality and durable shoes that deliver enhanced performance across diverse terrains. The premiumization of footwear is reshaping product development strategies, encouraging investment in materials and technologies that elevate user comfort, protection, and overall experience. Simultaneously, environmental awareness is fostering a sharp increase in demand for eco-friendly footwear, prompting manufacturers to integrate sustainable materials and adopt responsible production practices that align with evolving customer values.
  • Current market data reflects this dual-track momentum. Sales of premium hiking and trail running footwear have grown by 21.8%, while demand for eco-friendly alternatives is projected to grow by 29.6%, indicating strong alignment between performance and sustainability. Despite these opportunities, the market faces a critical challenge: the threat of travel-related diseases associated with adventure tourism. Health risks such as Lyme disease and mountain sickness are becoming more prominent as consumers explore remote regions, underscoring the need for manufacturers to invest in research and development that not only enhances footwear design but also contributes to user safety.

Major Market Trends & Insights

  • North America dominated the market and accounted for a 35% share in 2023
  • The market is expected to grow significantly in Europe region as well over the forecast period.
  • Based on the Product the Hiking footwear segment led the market and was valued at USD 8.87 billion of the global revenue in 2023
  • Based on the Distribution Channel the offline accounted for the largest market revenue share in 2023

Market Size & Forecast

  • Market Opportunities: USD 109.37 million 
  • Future Opportunities: USD 8426.3 million 
  • CAGR (2024-2029): 10%
  • North America : Largest market in 2023

What will be the Size of the Hiking And Trail Footwear Market during the forecast period?

Hiking And Trail Footwear Market Size

 Request Free Sample

  • The global footwear care market is continuously evolving due to increased consumer focus on footwear longevity, footwear comfort, and footwear performance. Demand for premium products embedded with gore-tex lining, ortholite footbeds, and vibram soles has significantly shaped innovation, with buyers placing high importance on moisture-wicking materials and antimicrobial treatment. Advanced footwear technology advancements such as quick-lace system, adjustable fit, and lightweight structures using eva midsoles and tpu shank are driving consumer expectations around footwear breathability and footwear durability. Meanwhile, features like rock plates, mud guards, and lace-up closure remain crucial for high-impact use and niche performance categories.
  • Current market insights show a 28.4% increase in sales of products supporting footwear maintenance and footwear repair, highlighting a growing preference for sustainable consumption habits. Simultaneously, demand for solutions promoting footwear recycling and footwear sustainability is expected to expand by 34.7%, reinforcing the market's shift toward circular practices and eco-conscious innovation.
  • This reflects a measurable change in consumer behavior as the market transitions from disposability to prolonged usage and environmental responsibility. The alignment of footwear sizing, footwear fit, and footwear care with functional technologies continues to define footwear trends across segments. Brands investing in footwear innovation are leveraging material science and design flexibility to meet consumer needs while navigating shifting regulatory, ecological, and comfort-driven expectations.

How is this Hiking And Trail Footwear Industry segmented?

The hiking and trail footwear industry research report provides comprehensive data (region-wise segment analysis), with forecasts and estimates in "USD million" for the period 2025-2029, as well as historical data from 2019-2023 for the following segments.

  • Product
    • Hiking footwear
    • Trail running footwear
  • Distribution Channel
    • Offline
    • Online
  • End-User
    • Casual Hikers
    • Professional Trekkers
    • Outdoor Enthusiasts
  • Material Type
    • Leather
    • Synthetic
  • Geography
    • North America
      • US
      • Canada
    • Europe
      • France
      • Germany
      • Italy
      • Spain
      • UK
    • Middle East and Africa
      • UAE
    • APAC
      • China
      • India
      • Japan
      • South Korea
    • South America
      • Brazil
    • Rest of World (ROW)

By Product Insights

The hiking footwear segment is estimated to witness significant growth during the forecast period.

The global hiking footwear market is evolving with increasing demand for versatile, performance-driven designs that cater to both outdoor adventurers and casual users. As the popularity of outdoor recreation continues to grow, consumers are placing greater emphasis on features like ankle support, toe protection, and impact resistance. The market is also seeing a strong shift toward sustainable production, with rising interest in hiking footwear made from bio-based materials and recycled content. Enhanced comfort, traction testing, and breathability testing are becoming standard in new product development, reflecting user demand for footwear that balances safety, performance, and environmental responsibility.

Current data shows that hiking footwear adoption has grown by 19.2%, supported by trends such as adventure travel, running, and rock climbing. Future growth is expected to reach 27.5%, reflecting the market's ongoing expansion driven by health-conscious consumers and a growing preference for outdoor activities. This increase highlights the widening appeal of both technical and casual hiking footwear, supported by improvements in arch support, waterproof testing, and men's hiking footwear innovations.

Hiking And Trail Footwear Market Size

Request Free Sample

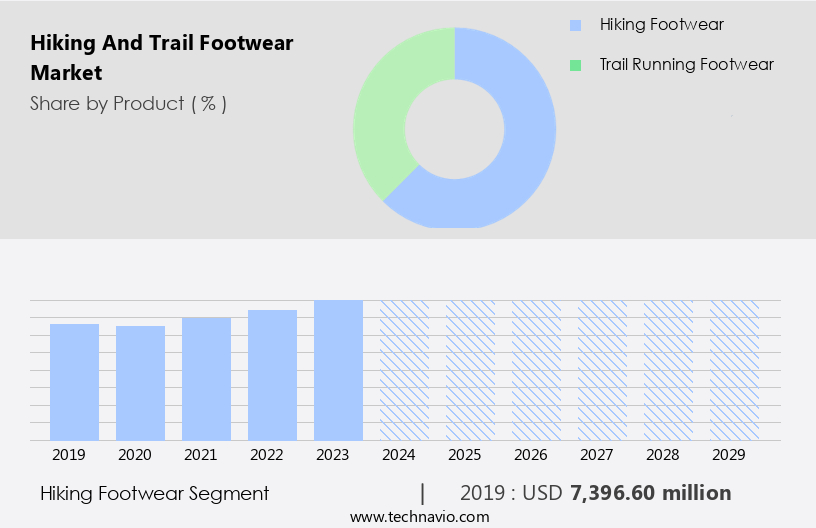
The Hiking footwear segment was valued at USD 7.4 billion in 2019 and showed a gradual increase during the forecast period.

Regional Analysis

North America is estimated to contribute 35% to the growth of the global market during the forecast period.Technavio's analysts have elaborately explained the regional trends and drivers that shape the market during the forecast period.

Hiking And Trail Footwear Market Share by Geography

 Request Free Sample

The European the market has experienced significant growth due to the increasing popularity of hiking and trail running activities in countries like Germany, France, Russia, and the UK. The European Ramblers' Association (ERA) and the Hiking Europe project have played a pivotal role in this trend by promoting physical activities, creating and maintaining trails, facilitating information exchange, and enabling easy travel across EU borders. These initiatives have led to an increase in outdoor recreation and adventure tourism. Hiking and trail footwear are essential for these activities, with key features including impact resistance, ankle support, toe protection, and breathability.

Technical hiking boots and day hiking boots are popular choices, while women's hiking footwear and kids' hiking footwear cater to specific demographics. Trail running shoes have also gained popularity, with traction testing and abrasion resistance being crucial factors. Footwear design continues to evolve, with the integration of bio-based materials, recycled materials, and performance enhancement technologies. Waterproof testing and durability testing are essential performance indicators. Hiking apparel and waterproof footwear are also essential for outdoor enthusiasts, with sustainable materials and arch support being key considerations. Rock climbing and backpacking boots are specialized categories within the market, requiring additional features such as traction and ankle support.

Footwear technology advances continue to drive innovation, with companies focusing on performance testing and improving overall durability. The market's focus on sustainability is also evident, with the use of eco-friendly materials and ethical manufacturing practices becoming increasingly important. Outdoor recreation and adventure travel are significant industries, with hiking and trail activities being a key component. The European market is well-positioned to cater to this demand, with a robust infrastructure and a growing awareness of the health and wellness benefits of outdoor activities.

Market Dynamics

Our researchers analyzed the data with 2024 as the base year, along with the key drivers, trends, and challenges. A holistic analysis of drivers will help companies refine their marketing strategies to gain a competitive advantage.

The global hiking and trail running footwear market is experiencing continuous advancements driven by innovation in material science and biomechanical engineering. With consumer expectations focused on performance, comfort, and safety, manufacturers are incorporating cutting-edge features such as hiking boot outsole rubber compound enhancements and trail running shoe cushioning system upgrades. These developments aim to improve athletic footwear biomechanical properties while addressing critical factors like pronation control efficacy and impact force dissipation hiking boots must deliver across varied terrain types. The industry is also prioritizing product quality through rigorous footwear comfort and stability testing protocol, ensuring optimal design alignment with user performance needs.

Comparative testing reveals that footwear material abrasion resistance testing has led to a 23.3% improvement in product lifespan, while hiking boot water resistance rating testing method advancements have contributed to a 31.7% increase in waterproofing performance. This divergence highlights the growing role of targeted R&D in developing footwear that performs under high-stress conditions without compromising on user comfort. Brands are also investing in performance footwear pressure mapping analysis and assessment of hiking boot energy return system to meet the evolving expectations of outdoor enthusiasts and competitive trail runners.

Ongoing product refinement includes evaluation of trail running shoe fit and comfort, assessment of hiking boot upper material moisture wicking capabilities, and testing of hiking boot outsole durability metrics. These innovations are further supported by trail running shoe traction pattern effectiveness and evaluation of hiking shoe heel counter stability, reinforcing market momentum around high-performance and user-centric footwear design.

What are the key market drivers leading to the rise in the adoption of Hiking And Trail Footwear Industry?

  • The hiking and trail running footwear market is evolving rapidly, driven by a shift toward premiumization and heightened consumer expectations for performance and specialization. This trend reflects a growing preference for advanced materials, enhanced comfort, and durability in outdoor footwear, particularly among users seeking reliable solutions for high-impact and variable-terrain activities. As demand grows for technically advanced features, the market is seeing expanded integration of specialized design elements and innovations that cater to the diverse needs of trail enthusiasts and athletes. The movement toward high-performance products is influencing product development cycles and positioning strategies across the industry.
  • Comparatively, the emphasis on premium features has led to a notable increase in product uptake within specialized segments, significantly outpacing baseline demand growth across standard categories. The current preference for performance-driven footwear has marked a clear departure from earlier patterns, indicating that consumer loyalty is increasingly linked to product functionality and specialization rather than brand identity or pricing tiers. This shift is reinforcing long-term changes in purchasing behavior and altering the competitive dynamics of the broader footwear sector.

What are the market trends shaping the Hiking And Trail Footwear Industry?

  • The global eco-friendly footwear market is experiencing steady transformation, driven by a clear shift in consumer behavior toward sustainable fashion solutions. The increasing preference for environmentally responsible alternatives reflects rising awareness of ecological impact and material sourcing. This trend is reshaping design priorities across the value chain, prompting manufacturers to explore biodegradable materials, circular production models, and low-impact packaging strategies. As sustainability becomes a defining element of brand identity, the market is adapting to meet evolving expectations for transparency, ethical sourcing, and reduced carbon footprint. These developments are influencing procurement, marketing, and lifecycle planning in footwear production and retail operations.
  • A comparative assessment of recent developments shows that demand for eco-friendly alternatives has grown more consistently than demand for conventional counterparts. This trajectory highlights a marked acceleration in sustainable purchasing habits, pointing to a redefinition of value in the footwear industry. Market activity indicates that growth momentum in eco-conscious segments is outpacing traditional product lines, underscoring a shift in long-term consumer priorities and operational strategy alignment across the sector.

What challenges does the Hiking And Trail Footwear Industry face during its growth?

  • The industry is undergoing continuous transformation, shaped by evolving traveler expectations and sector-wide shifts in mobility, health standards, and digital experiences. However, the expansion of travel activity faces a critical obstacle: the persistent threat of travel-related diseases. This challenge is prompting industry-wide adjustments in planning, sanitation protocols, and infrastructure strategies to mitigate public health risks while supporting safe mobility across regions.
  • Recent trends highlight a disparity between projected growth and current constraints. While the market showed an increase of 18.6% in outbound travel volume over the past year, future expansion is expected to slow to 12.3% due to ongoing concerns related to disease transmission. This comparison reflects the widening gap between demand-driven momentum and health-related risk management, signaling a necessary recalibration in operational planning. Stakeholders across the travel ecosystem are actively adapting to maintain continuity while addressing traveler safety and public health resilience.

Exclusive Customer Landscape

The hiking and trail footwear market forecasting report includes the adoption lifecycle of the market, covering from the innovator's stage to the laggard's stage. It focuses on adoption rates in different regions based on penetration. Furthermore, the hiking and trail footwear market report also includes key purchase criteria and drivers of price sensitivity to help companies evaluate and develop their market growth analysis strategies.
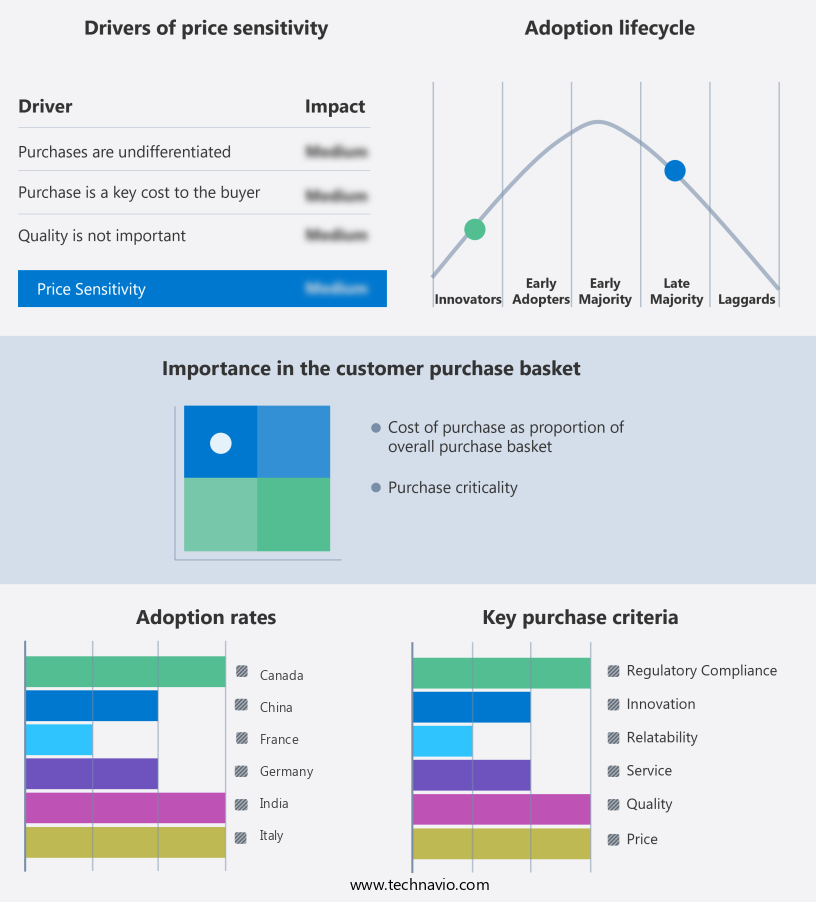
Hiking And Trail Footwear Market Share by Geography

 Customer Landscape

Key Companies & Market Insights

Companies are implementing various strategies, such as strategic alliances, hiking and trail footwear market forecast, partnerships, mergers and acquisitions, geographical expansion, and product/service launches, to enhance their presence in the industry.

The North Face - The company specializes in providing high-quality hiking footwear, including the Eastrail 2.0, Terrex AX4, and Terrex Free Hiker 2.0 shoes. Our product range caters to various terrains and hiking preferences, ensuring optimal comfort and performance. Each shoe is meticulously designed with advanced technology to enhance traction, durability, and flexibility for avid hikers. By prioritizing innovation and customer satisfaction, we aim to elevate outdoor experiences and inspire adventure.

The industry research and growth report includes detailed analyses of the competitive landscape of the market and information about key companies, including:

  • The North Face
  • Columbia Sportswear
  • Salomon
  • Merrell
  • Keen, Inc.
  • Arc'teryx
  • La Sportiva
  • Adidas AG
  • Asics Corporation
  • Haglöfs
  • Mammut Sports Group
  • Patagonia, Inc.
  • Under Armour, Inc.
  • Puma SE
  • Scarpa
  • Oboz Footwear
  • Lowa Boots
  • Tecnica Group
  • Vaude
  • Helly Hansen

Qualitative and quantitative analysis of companies has been conducted to help clients understand the wider business environment as well as the strengths and weaknesses of key industry players. Data is qualitatively analyzed to categorize companies as pure play, category-focused, industry-focused, and diversified; it is quantitatively analyzed to categorize companies as dominant, leading, strong, tentative, and weak.

Recent Development and News in Hiking And Trail Footwear Market

  • In February 2023, Merrell, a leading outdoor footwear brand, introduced its innovative Reefsedge waterproof hiking shoes, featuring a unique drainage system and GripRubber outsole for enhanced traction (Merrell Press Release). In May 2024, Salomon, a renowned hiking footwear manufacturer, announced a strategic partnership with Google to integrate Google Maps technology into their hiking apps, offering users real-time trail information and personalized recommendations (Salomon Press Release).
  • In October 2024, Columbia Sportswear Company, a significant player in the hiking footwear market, completed the acquisition of Mountain Hardwear, expanding its product offerings and enhancing its presence in the premium outdoor segment (Columbia Sportswear Company SEC Filing). 
  • In January 2025, the European Union passed the Single Use Plastics Directive, which included a ban on the production and sale of single-use plastic hiking footwear soles from 2027, driving demand for eco-friendly alternatives (European Commission Press Release). These developments demonstrate significant advancements in the market, with new product innovations, strategic partnerships, and regulatory initiatives shaping the industry landscape.

Research Analyst Overview

The market is witnessing significant advancements, with a focus on sustainability and circular economy principles. Footwear recycling and re-use are gaining traction, as brands explore innovative ways to minimize waste and reduce carbon footprint. Barefoot shoes and minimalist footwear continue to resonate with consumers seeking natural connection to the trail, while grip technology and impact absorption are key performance metrics. Sensor technology and wearable devices are revolutionizing gait analysis and shock absorption, offering personalized insights for trail runners. Ethical sourcing and fair trade practices are increasingly important, as consumers demand transparency and accountability. Smart footwear, featuring anti-slip soles, waterproof membranes, and 3D printed designs, is pushing the boundaries of footwear innovation.

Automated fryers, smart ovens, and robotic arms are reshaping food preparation in smart kitchens, improving efficiency and consistency. POS terminals, contactless kiosks, and AI-driven orders streamline service, while cloud servers and IoT sensors power data-driven insights and operational control. Innovations like delivery drones and automated delivery enhance speed and convenience. Consumers now expect healthy options and plant-based menus, supported by personalized menus and contactless service. Eco-conscious diners appreciate eco-friendly packaging and sustainable operations. Behind the scenes, inventory systems, packaging machines, and modular restaurants optimize logistics and adaptability, ensuring the fast food industry stays modern, efficient, and responsive to demand.

The market is evolving with a focus on performance, comfort, and innovation. Key features like Vibram soles, GoreTex lining, and Ortholite footbeds enhance footwear durability, footwear comfort, and footwear breathability. Advanced components such as EVA midsoles, TPU shank, rock plates, and mud guards ensure superior footwear performance on rugged terrain. Customization is supported through lace-up closure, quicklace system, and adjustable fit, improving footwear sizing and footwear fit. Modern designs use moisture-wicking materials and antimicrobial treatment to reduce odor and enhance hygiene. Consumers value low footwear weight, easy footwear maintenance, and increased footwear longevity. With rising footwear sustainability, footwear technology advancements, and shifting footwear trends, this market continues to attract strong interest from outdoor enthusiasts.

Regenerative materials and footwear repair are also emerging trends, promoting longevity and reducing the need for frequent replacements. Circular economy principles, such as circular design and closed-loop systems, are driving the industry towards a more sustainable future. Footwear data and analytics are enabling brands to optimize product development and cater to diverse consumer needs, ensuring a competitive edge in the market.

Dive into Technavio's robust research methodology, blending expert interviews, extensive data synthesis, and validated models for unparalleled Hiking And Trail Footwear Market insights. See full methodology.

Market Scope

Report Coverage

Details

Page number

199

Base year

2024

Historic period

2019-2023

Forecast period

2025-2029

Growth momentum & CAGR

Accelerate at a CAGR of 10%

Market growth 2025-2029

USD 8426.3 million

Market structure

Fragmented

YoY growth 2024-2025(%)

8.4

Key countries

US, China, Japan, Germany, France, Spain, Canada, India, South Korea, France, Japan, Italy, Brazil, UAE, UK, Spain, and Rest of World (ROW)Mexico

Competitive landscape

Leading Companies, Market Positioning of Companies, Competitive Strategies, and Industry Risks

Request Free Sample

What are the Key Data Covered in this Hiking And Trail Footwear Market Research and Growth Report?

  • CAGR of the Hiking And Trail Footwear industry during the forecast period
  • Detailed information on factors that will drive the growth and forecasting between 2025 and 2029
  • Precise estimation of the size of the market and its contribution of the industry in focus to the parent market
  • Accurate predictions about upcoming growth and trends and changes in consumer behaviour
  • Growth of the market across Europe, North America, APAC, South America, and Middle East and Africa
  • Thorough analysis of the market's competitive landscape and detailed information about companies
  • Comprehensive analysis of factors that will challenge the hiking and trail footwear market growth of industry companies

We can help! Our analysts can customize this hiking and trail footwear market research report to meet your requirements.

Get in touch

1 Executive Summary

  • 1.1 Market overview
    • Executive Summary - Chart on Market Overview
    • Executive Summary - Data Table on Market Overview
    • Executive Summary - Chart on Global Market Characteristics
    • Executive Summary - Chart on Market by Geography
    • Executive Summary - Chart on Market Segmentation by Product
    • Executive Summary - Chart on Market Segmentation by Distribution Channel
    • Executive Summary - Chart on Incremental Growth
    • Executive Summary - Data Table on Incremental Growth
    • Executive Summary - Chart on Company Market Positioning

2 Technavio Analysis

  • 2.1 Analysis of price sensitivity, lifecycle, customer purchase basket, adoption rates, and purchase criteria
    • Analysis of price sensitivity, lifecycle, customer purchase basket, adoption rates, and purchase criteria
  • 2.2 Criticality of inputs and Factors of differentiation
    • Overview on criticality of inputs and factors of differentiation
  • 2.3 Factors of disruption
    • Overview on factors of disruption
  • 2.4 Impact of drivers and challenges
    • Impact of drivers and challenges in 2024 and 2029

3 Market Landscape

  • 3.1 Market ecosystem
    • Parent Market
    • Data Table on - Parent Market
  • 3.2 Market characteristics
    • Market characteristics analysis
  • 3.3 Value chain analysis
    • Value chain analysis

4 Market Sizing

  • 4.1 Market definition
    • Offerings of companies included in the market definition
  • 4.2 Market segment analysis
    • Market segments
  • 4.3 Market size 2024
    • 4.4 Market outlook: Forecast for 2024-2029
      • Chart on Global - Market size and forecast 2024-2029 ($ million)
      • Data Table on Global - Market size and forecast 2024-2029 ($ million)
      • Chart on Global Market: Year-over-year growth 2024-2029 (%)
      • Data Table on Global Market: Year-over-year growth 2024-2029 (%)

    5 Historic Market Size

    • 5.1 Global Hiking And Trail Footwear Market 2019 - 2023
      • Historic Market Size - Data Table on Global Hiking And Trail Footwear Market 2019 - 2023 ($ million)
    • 5.2 Product segment analysis 2019 - 2023
      • Historic Market Size - Product Segment 2019 - 2023 ($ million)
    • 5.3 Distribution Channel segment analysis 2019 - 2023
      • Historic Market Size - Distribution Channel Segment 2019 - 2023 ($ million)
    • 5.4 Geography segment analysis 2019 - 2023
      • Historic Market Size - Geography Segment 2019 - 2023 ($ million)
    • 5.5 Country segment analysis 2019 - 2023
      • Historic Market Size - Country Segment 2019 - 2023 ($ million)

    6 Qualitative Analysis

    • 6.1 Impact of AI in global hiking and trail footwear market

      7 Five Forces Analysis

      • 7.1 Five forces summary
        • Five forces analysis - Comparison between 2024 and 2029
      • 7.2 Bargaining power of buyers
        • Bargaining power of buyers - Impact of key factors 2024 and 2029
      • 7.3 Bargaining power of suppliers
        • Bargaining power of suppliers - Impact of key factors in 2024 and 2029
      • 7.4 Threat of new entrants
        • Threat of new entrants - Impact of key factors in 2024 and 2029
      • 7.5 Threat of substitutes
        • Threat of substitutes - Impact of key factors in 2024 and 2029
      • 7.6 Threat of rivalry
        • Threat of rivalry - Impact of key factors in 2024 and 2029
      • 7.7 Market condition
        • Chart on Market condition - Five forces 2024 and 2029

      8 Market Segmentation by Product

      • 8.1 Market segments
        • Chart on Product - Market share (2024-2029) (%)
        • Data Table on Product - Market share (2024-2029) (%)
      • 8.2 Comparison by Product
        • Chart on Comparison by Product
        • Data Table on Comparison by Product
      • 8.3 Hiking footwear - Market size and forecast (2024-2029)
        • Chart on Hiking footwear - Market size and forecast (2024-2029) ($ million)
        • Data Table on Hiking footwear - Market size and forecast (2024-2029) ($ million)
        • Chart on Hiking footwear - Year-over-year growth (2024-2029) (%)
        • Data Table on Hiking footwear - Year-over-year growth (2024-2029) (%)
      • 8.4 Trail running footwear - Market size and forecast (2024-2029)
        • Chart on Trail running footwear - Market size and forecast (2024-2029) ($ million)
        • Data Table on Trail running footwear - Market size and forecast (2024-2029) ($ million)
        • Chart on Trail running footwear - Year-over-year growth (2024-2029) (%)
        • Data Table on Trail running footwear - Year-over-year growth (2024-2029) (%)
      • 8.5 Market opportunity by Product
        • Market opportunity by Product ($ million)
        • Data Table on Market opportunity by Product ($ million)

      9 Market Segmentation by Distribution Channel

      • 9.1 Market segments
        • Chart on Distribution Channel - Market share (2024-2029) (%)
        • Data Table on Distribution Channel - Market share (2024-2029) (%)
      • 9.2 Comparison by Distribution Channel
        • Chart on Comparison by Distribution Channel
        • Data Table on Comparison by Distribution Channel
      • 9.3 Offline - Market size and forecast (2024-2029)
        • Chart on Offline - Market size and forecast (2024-2029) ($ million)
        • Data Table on Offline - Market size and forecast (2024-2029) ($ million)
        • Chart on Offline - Year-over-year growth (2024-2029) (%)
        • Data Table on Offline - Year-over-year growth (2024-2029) (%)
      • 9.4 Online - Market size and forecast (2024-2029)
        • Chart on Online - Market size and forecast (2024-2029) ($ million)
        • Data Table on Online - Market size and forecast (2024-2029) ($ million)
        • Chart on Online - Year-over-year growth (2024-2029) (%)
        • Data Table on Online - Year-over-year growth (2024-2029) (%)
      • 9.5 Market opportunity by Distribution Channel
        • Market opportunity by Distribution Channel ($ million)
        • Data Table on Market opportunity by Distribution Channel ($ million)

      10 Market Segmentation by End-User

      • 10.1 Market segments
        • Chart on End-User - Market share (2024-2029) (%)
        • Data Table on End-User - Market share (2024-2029) (%)
      • 10.2 Comparison by End-User
        • Chart on Comparison by End-User
        • Data Table on Comparison by End-User
      • 10.3 Casual Hikers - Market size and forecast (2024-2029)
        • Chart on Casual Hikers - Market size and forecast (2024-2029) ($ million)
        • Data Table on Casual Hikers - Market size and forecast (2024-2029) ($ million)
        • Chart on Casual Hikers - Year-over-year growth (2024-2029) (%)
        • Data Table on Casual Hikers - Year-over-year growth (2024-2029) (%)
      • 10.4 Professional Trekkers - Market size and forecast (2024-2029)
        • Chart on Professional Trekkers - Market size and forecast (2024-2029) ($ million)
        • Data Table on Professional Trekkers - Market size and forecast (2024-2029) ($ million)
        • Chart on Professional Trekkers - Year-over-year growth (2024-2029) (%)
        • Data Table on Professional Trekkers - Year-over-year growth (2024-2029) (%)
      • 10.5 Outdoor Enthusiasts - Market size and forecast (2024-2029)
        • Chart on Outdoor Enthusiasts - Market size and forecast (2024-2029) ($ million)
        • Data Table on Outdoor Enthusiasts - Market size and forecast (2024-2029) ($ million)
        • Chart on Outdoor Enthusiasts - Year-over-year growth (2024-2029) (%)
        • Data Table on Outdoor Enthusiasts - Year-over-year growth (2024-2029) (%)
      • 10.6 Market opportunity by End-User
        • Market opportunity by End-User ($ million)
        • Data Table on Market opportunity by End-User ($ million)

      11 Market Segmentation by Material Type

      • 11.1 Market segments
        • Chart on Material Type - Market share (2024-2029) (%)
        • Data Table on Material Type - Market share (2024-2029) (%)
      • 11.2 Comparison by Material Type
        • Chart on Comparison by Material Type
        • Data Table on Comparison by Material Type
      • 11.3 Leather - Market size and forecast (2024-2029)
        • Chart on Leather - Market size and forecast (2024-2029) ($ million)
        • Data Table on Leather - Market size and forecast (2024-2029) ($ million)
        • Chart on Leather - Year-over-year growth (2024-2029) (%)
        • Data Table on Leather - Year-over-year growth (2024-2029) (%)
      • 11.4 Synthetic - Market size and forecast (2024-2029)
        • Chart on Synthetic - Market size and forecast (2024-2029) ($ million)
        • Data Table on Synthetic - Market size and forecast (2024-2029) ($ million)
        • Chart on Synthetic - Year-over-year growth (2024-2029) (%)
        • Data Table on Synthetic - Year-over-year growth (2024-2029) (%)
      • 11.5 Market opportunity by Material Type
        • Market opportunity by Material Type ($ million)
        • Data Table on Market opportunity by Material Type ($ million)

      12 Customer Landscape

      • 12.1 Customer landscape overview
        • Analysis of price sensitivity, lifecycle, customer purchase basket, adoption rates, and purchase criteria

      13 Geographic Landscape

      • 13.1 Geographic segmentation
        • Chart on Market share by geography 2024-2029 (%)
        • Data Table on Market share by geography 2024-2029 (%)
      • 13.2 Geographic comparison
        • Chart on Geographic comparison
        • Data Table on Geographic comparison
      • 13.3 Europe - Market size and forecast (2024-2029)
        • Chart on Europe - Market size and forecast (2024-2029) ($ million)
        • Data Table on Europe - Market size and forecast (2024-2029) ($ million)
        • Chart on Europe - Year-over-year growth (2024-2029) (%)
        • Data Table on Europe - Year-over-year growth (2024-2029) (%)
        • Chart on Europe - Market size and forecast 2024-2029 ($ million)
        • Data Table on Europe - Market size and forecast 2024-2029 ($ million)
        • Chart on Europe - Year-over-year growth 2024-2029 (%)
        • Data Table on Europe - Year-over-year growth 2024-2029 (%)
      • 13.4 North America - Market size and forecast (2024-2029)
        • Chart on North America - Market size and forecast (2024-2029) ($ million)
        • Data Table on North America - Market size and forecast (2024-2029) ($ million)
        • Chart on North America - Year-over-year growth (2024-2029) (%)
        • Data Table on North America - Year-over-year growth (2024-2029) (%)
        • Chart on North America - Market size and forecast 2024-2029 ($ million)
        • Data Table on North America - Market size and forecast 2024-2029 ($ million)
        • Chart on North America - Year-over-year growth 2024-2029 (%)
        • Data Table on North America - Year-over-year growth 2024-2029 (%)
      • 13.5 APAC - Market size and forecast (2024-2029)
        • Chart on APAC - Market size and forecast (2024-2029) ($ million)
        • Data Table on APAC - Market size and forecast (2024-2029) ($ million)
        • Chart on APAC - Year-over-year growth (2024-2029) (%)
        • Data Table on APAC - Year-over-year growth (2024-2029) (%)
        • Chart on APAC - Market size and forecast 2024-2029 ($ million)
        • Data Table on APAC - Market size and forecast 2024-2029 ($ million)
        • Chart on APAC - Year-over-year growth 2024-2029 (%)
        • Data Table on APAC - Year-over-year growth 2024-2029 (%)
      • 13.6 South America - Market size and forecast (2024-2029)
        • Chart on South America - Market size and forecast (2024-2029) ($ million)
        • Data Table on South America - Market size and forecast (2024-2029) ($ million)
        • Chart on South America - Year-over-year growth (2024-2029) (%)
        • Data Table on South America - Year-over-year growth (2024-2029) (%)
        • Chart on South America - Market size and forecast 2024-2029 ($ million)
        • Data Table on South America - Market size and forecast 2024-2029 ($ million)
        • Chart on South America - Year-over-year growth 2024-2029 (%)
        • Data Table on South America - Year-over-year growth 2024-2029 (%)
      • 13.7 Middle East and Africa - Market size and forecast (2024-2029)
        • Chart on Middle East and Africa - Market size and forecast (2024-2029) ($ million)
        • Data Table on Middle East and Africa - Market size and forecast (2024-2029) ($ million)
        • Chart on Middle East and Africa - Year-over-year growth (2024-2029) (%)
        • Data Table on Middle East and Africa - Year-over-year growth (2024-2029) (%)
        • Chart on Middle East and Africa - Market size and forecast 2024-2029 ($ million)
        • Data Table on Middle East and Africa - Market size and forecast 2024-2029 ($ million)
        • Chart on Middle East and Africa - Year-over-year growth 2024-2029 (%)
        • Data Table on Middle East and Africa - Year-over-year growth 2024-2029 (%)
      • 13.8 US - Market size and forecast (2024-2029)
        • Chart on US - Market size and forecast (2024-2029) ($ million)
        • Data Table on US - Market size and forecast (2024-2029) ($ million)
        • Chart on US - Year-over-year growth (2024-2029) (%)
        • Data Table on US - Year-over-year growth (2024-2029) (%)
        • Chart on US - Market size and forecast 2024-2029 ($ million)
        • Data Table on US - Market size and forecast 2024-2029 ($ million)
        • Chart on US - Year-over-year growth 2024-2029 (%)
        • Data Table on US - Year-over-year growth 2024-2029 (%)
      • 13.9 China - Market size and forecast (2024-2029)
        • Chart on China - Market size and forecast (2024-2029) ($ million)
        • Data Table on China - Market size and forecast (2024-2029) ($ million)
        • Chart on China - Year-over-year growth (2024-2029) (%)
        • Data Table on China - Year-over-year growth (2024-2029) (%)
        • Chart on Germany - Market size and forecast 2024-2029 ($ million)
        • Data Table on Germany - Market size and forecast 2024-2029 ($ million)
        • Chart on Germany - Year-over-year growth 2024-2029 (%)
        • Data Table on Germany - Year-over-year growth 2024-2029 (%)
      • 13.10 Japan - Market size and forecast (2024-2029)
        • Chart on Japan - Market size and forecast (2024-2029) ($ million)
        • Data Table on Japan - Market size and forecast (2024-2029) ($ million)
        • Chart on Japan - Year-over-year growth (2024-2029) (%)
        • Data Table on Japan - Year-over-year growth (2024-2029) (%)
        • Chart on France - Market size and forecast 2024-2029 ($ million)
        • Data Table on France - Market size and forecast 2024-2029 ($ million)
        • Chart on France - Year-over-year growth 2024-2029 (%)
        • Data Table on France - Year-over-year growth 2024-2029 (%)
      • 13.11 Germany - Market size and forecast (2024-2029)
        • Chart on Germany - Market size and forecast (2024-2029) ($ million)
        • Data Table on Germany - Market size and forecast (2024-2029) ($ million)
        • Chart on Germany - Year-over-year growth (2024-2029) (%)
        • Data Table on Germany - Year-over-year growth (2024-2029) (%)
        • Chart on China - Market size and forecast 2024-2029 ($ million)
        • Data Table on China - Market size and forecast 2024-2029 ($ million)
        • Chart on China - Year-over-year growth 2024-2029 (%)
        • Data Table on China - Year-over-year growth 2024-2029 (%)
      • 13.12 France - Market size and forecast (2024-2029)
        • Chart on France - Market size and forecast (2024-2029) ($ million)
        • Data Table on France - Market size and forecast (2024-2029) ($ million)
        • Chart on France - Year-over-year growth (2024-2029) (%)
        • Data Table on France - Year-over-year growth (2024-2029) (%)
        • Chart on Japan - Market size and forecast 2024-2029 ($ million)
        • Data Table on Japan - Market size and forecast 2024-2029 ($ million)
        • Chart on Japan - Year-over-year growth 2024-2029 (%)
        • Data Table on Japan - Year-over-year growth 2024-2029 (%)
      • 13.13 Spain - Market size and forecast (2024-2029)
        • Chart on Spain - Market size and forecast (2024-2029) ($ million)
        • Data Table on Spain - Market size and forecast (2024-2029) ($ million)
        • Chart on Spain - Year-over-year growth (2024-2029) (%)
        • Data Table on Spain - Year-over-year growth (2024-2029) (%)
        • Chart on Canada - Market size and forecast 2024-2029 ($ million)
        • Data Table on Canada - Market size and forecast 2024-2029 ($ million)
        • Chart on Canada - Year-over-year growth 2024-2029 (%)
        • Data Table on Canada - Year-over-year growth 2024-2029 (%)
      • 13.14 Canada - Market size and forecast (2024-2029)
        • Chart on Canada - Market size and forecast (2024-2029) ($ million)
        • Data Table on Canada - Market size and forecast (2024-2029) ($ million)
        • Chart on Canada - Year-over-year growth (2024-2029) (%)
        • Data Table on Canada - Year-over-year growth (2024-2029) (%)
        • Chart on UK - Market size and forecast 2024-2029 ($ million)
        • Data Table on UK - Market size and forecast 2024-2029 ($ million)
        • Chart on UK - Year-over-year growth 2024-2029 (%)
        • Data Table on UK - Year-over-year growth 2024-2029 (%)
      • 13.15 India - Market size and forecast (2024-2029)
        • Chart on India - Market size and forecast (2024-2029) ($ million)
        • Data Table on India - Market size and forecast (2024-2029) ($ million)
        • Chart on India - Year-over-year growth (2024-2029) (%)
        • Data Table on India - Year-over-year growth (2024-2029) (%)
        • Chart on India - Market size and forecast 2024-2029 ($ million)
        • Data Table on India - Market size and forecast 2024-2029 ($ million)
        • Chart on India - Year-over-year growth 2024-2029 (%)
        • Data Table on India - Year-over-year growth 2024-2029 (%)
      • 13.16 South Korea - Market size and forecast (2024-2029)
        • Chart on South Korea - Market size and forecast (2024-2029) ($ million)
        • Data Table on South Korea - Market size and forecast (2024-2029) ($ million)
        • Chart on South Korea - Year-over-year growth (2024-2029) (%)
        • Data Table on South Korea - Year-over-year growth (2024-2029) (%)
        • Chart on Italy - Market size and forecast 2024-2029 ($ million)
        • Data Table on Italy - Market size and forecast 2024-2029 ($ million)
        • Chart on Italy - Year-over-year growth 2024-2029 (%)
        • Data Table on Italy - Year-over-year growth 2024-2029 (%)
      • 13.17 France - Market size and forecast (2024-2029)
        • Chart on France - Market size and forecast (2024-2029) ($ million)
        • Data Table on France - Market size and forecast (2024-2029) ($ million)
        • Chart on France - Year-over-year growth (2024-2029) (%)
        • Data Table on France - Year-over-year growth (2024-2029) (%)
        • Chart on South Korea - Market size and forecast 2024-2029 ($ million)
        • Data Table on South Korea - Market size and forecast 2024-2029 ($ million)
        • Chart on South Korea - Year-over-year growth 2024-2029 (%)
        • Data Table on South Korea - Year-over-year growth 2024-2029 (%)
      • 13.18 Japan - Market size and forecast (2024-2029)
        • Chart on Japan - Market size and forecast (2024-2029) ($ million)
        • Data Table on Japan - Market size and forecast (2024-2029) ($ million)
        • Chart on Japan - Year-over-year growth (2024-2029) (%)
        • Data Table on Japan - Year-over-year growth (2024-2029) (%)
        • Market opportunity by geography ($ million)
        • Data Tables on Market opportunity by geography ($ million)
      • 13.19 Italy - Market size and forecast (2024-2029)
        • Chart on Italy - Market size and forecast (2024-2029) ($ million)
        • Data Table on Italy - Market size and forecast (2024-2029) ($ million)
        • Chart on Italy - Year-over-year growth (2024-2029) (%)
        • Data Table on Italy - Year-over-year growth (2024-2029) (%)
      • 13.20 Brazil - Market size and forecast (2024-2029)
        • Chart on Brazil - Market size and forecast (2024-2029) ($ million)
        • Data Table on Brazil - Market size and forecast (2024-2029) ($ million)
        • Chart on Brazil - Year-over-year growth (2024-2029) (%)
        • Data Table on Brazil - Year-over-year growth (2024-2029) (%)
      • 13.21 UAE - Market size and forecast (2024-2029)
        • Chart on UAE - Market size and forecast (2024-2029) ($ million)
        • Data Table on UAE - Market size and forecast (2024-2029) ($ million)
        • Chart on UAE - Year-over-year growth (2024-2029) (%)
        • Data Table on UAE - Year-over-year growth (2024-2029) (%)
      • 13.22 UK - Market size and forecast (2024-2029)
        • Chart on UK - Market size and forecast (2024-2029) ($ million)
        • Data Table on UK - Market size and forecast (2024-2029) ($ million)
        • Chart on UK - Year-over-year growth (2024-2029) (%)
        • Data Table on UK - Year-over-year growth (2024-2029) (%)
      • 13.23 Spain - Market size and forecast (2024-2029)
        • Chart on Spain - Market size and forecast (2024-2029) ($ million)
        • Data Table on Spain - Market size and forecast (2024-2029) ($ million)
        • Chart on Spain - Year-over-year growth (2024-2029) (%)
        • Data Table on Spain - Year-over-year growth (2024-2029) (%)
      • 13.24 Rest of World (ROW)Mexico - Market size and forecast (2024-2029)
        • Chart on Rest of World (ROW)Mexico - Market size and forecast (2024-2029) ($ million)
        • Data Table on Rest of World (ROW)Mexico - Market size and forecast (2024-2029) ($ million)
        • Chart on Rest of World (ROW)Mexico - Year-over-year growth (2024-2029) (%)
        • Data Table on Rest of World (ROW)Mexico - Year-over-year growth (2024-2029) (%)

      14 Drivers, Challenges, and Opportunity/Restraints

      • 14.1 Market drivers
        • 14.2 Market challenges
          • 14.3 Impact of drivers and challenges
            • Impact of drivers and challenges in 2024 and 2029
          • 14.4 Market opportunities/restraints

            15 Competitive Landscape

            • 15.1 Overview
              • 15.2 Competitive Landscape
                • Overview on criticality of inputs and factors of differentiation
              • 15.3 Landscape disruption
                • Overview on factors of disruption
              • 15.4 Industry risks
                • Impact of key risks on business

              16 Competitive Analysis

              • 16.1 Companies profiled
                • Companies covered
              • 16.2 Market positioning of companies
                • Matrix on companies position and classification
              • 16.3 The North Face (United States)
                • The North Face (United States) - Overview
                • The North Face (United States) - Product / Service
                • The North Face (United States) - Key offerings
              • 16.4 Columbia Sportswear (United States)
                • Columbia Sportswear (United States) - Overview
                • Columbia Sportswear (United States) - Product / Service
                • Columbia Sportswear (United States) - Key offerings
              • 16.5 Salomon (France)
                • Salomon (France) - Overview
                • Salomon (France) - Product / Service
                • Salomon (France) - Key offerings
              • 16.6 Merrell (United States)
                • Merrell (United States) - Overview
                • Merrell (United States) - Product / Service
                • Merrell (United States) - Key offerings
              • 16.7 Keen, Inc. (United States)
                • Keen, Inc. (United States) - Overview
                • Keen, Inc. (United States) - Product / Service
                • Keen, Inc. (United States) - Key offerings
              • 16.8 Arc'teryx (Canada)
                • Arc'teryx (Canada) - Overview
                • Arc'teryx (Canada) - Product / Service
                • Arc'teryx (Canada) - Key offerings
              • 16.9 La Sportiva (Italy)
                • La Sportiva (Italy) - Overview
                • La Sportiva (Italy) - Product / Service
                • La Sportiva (Italy) - Key offerings
              • 16.10 Adidas AG (Germany)
                • Adidas AG (Germany) - Overview
                • Adidas AG (Germany) - Product / Service
                • Adidas AG (Germany) - Key offerings
              • 16.11 Asics Corporation (Japan)
                • Asics Corporation (Japan) - Overview
                • Asics Corporation (Japan) - Product / Service
                • Asics Corporation (Japan) - Key offerings
              • 16.12 Haglöfs (Sweden)
                • Haglöfs (Sweden) - Overview
                • Haglöfs (Sweden) - Product / Service
                • Haglöfs (Sweden) - Key offerings
              • 16.13 Mammut Sports Group (Switzerland)
                • Mammut Sports Group (Switzerland) - Overview
                • Mammut Sports Group (Switzerland) - Product / Service
                • Mammut Sports Group (Switzerland) - Key offerings
              • 16.14 Patagonia, Inc. (United States)
                • Patagonia, Inc. (United States) - Overview
                • Patagonia, Inc. (United States) - Product / Service
                • Patagonia, Inc. (United States) - Key offerings
              • 16.15 Under Armour, Inc. (United States)
                • Under Armour, Inc. (United States) - Overview
                • Under Armour, Inc. (United States) - Product / Service
                • Under Armour, Inc. (United States) - Key offerings
              • 16.16 Puma SE (Germany)
                • Puma SE (Germany) - Overview
                • Puma SE (Germany) - Product / Service
                • Puma SE (Germany) - Key offerings
              • 16.17 Scarpa (Italy)
                • Scarpa (Italy) - Overview
                • Scarpa (Italy) - Product / Service
                • Scarpa (Italy) - Key offerings
              • 16.18 Oboz Footwear (United States)
                • Oboz Footwear (United States) - Overview
                • Oboz Footwear (United States) - Product / Service
                • Oboz Footwear (United States) - Key offerings
              • 16.19 Lowa Boots (Germany)
                • Lowa Boots (Germany) - Overview
                • Lowa Boots (Germany) - Product / Service
                • Lowa Boots (Germany) - Key offerings
              • 16.20 Tecnica Group (Italy)
                • Tecnica Group (Italy) - Overview
                • Tecnica Group (Italy) - Product / Service
                • Tecnica Group (Italy) - Key offerings
              • 16.21 Vaude (Germany)
                • Vaude (Germany) - Overview
                • Vaude (Germany) - Product / Service
                • Vaude (Germany) - Key offerings
              • 16.22 Helly Hansen (Norway)
                • Helly Hansen (Norway) - Overview
                • Helly Hansen (Norway) - Product / Service
                • Helly Hansen (Norway) - Key offerings

              17 Appendix

              • 17.1 Scope of the report
                • 17.2 Inclusions and exclusions checklist
                  • Inclusions checklist
                  • Exclusions checklist
                • 17.3 Currency conversion rates for US$
                  • Currency conversion rates for US$
                • 17.4 Research methodology
                  • Research methodology
                • 17.5 Data procurement
                  • Information sources
                • 17.6 Data validation
                  • Data validation
                • 17.7 Validation techniques employed for market sizing
                  • Validation techniques employed for market sizing
                • 17.8 Data synthesis
                  • Data synthesis
                • 17.9 360 degree market analysis
                  • 360 degree market analysis
                • 17.10 List of abbreviations
                  • List of abbreviations

                Research Methodology

                Technavio presents a detailed picture of the market by way of study, synthesis, and summation of data from multiple sources. The analysts have presented the various facets of the market with a particular focus on identifying the key industry influencers. The data thus presented is comprehensive, reliable, and the result of extensive research, both primary and secondary.

                INFORMATION SOURCES

                Primary sources

                • Manufacturers and suppliers
                • Channel partners
                • Industry experts
                • Strategic decision makers

                Secondary sources

                • Industry journals and periodicals
                • Government data
                • Financial reports of key industry players
                • Historical data
                • Press releases

                DATA ANALYSIS

                Data Synthesis

                • Collation of data
                • Estimation of key figures
                • Analysis of derived insights

                Data Validation

                • Triangulation with data models
                • Reference against proprietary databases
                • Corroboration with industry experts

                REPORT WRITING

                Qualitative

                • Market drivers
                • Market challenges
                • Market trends
                • Five forces analysis

                Quantitative

                • Market size and forecast
                • Market segmentation
                • Geographical insights
                • Competitive landscape

                Interested in this report?

                Get your sample now to see our research methodology and insights!

                Download Now

                Frequently Asked Questions

                Hiking And Trail Footwear market growth will increase by $ 8426.3 mn during 2025-2029 .

                The Hiking And Trail Footwear market is expected to grow at a CAGR of 10% during 2025-2029 .

                Hiking And Trail Footwear market is segmented by Product( Hiking footwear, Trail running footwear) Distribution Channel( Offline, Online, APAC, South America, Middle East and Africa)

                The North Face (United States), Columbia Sportswear (United States), Salomon (France), Merrell (United States), Keen, Inc. (United States), Arc'teryx (Canada), La Sportiva (Italy), Adidas AG (Germany), Asics Corporation (Japan), Haglöfs (Sweden), Mammut Sports Group (Switzerland), Patagonia, Inc. (United States), Under Armour, Inc. (United States), Puma SE (Germany), Scarpa (Italy), Oboz Footwear (United States), Lowa Boots (Germany), Tecnica Group (Italy), Vaude (Germany), Helly Hansen (Norway) are a few of the key vendors in the Hiking And Trail Footwear market.

                North America will register the highest growth rate of 35% among the other regions. Therefore, the Hiking And Trail Footwear market in North America is expected to garner significant business opportunities for the vendors during the forecast period.

                US, China, Germany, Canada, India, South Korea, France, Japan, Italy, Brazil, UAE, UK, SpainMexico

                • Increasing premiumization of hiking and trail running footwearAdvances in footwear technology have enabled several vendors is the driving factor this market.
                • such as Amer Sports is the driving factor this market.
                • Nike is the driving factor this market.
                • Inc. is the driving factor this market.
                • Puma SE is the driving factor this market.
                • and Adidas AG is the driving factor this market.
                • to introduce activity-specific footwear for hiking and trail running. Additionally is the driving factor this market.
                • innovations in technical fabrication is the driving factor this market.
                • design is the driving factor this market.
                • and product development have resulted in the premiumization of hiking and trail running footwear over the last few years.For instance is the driving factor this market.
                • Salomon S.A.S. is the driving factor this market.
                • a subsidiary of Amer Sports Corp. is the driving factor this market.
                • offers the S/LAB series of premium trail running footwear is the driving factor this market.
                • targeting competitive runners and professional hikers. These footwear offer high comfort and precise fit. Also is the driving factor this market.
                • they have an internal sleeve that offers better support to swollen feet. Additionally is the driving factor this market.
                • models such as S/LAB ULTRA feature a detached wing-type design to provide high adaptability to the arch and midfoot. In October 2020 is the driving factor this market.
                • Deckers Outdoor Corp. announced the launch of the TenNine Hike GTX is the driving factor this market.
                • a premium hiking boot.Growing consumer awareness about the benefits of specialized shoes has fueled the demand for premium hiking and trail running footwear over the last few years. Hence is the driving factor this market.
                • the increasing premiumization of hiking and trail running footwear is expected to drive the global hiking and trail footwear market during the forecast period. is the driving factor this market.

                The Hiking And Trail Footwear market vendors should focus on grabbing business opportunities from the Hiking footwear segment as it accounted for the largest market share in the base year.