Home Blood Pressure Monitoring Devices Market Analysis Asia, North America, Europe, Rest of World (ROW) - US, Germany, China, Japan, India - Size and Forecast 2024-2028

Home Blood Pressure Monitoring Devices Market Analysis Asia, North America, Europe, Rest of World (ROW) - US, Germany, China, Japan, India - Size and Forecast 2024-2028

Published: Mar 2024 167 Pages SKU: IRTNTR74065

Market Overview at a Glance

$787.03 Mn
Market Opportunity
6.76%
CAGR
5.8
YoY growth 2023-2024(%)

Home Blood Pressure Monitoring Devices Market Size 2024-2028

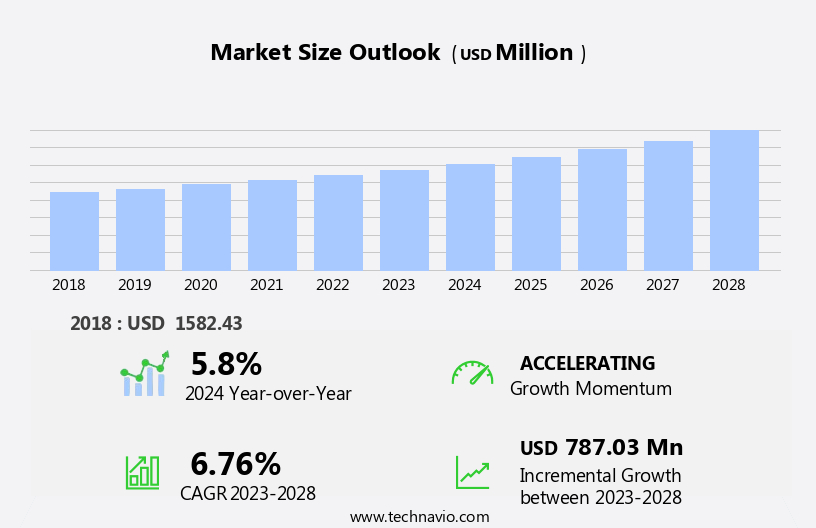
The home blood pressure monitoring devices market size is forecast to increase by USD 787.03 million, at a CAGR of 6.76% between 2023 and 2028.

  • The market is experiencing significant growth due to the increasing demand for convenient and accessible health monitoring solutions. This trend is driven by the widespread availability and affordability of home-based digital blood pressure monitoring devices. Technological advances in these devices, such as wireless connectivity and smartphone compatibility, are making it easier for individuals to track their blood pressure readings and share data with healthcare providers. However, the market also faces challenges, including the presence of a large population of undiagnosed hypertension. Many individuals are unaware of their condition, and the use of home blood pressure monitoring devices can help identify and manage hypertension more effectively.
  • Yet, the stigma surrounding self-monitoring and the need for proper education and guidance may hinder the adoption of these devices. Companies seeking to capitalize on market opportunities must focus on addressing these challenges through targeted marketing efforts, user-friendly designs, and partnerships with healthcare providers. By doing so, they can effectively meet the growing demand for home blood pressure monitoring devices and improve overall patient care.

What will be the Size of the Home Blood Pressure Monitoring Devices Market during the forecast period?

Home Blood Pressure Monitoring Devices Market Size

Explore in-depth regional segment analysis with market size data - historical 2018-2022 and forecasts 2024-2028 - in the full report.  
Request Free Sample

The home blood pressure monitoring market continues to evolve, driven by advancements in technology and increasing demand for remote patient monitoring solutions. Wearable sensor technology and wireless transmission enable real-time monitoring of mean arterial pressure using oscillometric measurement with clinical grade accuracy. Upper arm cuffs with automatic inflation systems and wrist cuffs with Bluetooth connectivity offer flexibility and convenience. Pulse wave velocity, heart rate variability, irregular heartbeat detection, and blood pressure variability are essential features that enhance the functionality of these devices. Patient self-monitoring and app-based monitoring facilitate easy access to data and enable better management of health conditions.

Device calibration, maintenance, data security protocols, and battery life are critical considerations for ensuring the reliability and effectiveness of home blood pressure monitoring devices. Sphygmomanometer accuracy, user interface design, data logging feature, and ECG integration are other essential aspects that contribute to the overall value proposition. Continuous innovation in this market is reflected in the integration of new features such as pulse rate measurement, mean arterial pressure monitoring, and validated measurement. The ongoing development of these devices is expected to expand their applications across various sectors, including telemedicine, remote patient care, and personal health management.

How is this Home Blood Pressure Monitoring Devices Industry segmented?

The home blood pressure monitoring devices industry research report provides comprehensive data (region-wise segment analysis), with forecasts and estimates in "USD million" for the period 2024-2028, as well as historical data from 2018-2022 for the following segments.

  • Distribution Channel
    • Offline
    • Online
  • Type
    • Upper arm
    • Wrist
    • Finger
  • Geography
    • North America
      • US
    • Europe
      • Germany
    • APAC
      • China
      • India
      • Japan
    • Rest of World (ROW)

By Distribution Channel Insights

The offline segment is estimated to witness significant growth during the forecast period.

The market is witnessing significant advancements with the integration of wireless transmission, wearable sensor technology, and clinical-grade accuracy. Oscillometric measurement, a non-invasive technique, is gaining popularity due to its ease of use and reliability. Wearable sensors, such as wrist cuffs and finger cuffs, enable continuous monitoring, providing valuable insights into mean arterial pressure, heart rate variability, and blood pressure variability. Bluetooth connectivity allows seamless data transfer to smartphones and apps for app-based monitoring and remote patient monitoring. Automatic inflation systems ensure accurate diastolic and systolic pressure readings, while pulse wave velocity and ECG integration offer additional health metrics.

Device calibration and maintenance are crucial for maintaining accuracy and longevity. Battery life and data logging features are essential considerations for consumers. Clinical-grade accuracy is essential for patients with chronic conditions, making oscillometric measurement and validated measurement crucial. Data security protocols ensure the confidentiality of sensitive health information. User interface design plays a significant role in user experience and adoption. Remote patient monitoring enables healthcare professionals to monitor patients' blood pressure in real-time, improving patient outcomes and reducing healthcare costs. Irregular heartbeat detection and pulse rate measurement offer additional health insights, enhancing the overall value proposition of home blood pressure monitoring devices.

Home Blood Pressure Monitoring Devices Market Size

Request Free Sample

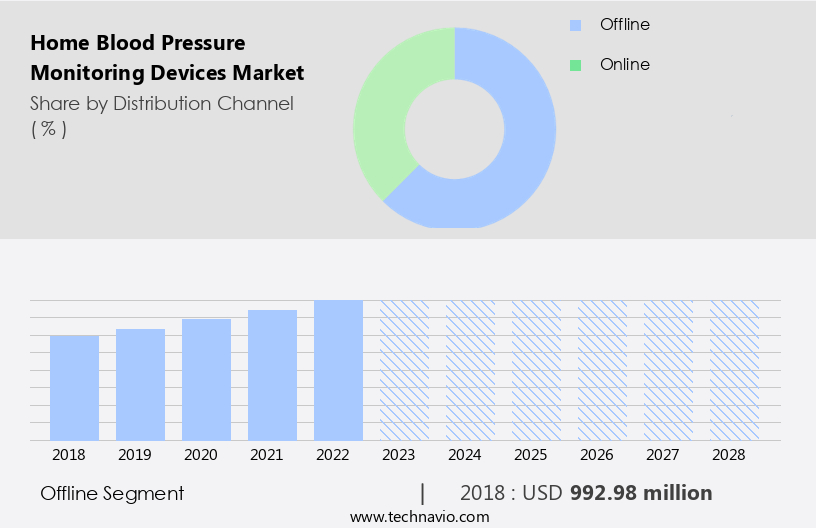
The Offline segment was valued at USD 992.98 million in 2018 and showed a gradual increase during the forecast period.

Regional Analysis

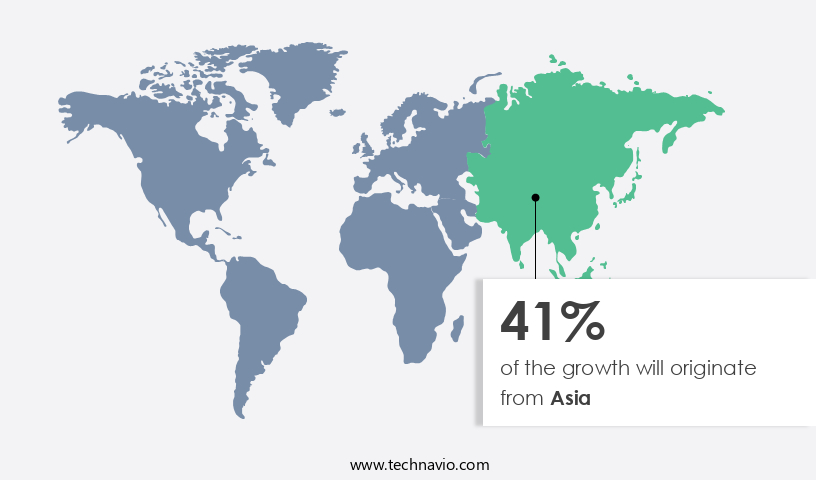
Asia is estimated to contribute 41% to the growth of the global market during the forecast period.Technavio's analysts have elaborately explained the regional trends and drivers that shape the market during the forecast period.

Home Blood Pressure Monitoring Devices Market Share by Geography

 Request Free Sample

The market is experiencing significant growth, particularly in Asia, due to the aging population and rising prevalence of cardiovascular diseases. Oscillometric measurement technology, which uses a finger or wrist cuff for monitoring, is gaining popularity due to its convenience and clinical-grade accuracy. Wireless transmission and Bluetooth connectivity enable seamless data transfer to apps for app-based monitoring and remote patient monitoring. Wearable sensor technology and automatic inflation systems further enhance the user experience. Heart rate variability, irregular heartbeat detection, and blood pressure variability are essential features for comprehensive health assessment. Device calibration and maintenance ensure accurate readings, while data security protocols protect sensitive health information.

Systolic and diastolic pressure readings, pulse wave velocity, and pulse rate measurement provide valuable insights into cardiovascular health. The market's evolution includes validated measurement, ECG integration, and user interface design for enhanced user experience. Battery life is a crucial consideration for long-term usage. companies focus on meeting the growing demand for home blood pressure monitoring devices by catering to the needs of an increasingly health-conscious population.

Market Dynamics

Our researchers analyzed the data with 2023 as the base year, along with the key drivers, trends, and challenges. A holistic analysis of drivers will help companies refine their marketing strategies to gain a competitive advantage.

The market: Innovations and Applications the market encompasses a range of technologies designed to enable individuals to measure their blood pressure levels in the comfort of their own homes. With considerations like convenience, affordability, and accessibility driving demand, this market continues to evolve, offering new applications and features for consumers. Key areas involve advanced technologies such as wireless connectivity, smartphone compatibility, and automated data tracking. Through methods such as Bluetooth and Wi-Fi, home blood pressure monitoring devices can seamlessly transmit data to smartphones and other digital platforms, enabling users to easily monitor trends and trends over time. Automated data tracking features allow for effortless storage and organization of readings, providing valuable insights for both individuals and healthcare professionals. Moreover, home blood pressure monitoring devices cater to various user groups, including those with chronic conditions, seniors, and individuals seeking to maintain optimal health. These devices offer benefits such as early detection and intervention, reduced healthcare costs, and increased patient engagement. Focusing on user experience, some home blood pressure monitoring devices incorporate features like voice prompts, large displays, and ergonomic designs to ensure ease of use for all users. Additionally, some devices offer multiple user profiles, allowing families to monitor the health of multiple members within a household. Innovations in home blood pressure monitoring devices also extend to wearable and non-invasive technologies, offering more discreet and convenient options for users. These advancements contribute to the growing popularity of home blood pressure monitoring, making it an essential tool for self-care and proactive healthcare management.

What are the key market drivers leading to the rise in the adoption of Home Blood Pressure Monitoring Devices Industry?

  • The increasing demand for home-based digital blood pressure monitoring devices is the primary market driver, as more individuals prioritize convenient and continuous health monitoring solutions. 
  • Home blood pressure monitoring devices have gained significance in the healthcare industry due to the rising prevalence of hypertension and cardiovascular diseases. These devices enable patients to monitor their mean arterial pressure from the comfort of their homes, facilitating regular tracking and timely intervention. The latest advancements in wireless transmission technology and wearable sensor tech have made home blood pressure monitoring more convenient and efficient. Oscillometric measurement, an advanced technique used in these devices, ensures clinical-grade accuracy through automatic inflation systems and finger cuffs.
  • Wearable devices, such as the OMRON BP786 and Microlife WatchBP, offer additional features like syncing with smartphones and automatic pulse irregularity detection, respectively. These innovations are driving the demand for home blood pressure monitoring devices, empowering individuals to take charge of their health and collaborate closely with healthcare professionals.

What are the market trends shaping the Home Blood Pressure Monitoring Devices Industry?

  • The trend in home blood pressure monitoring devices is driven by technological advances. These innovations are making it mandatory for more individuals to prioritize their health by enabling accurate and convenient self-monitoring.
  • The market is experiencing significant technological advancements, with a focus on enhancing device design, compatibility, portability, and accuracy. Wrist cuff models with Bluetooth connectivity are gaining popularity due to their convenience and ease of use. Heart rate variability and irregular heartbeat detection features are also becoming increasingly common, providing users with more comprehensive health information. Device calibration and maintenance are essential considerations for ensuring accurate readings over time. Manufacturers are investing heavily in research and development to introduce innovative digital blood pressure monitoring devices that cater to the evolving needs of consumers.
  • For instance, Welch Allyn's Connex ProBP 3400 is a compact digital device that offers fast and precise readings within 15 seconds, making it a valuable addition to home healthcare solutions.

What challenges does the Home Blood Pressure Monitoring Devices Industry face during its growth?

  • The significant prevalence of undiagnosed hypertension within the population poses a substantial challenge to the growth of the healthcare industry. 
  • High blood pressure, a leading cause of heart disease and stroke, affects millions of people worldwide, with an estimated 25% of this population remaining undiagnosed. In the US alone, the Centers for Disease Control and Prevention (CDC) reports that around 13 million adults are unaware of their condition, resulting in untreated hypertension. This is concerning as hypertension often presents no symptoms, making self-monitoring crucial. Remote patient monitoring through home blood pressure monitoring devices, such as upper arm cuff devices, is an effective solution.
  • These devices provide accurate readings of both systolic and diastolic pressure readings. Advanced technologies like app-based monitoring and pulse wave velocity measurement offer added benefits, enabling patients to track their progress and share data with healthcare providers. By promoting patient self-monitoring, early detection, and timely intervention, home blood pressure monitoring devices can significantly reduce the number of undiagnosed cases and improve patient outcomes.

Exclusive Customer Landscape

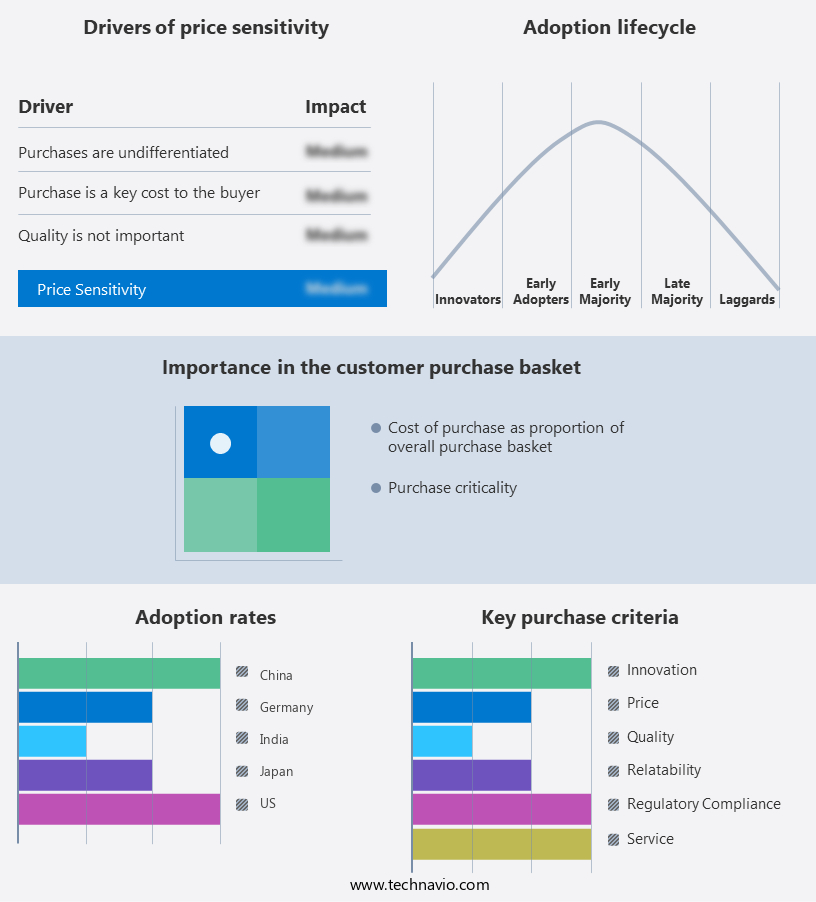
The home blood pressure monitoring devices market forecasting report includes the adoption lifecycle of the market, covering from the innovator's stage to the laggard's stage. It focuses on adoption rates in different regions based on penetration. Furthermore, the home blood pressure monitoring devices market report also includes key purchase criteria and drivers of price sensitivity to help companies evaluate and develop their market growth analysis strategies.

Home Blood Pressure Monitoring Devices Market Share by Geography

 Customer Landscape

Key Companies & Market Insights

Companies are implementing various strategies, such as strategic alliances, home blood pressure monitoring devices market forecast, partnerships, mergers and acquisitions, geographical expansion, and product/service launches, to enhance their presence in the industry.

A and D HOLON Holdings Co. Ltd. - This company introduces two home blood pressure monitoring devices: the Premium 2 User and Essential One button models. 

The industry research and growth report includes detailed analyses of the competitive landscape of the market and information about key companies, including:

  • A and D HOLON Holdings Co. Ltd.
  • American Diagnostic Corp.
  • Baxter International Inc.
  • Beurer GmbH
  • Contec Medical Systems Co. Ltd.
  • ForaCare Inc.
  • HEINE Optotechnik GmbH and Co. KG
  • Koninklijke Philips N.V.
  • Microlife Corp.
  • Morepen Laboratories Ltd.
  • Nokia Corp.
  • OMRON Corp.
  • Qardio Inc.
  • Rossmax International Ltd.
  • Spengler Holtex Group
  • Telli Health LLC
  • Tianjin Jiuan Medical Electronics Co. Ltd.
  • Wellue Health
  • Zewa Inc.
  • Halma Plc

Qualitative and quantitative analysis of companies has been conducted to help clients understand the wider business environment as well as the strengths and weaknesses of key industry players. Data is qualitatively analyzed to categorize companies as pure play, category-focused, industry-focused, and diversified; it is quantitatively analyzed to categorize companies as dominant, leading, strong, tentative, and weak.

Recent Development and News in Home Blood Pressure Monitoring Devices Market

  • In January 2024, Omron Healthcare, a global leader in the healthcare technology industry, launched its new Evolv Wireless Upper Arm Blood Pressure Monitor with Bluetooth connectivity. This device allows users to easily track their blood pressure readings using a smartphone application (Omron Connect). (Source: Omron Healthcare Press Release)
  • In March 2024, FDA approved Withings' Blood Pressure Analyzer for Over-the-Counter (OTC) use. This wireless, smart blood pressure monitor can be synced with a smartphone app and offers features like trend analysis and heart health insights. (Source: FDA Press Release)
  • In May 2024, Philips and Google announced a strategic partnership to integrate Google Assistant and Google Fit with Philips' connected health devices, including home blood pressure monitors. This collaboration aims to provide users with a more seamless health monitoring experience. (Source: Philips Press Release)
  • In April 2025, iHealth Labs, a leading manufacturer of wireless health monitoring devices, raised USD 30 million in a Series D funding round. The funds will be used to expand their product portfolio, enhance R&D capabilities, and boost marketing efforts. (Source: BusinessWire)

Research Analyst Overview

  • The market is witnessing significant advancements, driven by the integration of digital display, user experience testing, and mobile application design. These innovations enable real-time monitoring and data visualization tools for users, enhancing health data management and compliance with regulations. Sensor accuracy and error rate are critical factors, with medical-grade sensors and pressure sensor calibration ensuring clinical validation studies. Data encryption methods and data transfer protocols safeguard user privacy. Advanced analytics, predictive analytics, and cuff inflation rate adjustments contribute to long-term reliability.
  • Power consumption and device ergonomics are essential considerations for user-friendly interfaces. Accuracy validation and device calibration are ongoing priorities, while data interpretation tools provide valuable insights for personal health management. Pressure sensor technology continues to evolve, enabling advanced features and improving overall market trends.

Dive into Technavio's robust research methodology, blending expert interviews, extensive data synthesis, and validated models for unparalleled Home Blood Pressure Monitoring Devices Market insights. See full methodology.

Market Scope

Report Coverage

Details

Page number

167

Base year

2023

Historic period

2018-2022

Forecast period

2024-2028

Growth momentum & CAGR

Accelerate at a CAGR of 6.76%

Market growth 2024-2028

USD 787.03 million

Market structure

Concentrated

YoY growth 2023-2024(%)

5.8

Key countries

US, Germany, China, Japan, and India

Competitive landscape

Leading Companies, Market Positioning of Companies, Competitive Strategies, and Industry Risks

Request Free Sample

What are the Key Data Covered in this Home Blood Pressure Monitoring Devices Market Research and Growth Report?

  • CAGR of the Home Blood Pressure Monitoring Devices industry during the forecast period
  • Detailed information on factors that will drive the growth and forecasting between 2024 and 2028
  • Precise estimation of the size of the market and its contribution of the industry in focus to the parent market
  • Accurate predictions about upcoming growth and trends and changes in consumer behaviour
  • Growth of the market across Asia, North America, Europe, and Rest of World (ROW)
  • Thorough analysis of the market's competitive landscape and detailed information about companies
  • Comprehensive analysis of factors that will challenge the home blood pressure monitoring devices market growth of industry companies

We can help! Our analysts can customize this home blood pressure monitoring devices market research report to meet your requirements.

Get in touch

1 Executive Summary

  • 1.1 Market overview
    • Exhibit 01: Executive Summary – Chart on Market Overview
    • Exhibit 02: Executive Summary – Data Table on Market Overview
    • Exhibit 03: Executive Summary – Chart on Global Market Characteristics
    • Exhibit 04: Executive Summary – Chart on Market by Geography
    • Exhibit 05: Executive Summary – Chart on Market Segmentation by Distribution Channel
    • Exhibit 06: Executive Summary – Chart on Market Segmentation by Type
    • Exhibit 07: Executive Summary – Chart on Incremental Growth
    • Exhibit 08: Executive Summary – Data Table on Incremental Growth
    • Exhibit 09: Executive Summary – Chart on Vendor Market Positioning

2 Market Landscape

  • 2.1 Market ecosystem
    • Exhibit 10: Parent market
    • Exhibit 11: Market Characteristics

3 Market Sizing

  • 3.1 Market definition
    • Exhibit 12: Offerings of vendors included in the market definition
  • 3.2 Market segment analysis
    • Exhibit 13: Market segments
  • 3.3 Market size 2023
    • 3.4 Market outlook: Forecast for 2023-2028
      • Exhibit 14: Chart on Global - Market size and forecast 2023-2028 ($ million)
      • Exhibit 15: Data Table on Global - Market size and forecast 2023-2028 ($ million)
      • Exhibit 16: Chart on Global Market: Year-over-year growth 2023-2028 (%)
      • Exhibit 17: Data Table on Global Market: Year-over-year growth 2023-2028 (%)

    4 Historic Market Size

    • 4.1 Global home blood pressure monitoring devices market 2018 - 2022
      • Exhibit 18: Historic Market Size – Data Table on global home blood pressure monitoring devices market 2018 - 2022 ($ million)
    • 4.2 Distribution Channel Segment Analysis 2018 - 2022
      • Exhibit 19: Historic Market Size – Distribution Channel Segment 2018 - 2022 ($ million)
    • 4.3 Type Segment Analysis 2018 - 2022
      • Exhibit 20: Historic Market Size – Type Segment 2018 - 2022 ($ million)
    • 4.4 Geography Segment Analysis 2018 - 2022
      • Exhibit 21: Historic Market Size – Geography Segment 2018 - 2022 ($ million)
    • 4.5 Country Segment Analysis 2018 - 2022
      • Exhibit 22: Historic Market Size – Country Segment 2018 - 2022 ($ million)

    5 Five Forces Analysis

    • 5.1 Five forces summary
      • Exhibit 23: Five forces analysis - Comparison between 2023 and 2028
    • 5.2 Bargaining power of buyers
      • Exhibit 24: Chart on Bargaining power of buyers – Impact of key factors 2023 and 2028
    • 5.3 Bargaining power of suppliers
      • Exhibit 25: Bargaining power of suppliers – Impact of key factors in 2023 and 2028
    • 5.4 Threat of new entrants
      • Exhibit 26: Threat of new entrants – Impact of key factors in 2023 and 2028
    • 5.5 Threat of substitutes
      • Exhibit 27: Threat of substitutes – Impact of key factors in 2023 and 2028
    • 5.6 Threat of rivalry
      • Exhibit 28: Threat of rivalry – Impact of key factors in 2023 and 2028
    • 5.7 Market condition
      • Exhibit 29: Chart on Market condition - Five forces 2023 and 2028

    6 Market Segmentation by Distribution Channel

    • 6.1 Market segments
      • Exhibit 30: Chart on Distribution Channel - Market share 2023-2028 (%)
      • Exhibit 31: Data Table on Distribution Channel - Market share 2023-2028 (%)
    • 6.2 Comparison by Distribution Channel
      • Exhibit 32: Chart on Comparison by Distribution Channel
      • Exhibit 33: Data Table on Comparison by Distribution Channel
    • 6.3 Offline - Market size and forecast 2023-2028
      • Exhibit 34: Chart on Offline - Market size and forecast 2023-2028 ($ million)
      • Exhibit 35: Data Table on Offline - Market size and forecast 2023-2028 ($ million)
      • Exhibit 36: Chart on Offline - Year-over-year growth 2023-2028 (%)
      • Exhibit 37: Data Table on Offline - Year-over-year growth 2023-2028 (%)
    • 6.4 Online - Market size and forecast 2023-2028
      • Exhibit 38: Chart on Online - Market size and forecast 2023-2028 ($ million)
      • Exhibit 39: Data Table on Online - Market size and forecast 2023-2028 ($ million)
      • Exhibit 40: Chart on Online - Year-over-year growth 2023-2028 (%)
      • Exhibit 41: Data Table on Online - Year-over-year growth 2023-2028 (%)
    • 6.5 Market opportunity by Distribution Channel
      • Exhibit 42: Market opportunity by Distribution Channel ($ million)
      • Exhibit 43: Data Table on Market opportunity by Distribution Channel ($ million)

    7 Market Segmentation by Type

    • 7.1 Market segments
      • Exhibit 44: Chart on Type - Market share 2023-2028 (%)
      • Exhibit 45: Data Table on Type - Market share 2023-2028 (%)
    • 7.2 Comparison by Type
      • Exhibit 46: Chart on Comparison by Type
      • Exhibit 47: Data Table on Comparison by Type
    • 7.3 Upper arm - Market size and forecast 2023-2028
      • Exhibit 48: Chart on Upper arm - Market size and forecast 2023-2028 ($ million)
      • Exhibit 49: Data Table on Upper arm - Market size and forecast 2023-2028 ($ million)
      • Exhibit 50: Chart on Upper arm - Year-over-year growth 2023-2028 (%)
      • Exhibit 51: Data Table on Upper arm - Year-over-year growth 2023-2028 (%)
    • 7.4 Wrist - Market size and forecast 2023-2028
      • Exhibit 52: Chart on Wrist - Market size and forecast 2023-2028 ($ million)
      • Exhibit 53: Data Table on Wrist - Market size and forecast 2023-2028 ($ million)
      • Exhibit 54: Chart on Wrist - Year-over-year growth 2023-2028 (%)
      • Exhibit 55: Data Table on Wrist - Year-over-year growth 2023-2028 (%)
    • 7.5 Finger - Market size and forecast 2023-2028
      • Exhibit 56: Chart on Finger - Market size and forecast 2023-2028 ($ million)
      • Exhibit 57: Data Table on Finger - Market size and forecast 2023-2028 ($ million)
      • Exhibit 58: Chart on Finger - Year-over-year growth 2023-2028 (%)
      • Exhibit 59: Data Table on Finger - Year-over-year growth 2023-2028 (%)
    • 7.6 Market opportunity by Type
      • Exhibit 60: Market opportunity by Type ($ million)
      • Exhibit 61: Data Table on Market opportunity by Type ($ million)

    8 Customer Landscape

    • 8.1 Customer landscape overview
      • Exhibit 62: Analysis of price sensitivity, lifecycle, customer purchase basket, adoption rates, and purchase criteria

    9 Geographic Landscape

    • 9.1 Geographic segmentation
      • Exhibit 63: Chart on Market share by geography 2023-2028 (%)
      • Exhibit 64: Data Table on Market share by geography 2023-2028 (%)
    • 9.2 Geographic comparison
      • Exhibit 65: Chart on Geographic comparison
      • Exhibit 66: Data Table on Geographic comparison
    • 9.3 Asia - Market size and forecast 2023-2028
      • Exhibit 67: Chart on Asia - Market size and forecast 2023-2028 ($ million)
      • Exhibit 68: Data Table on Asia - Market size and forecast 2023-2028 ($ million)
      • Exhibit 69: Chart on Asia - Year-over-year growth 2023-2028 (%)
      • Exhibit 70: Data Table on Asia - Year-over-year growth 2023-2028 (%)
    • 9.4 North America - Market size and forecast 2023-2028
      • Exhibit 71: Chart on North America - Market size and forecast 2023-2028 ($ million)
      • Exhibit 72: Data Table on North America - Market size and forecast 2023-2028 ($ million)
      • Exhibit 73: Chart on North America - Year-over-year growth 2023-2028 (%)
      • Exhibit 74: Data Table on North America - Year-over-year growth 2023-2028 (%)
    • 9.5 Europe - Market size and forecast 2023-2028
      • Exhibit 75: Chart on Europe - Market size and forecast 2023-2028 ($ million)
      • Exhibit 76: Data Table on Europe - Market size and forecast 2023-2028 ($ million)
      • Exhibit 77: Chart on Europe - Year-over-year growth 2023-2028 (%)
      • Exhibit 78: Data Table on Europe - Year-over-year growth 2023-2028 (%)
    • 9.6 Rest of World (ROW) - Market size and forecast 2023-2028
      • Exhibit 79: Chart on Rest of World (ROW) - Market size and forecast 2023-2028 ($ million)
      • Exhibit 80: Data Table on Rest of World (ROW) - Market size and forecast 2023-2028 ($ million)
      • Exhibit 81: Chart on Rest of World (ROW) - Year-over-year growth 2023-2028 (%)
      • Exhibit 82: Data Table on Rest of World (ROW) - Year-over-year growth 2023-2028 (%)
    • 9.7 US - Market size and forecast 2023-2028
      • Exhibit 83: Chart on US - Market size and forecast 2023-2028 ($ million)
      • Exhibit 84: Data Table on US - Market size and forecast 2023-2028 ($ million)
      • Exhibit 85: Chart on US - Year-over-year growth 2023-2028 (%)
      • Exhibit 86: Data Table on US - Year-over-year growth 2023-2028 (%)
    • 9.8 China - Market size and forecast 2023-2028
      • Exhibit 87: Chart on China - Market size and forecast 2023-2028 ($ million)
      • Exhibit 88: Data Table on China - Market size and forecast 2023-2028 ($ million)
      • Exhibit 89: Chart on China - Year-over-year growth 2023-2028 (%)
      • Exhibit 90: Data Table on China - Year-over-year growth 2023-2028 (%)
    • 9.9 Japan - Market size and forecast 2023-2028
      • Exhibit 91: Chart on Japan - Market size and forecast 2023-2028 ($ million)
      • Exhibit 92: Data Table on Japan - Market size and forecast 2023-2028 ($ million)
      • Exhibit 93: Chart on Japan - Year-over-year growth 2023-2028 (%)
      • Exhibit 94: Data Table on Japan - Year-over-year growth 2023-2028 (%)
    • 9.10 India - Market size and forecast 2023-2028
      • Exhibit 95: Chart on India - Market size and forecast 2023-2028 ($ million)
      • Exhibit 96: Data Table on India - Market size and forecast 2023-2028 ($ million)
      • Exhibit 97: Chart on India - Year-over-year growth 2023-2028 (%)
      • Exhibit 98: Data Table on India - Year-over-year growth 2023-2028 (%)
    • 9.11 Germany - Market size and forecast 2023-2028
      • Exhibit 99: Chart on Germany - Market size and forecast 2023-2028 ($ million)
      • Exhibit 100: Data Table on Germany - Market size and forecast 2023-2028 ($ million)
      • Exhibit 101: Chart on Germany - Year-over-year growth 2023-2028 (%)
      • Exhibit 102: Data Table on Germany - Year-over-year growth 2023-2028 (%)
    • 9.12 Market opportunity by geography
      • Exhibit 103: Market opportunity by geography ($ million)
      • Exhibit 104: Data Tables on Market opportunity by geography ($ million)

    10 Drivers, Challenges, and Trends

    • 10.1 Market drivers
      • 10.2 Market challenges
        • 10.3 Impact of drivers and challenges
          • Exhibit 105: Impact of drivers and challenges in 2023 and 2028
        • 10.4 Market trends

          11 Vendor Landscape

          • 11.1 Overview
            • 11.2 Vendor landscape
              • Exhibit 106: Overview on Criticality of inputs and Factors of differentiation
            • 11.3 Landscape disruption
              • Exhibit 107: Overview on factors of disruption
            • 11.4 Industry risks
              • Exhibit 108: Impact of key risks on business

            12 Vendor Analysis

            • 12.1 Vendors covered
              • Exhibit 109: Vendors covered
            • 12.2 Market positioning of vendors
              • Exhibit 110: Matrix on vendor position and classification
            • 12.3 A and D HOLON Holdings Co. Ltd.
              • Exhibit 111: A and D HOLON Holdings Co. Ltd. - Overview
              • Exhibit 112: A and D HOLON Holdings Co. Ltd. - Business segments
              • Exhibit 113: A and D HOLON Holdings Co. Ltd. - Key offerings
              • Exhibit 114: A and D HOLON Holdings Co. Ltd. - Segment focus
            • 12.4 American Diagnostic Corp.
              • Exhibit 115: American Diagnostic Corp. - Overview
              • Exhibit 116: American Diagnostic Corp. - Product / Service
              • Exhibit 117: American Diagnostic Corp. - Key offerings
            • 12.5 Baxter International Inc.
              • Exhibit 118: Baxter International Inc. - Overview
              • Exhibit 119: Baxter International Inc. - Business segments
              • Exhibit 120: Baxter International Inc. - Key news
              • Exhibit 121: Baxter International Inc. - Key offerings
              • Exhibit 122: Baxter International Inc. - Segment focus
            • 12.6 Beurer GmbH
              • Exhibit 123: Beurer GmbH - Overview
              • Exhibit 124: Beurer GmbH - Product / Service
              • Exhibit 125: Beurer GmbH - Key offerings
            • 12.7 Contec Medical Systems Co. Ltd.
              • Exhibit 126: Contec Medical Systems Co. Ltd. - Overview
              • Exhibit 127: Contec Medical Systems Co. Ltd. - Product / Service
              • Exhibit 128: Contec Medical Systems Co. Ltd. - Key offerings
            • 12.8 ForaCare Inc.
              • Exhibit 129: ForaCare Inc. - Overview
              • Exhibit 130: ForaCare Inc. - Product / Service
              • Exhibit 131: ForaCare Inc. - Key offerings
            • 12.9 Halma Plc
              • Exhibit 132: Halma Plc - Overview
              • Exhibit 133: Halma Plc - Business segments
              • Exhibit 134: Halma Plc - Key news
              • Exhibit 135: Halma Plc - Key offerings
              • Exhibit 136: Halma Plc - Segment focus
            • 12.10 Koninklijke Philips N.V.
              • Exhibit 137: Koninklijke Philips N.V. - Overview
              • Exhibit 138: Koninklijke Philips N.V. - Business segments
              • Exhibit 139: Koninklijke Philips N.V. - Key news
              • Exhibit 140: Koninklijke Philips N.V. - Key offerings
              • Exhibit 141: Koninklijke Philips N.V. - Segment focus
            • 12.11 Morepen Laboratories Ltd.
              • Exhibit 142: Morepen Laboratories Ltd. - Overview
              • Exhibit 143: Morepen Laboratories Ltd. - Business segments
              • Exhibit 144: Morepen Laboratories Ltd. - Key offerings
              • Exhibit 145: Morepen Laboratories Ltd. - Segment focus
            • 12.12 Nokia Corp.
              • Exhibit 146: Nokia Corp. - Overview
              • Exhibit 147: Nokia Corp. - Business segments
              • Exhibit 148: Nokia Corp. - Key offerings
              • Exhibit 149: Nokia Corp. - Segment focus
            • 12.13 OMRON Corp.
              • Exhibit 150: OMRON Corp. - Overview
              • Exhibit 151: OMRON Corp. - Business segments
              • Exhibit 152: OMRON Corp. - Key news
              • Exhibit 153: OMRON Corp. - Key offerings
              • Exhibit 154: OMRON Corp. - Segment focus
            • 12.14 Qardio Inc.
              • Exhibit 155: Qardio Inc. - Overview
              • Exhibit 156: Qardio Inc. - Product / Service
              • Exhibit 157: Qardio Inc. - Key offerings
            • 12.15 Rossmax International Ltd.
              • Exhibit 158: Rossmax International Ltd. - Overview
              • Exhibit 159: Rossmax International Ltd. - Product / Service
              • Exhibit 160: Rossmax International Ltd. - Key offerings
            • 12.16 Spengler Holtex Group
              • Exhibit 161: Spengler Holtex Group - Overview
              • Exhibit 162: Spengler Holtex Group - Product / Service
              • Exhibit 163: Spengler Holtex Group - Key offerings
            • 12.17 Tianjin Jiuan Medical Electronics Co. Ltd.
              • Exhibit 164: Tianjin Jiuan Medical Electronics Co. Ltd. - Overview
              • Exhibit 165: Tianjin Jiuan Medical Electronics Co. Ltd. - Product / Service
              • Exhibit 166: Tianjin Jiuan Medical Electronics Co. Ltd. - Key offerings

            13 Appendix

            • 13.1 Scope of the report
              • 13.2 Inclusions and exclusions checklist
                • Exhibit 167: Inclusions checklist
                • Exhibit 168: Exclusions checklist
              • 13.3 Currency conversion rates for US$
                • Exhibit 169: Currency conversion rates for US$
              • 13.4 Research methodology
                • Exhibit 170: Research methodology
                • Exhibit 171: Validation techniques employed for market sizing
                • Exhibit 172: Information sources
              • 13.5 List of abbreviations
                • Exhibit 173: List of abbreviations

              Research Methodology

              Technavio presents a detailed picture of the market by way of study, synthesis, and summation of data from multiple sources. The analysts have presented the various facets of the market with a particular focus on identifying the key industry influencers. The data thus presented is comprehensive, reliable, and the result of extensive research, both primary and secondary.

              INFORMATION SOURCES

              Primary sources

              • Manufacturers and suppliers
              • Channel partners
              • Industry experts
              • Strategic decision makers

              Secondary sources

              • Industry journals and periodicals
              • Government data
              • Financial reports of key industry players
              • Historical data
              • Press releases

              DATA ANALYSIS

              Data Synthesis

              • Collation of data
              • Estimation of key figures
              • Analysis of derived insights

              Data Validation

              • Triangulation with data models
              • Reference against proprietary databases
              • Corroboration with industry experts

              REPORT WRITING

              Qualitative

              • Market drivers
              • Market challenges
              • Market trends
              • Five forces analysis

              Quantitative

              • Market size and forecast
              • Market segmentation
              • Geographical insights
              • Competitive landscape

              Interested in this report?

              Get your sample now to see our research methodology and insights!

              Download Now

              Frequently Asked Questions

              Home Blood Pressure Monitoring Devices market growth will increase by $ 787.03 mn during 2024-2028.

              The Home Blood Pressure Monitoring Devices market is expected to grow at a CAGR of 6.76% during 2024-2028.

              Home Blood Pressure Monitoring Devices market is segmented by Distribution Channel( Offline, Online) Type( Upper arm, Wrist, Finger, Rest of World (ROW))

              A and D HOLON Holdings Co. Ltd., American Diagnostic Corp., Baxter International Inc., Beurer GmbH, Contec Medical Systems Co. Ltd., ForaCare Inc., HEINE Optotechnik GmbH and Co. KG, Koninklijke Philips N.V., Microlife Corp., Morepen Laboratories Ltd., Nokia Corp., OMRON Corp., Qardio Inc., Rossmax International Ltd., Spengler Holtex Group, Telli Health LLC, Tianjin Jiuan Medical Electronics Co. Ltd., Wellue Health, Zewa Inc., Halma Plc are a few of the key vendors in the Home Blood Pressure Monitoring Devices market.

              Asia will register the highest growth rate of 41% among the other regions. Therefore, the Home Blood Pressure Monitoring Devices market in Asia is expected to garner significant business opportunities for the vendors during the forecast period.

              US, Germany, China, Japan, India

              • Growing demand for home-based digital blood pressure monitoring devicesHypertension and increasing cardiovascular diseases are global health concerns. Medical guidelines define hypertension as blood pressure higher than 130 over 80 mmHg. To monitor is the driving factor this market.
              • record is the driving factor this market.
              • and treat high blood pressure patients is the driving factor this market.
              • physicians recommend the usage of home blood pressure monitoring devices. Also is the driving factor this market.
              • advances in wearable technology and in-sync with smart devices will surge the demand for home-based digital blood pressure monitoring devices. OMRON BP786 is one of the established brands of home blood pressure monitoring devices. The device can sync with Android applications and is mobile-friendly. Likewise is the driving factor this market.
              • the Microlife WatchBP device records blood pressure and automatically detects pulse irregularity is the driving factor this market.
              • which may be caused by symptomatic or asymptomatic atrial fibrillation. The device meets standards and guidelines from the ESH is the driving factor this market.
              • the American Heart Association (AHA) is the driving factor this market.
              • and the BHS. The device can be used either in diagnostic mode (four measurements is the driving factor this market.
              • two between 6 am and 9 am and two between 6 pm and 9 pm) or usual mode (single measurement at any time). The device displays the mean value of overall blood pressure values by which the physician can analyze and treat hypertension.  The aged people are at high risk of hypertension is the driving factor this market.
              • and their blood pressure must be monitored daily. Daily visits to a physician's clinic or healthcare centers might not be feasible in this case. Therefore is the driving factor this market.
              • home-based blood pressure monitoring is advised in such cases by physicians. Vendors are offering home-based blood pressure monitoring devices is the driving factor this market.
              • which are convenient is the driving factor this market.
              • user-friendly is the driving factor this market.
              • wireless is the driving factor this market.
              • and cost-effective. These factors are expected to result in an increased demand for home-based monitoring during the forecast period. Such devices also help reduce hospital costs is the driving factor this market.
              • thereby positively increasing the demand for and sales of digital home blood pressure monitoring devices. Also is the driving factor this market.
              • the growing preference for home-based healthcare monitoring and the adoption of portable multiparameter monitoring devices is the driving factor this market.
              • especially in developed countries is the driving factor this market.
              • is likely to spur the growth of the market in focus during the forecast period. is the driving factor this market.

              The Home Blood Pressure Monitoring Devices market vendors should focus on grabbing business opportunities from the Offline segment as it accounted for the largest market share in the base year.