Horeca Market Analysis, Size, and Forecast 2026-2030: APAC (China, India, and Japan), North America (US, Canada, and Mexico), Europe (Germany, France, and UK), South America (Brazil and Argentina), Middle East and Africa (Saudi Arabia, UAE, and South Africa), and Rest of World (ROW)

Horeca Market Analysis, Size, and Forecast 2026-2030:
APAC (China, India, and Japan), North America (US, Canada, and Mexico), Europe (Germany, France, and UK), South America (Brazil and Argentina), Middle East and Africa (Saudi Arabia, UAE, and South Africa), and Rest of World (ROW)

Published: Apr 2026 288 Pages SKU: IRTNTR75968

Market Overview at a Glance

$343.1 B
Market Opportunity
3.1%
CAGR 2025 - 2030
41.5%
APAC Growth
$1375.5 B
Single outlet segment 2024

Horeca Market Size 2026-2030

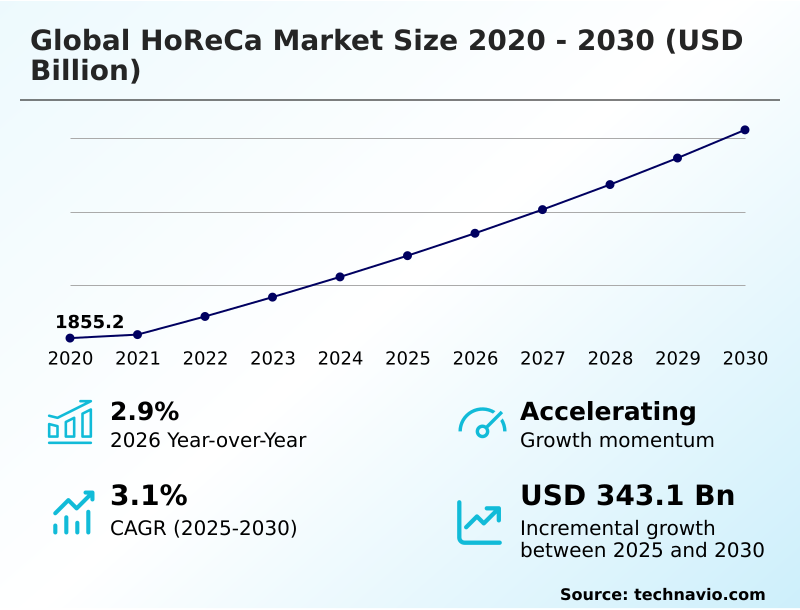
The horeca market size is valued to increase by USD 343.1 billion, at a CAGR of 3.1% from 2025 to 2030. Expansion of experiential dining and premiumization trends will drive the horeca market.

Major Market Trends & Insights

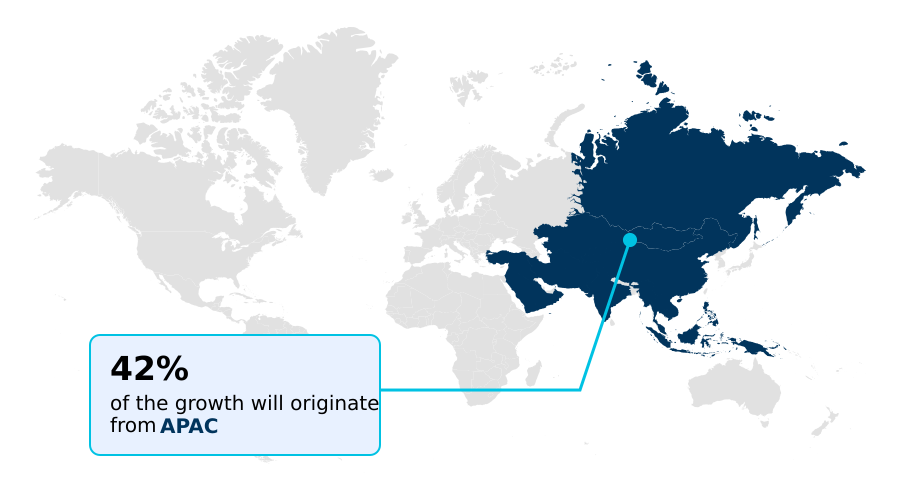
  • APAC dominated the market and accounted for a 41.5% growth during the forecast period.
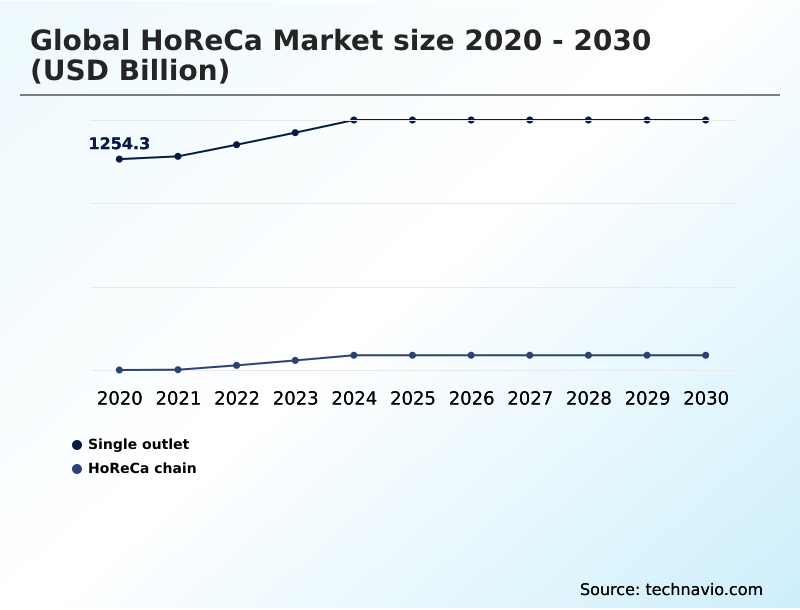
  • By Type - Single outlet segment was valued at USD 1375.5 billion in 2024
  • By Service Type - Eateries and restaurants segment accounted for the largest market revenue share in 2024

Market Size & Forecast

  • Market Opportunities: USD 567.9 billion
  • Market Future Opportunities: USD 343.1 billion
  • CAGR from 2025 to 2030 : 3.1%

Market Summary

  • The HoReCa market is undergoing a profound structural transformation, driven by digital industrialization and a strategic focus on wellness hospitality and lifestyle ecosystems. This evolution moves beyond traditional service models to create integrated guest journeys. Key drivers include the demand for experiential dining and premiumization trends, compelling operators to innovate.
  • A significant trend is the move toward hyper-personalized guest experiences, enabled by data analytics and predictive modeling. For instance, a hotel chain can optimize its supply chain for ethical sourcing and sustainability mandates by using AI-driven kitchen optimization to analyze consumption patterns across properties, reducing food waste by over 20% while ensuring the availability of fresh, artisanal ingredients.
  • However, the industry grapples with persistent challenges like severe labor shortages and rising personnel costs, which are accelerating the adoption of autonomous service solutions and mobile-first digital concierges. Successfully navigating these dynamics requires balancing high-tech efficiency with high-touch human service to maintain a competitive edge and ensure long-term commercial resilience in a rapidly changing landscape.

What will be the Size of the Horeca Market during the forecast period?

Get Key Insights on Market Forecast (PDF) Request Free Sample

How is the Horeca Market Segmented?

The horeca industry research report provides comprehensive data (region-wise segment analysis), with forecasts and estimates in "USD billion" for the period 2026-2030, as well as historical data from 2020-2024 for the following segments.

  • Type
    • Single outlet
    • HoReCa chain
  • Service type
    • Eateries and restaurants
    • Hotels
    • Cafes and pubs
  • Price range
    • Midscale
    • Luxury
    • Economy
  • Geography
    • APAC
      • China
      • India
      • Japan
    • North America
      • US
      • Canada
      • Mexico
    • Europe
      • Germany
      • France
      • UK
    • South America
      • Brazil
      • Argentina
    • Middle East and Africa
      • Saudi Arabia
      • UAE
      • South Africa
    • Rest of World (ROW)

By Type Insights

The single outlet segment is estimated to witness significant growth during the forecast period.

The single outlet segment thrives by delivering unique brand identities deeply integrated within local communities. Success hinges on creating immersive atmospheres and providing authentic experiential dining, which cultivates high levels of customer loyalty and brand trust establishment.

Operators leverage sustainable sourcing and artisanal ingredients to meet premiumization trends. To compete with larger chains, independents are adopting advanced property management systems and optimizing their digital footprint within the omni-search ecosystem.

The rise of ghost kitchens has also provided a low-capital entry point for culinary innovation.

Capturing first-party data has become critical, with successful outlets showing a 15% increase in repeat business through targeted engagement, bridging the marketing gap without large corporate budgets and enhancing their premium positioning.

Request Free Sample

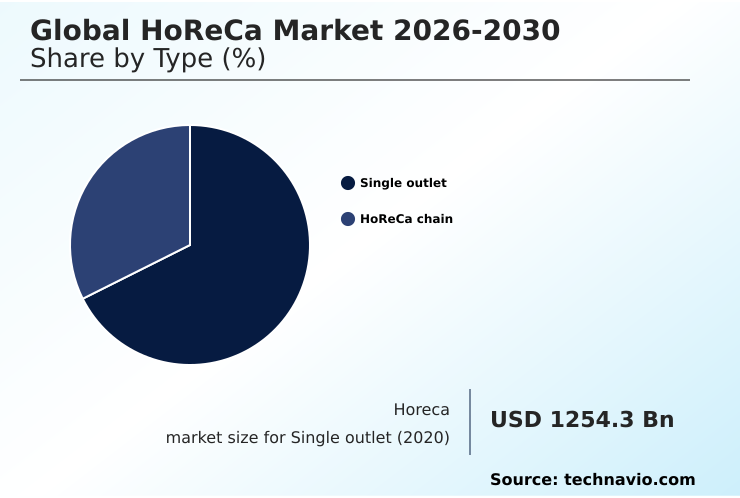
The Single outlet segment was valued at USD 1375.5 billion in 2024 and showed a gradual increase during the forecast period.

Request Free Sample

Regional Analysis

APAC is estimated to contribute 41.5% to the growth of the global market during the forecast period.Technavio’s analysts have elaborately explained the regional trends and drivers that shape the market during the forecast period.

See How Horeca Market Demand is Rising in APAC Request Free Sample

The geographic landscape of the market reveals distinct regional dynamics and opportunities. APAC is the fastest-growing region, contributing 41.5% of the market's incremental growth, driven by rapid urbanization and an expanding middle class.

In contrast, North America accounts for 23.08% of the growth, characterized by mature markets focused on technological adoption. Operators are deploying hybrid service models that blend digital efficiency with high-touch human service.

This includes the use of modular service design to offer customized guest experiences. As digital industrialization accelerates, companies are building integrated lifestyle ecosystems and wellness hospitality offerings.

Navigating this landscape requires careful attention to regional-specific factors, including regulatory compliance, liquor licensing requirements, and zoning laws, particularly for businesses involved in institutional catering.

Market Dynamics

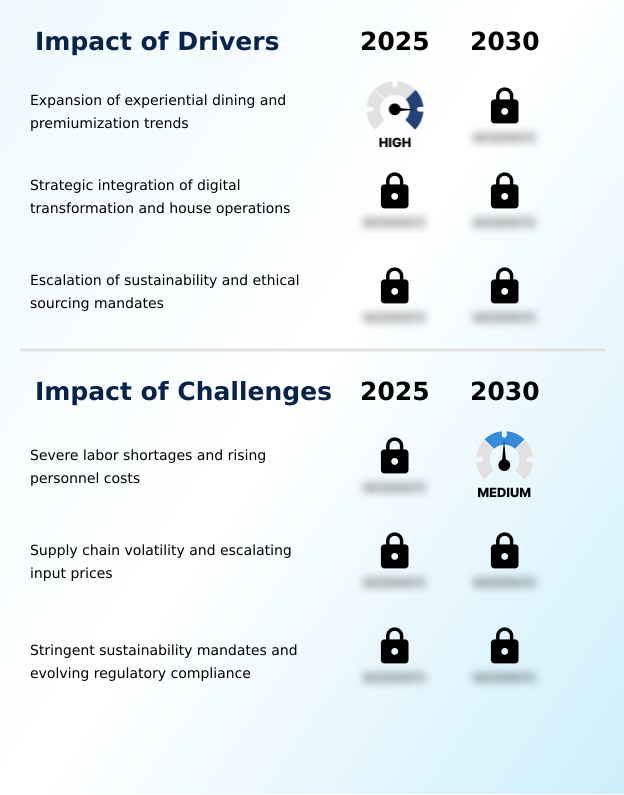
Our researchers analyzed the data with 2025 as the base year, along with the key drivers, trends, and challenges. A holistic analysis of drivers will help companies refine their marketing strategies to gain a competitive advantage.

  • The global HoReCa market is navigating a complex environment defined by several interconnected factors. The impact of experiential dining on revenue is significant, pushing establishments to innovate beyond traditional service. This is closely linked to premiumization trends in food and beverage, where quality and uniqueness command higher price points.
  • To deliver on these promises, managing supply chain volatility in restaurants has become a critical competency. Simultaneously, sustainability mandates in the HoReCa supply chain and a focus on ethical sourcing in the hospitality industry are no longer optional but core to brand identity.
  • For instance, organizations that effectively manage their supply chains to ensure ethical sourcing report customer loyalty rates that are, on average, 10% higher than competitors who do not prioritize transparency. This highlights a strategic pivot where operational decisions directly influence market perception and consumer choice, shaping the competitive landscape.

What are the key market drivers leading to the rise in the adoption of Horeca Industry?

  • The expansion of experiential dining and ongoing premiumization trends are key drivers fueling innovation and growth within the market.

  • Market growth is significantly driven by a broad digital transformation that enhances both guest-facing services and backend house operations. Innovations such as biometric check-in and advanced digital engagement platforms are becoming key differentiators.
  • The use of generative artificial intelligence to create unique culinary concepts is fostering a new wave of gastronomic tourism.
  • Behind the scenes, operators are implementing circular operations to meet sustainability goals and improve efficiency, with some achieving a 12% reduction in resource consumption.
  • Compliance with food safety regulations is being streamlined through voice-driven artificial intelligence systems that monitor and log kitchen activities, improving accuracy and reducing manual data entry. These drivers collectively push the industry toward more resilient and technologically advanced operating models.

What are the market trends shaping the Horeca Industry?

  • The proliferation of hyper-personalized guest experiences is a defining market trend. This shift is reshaping service delivery and brand loyalty across the hospitality sector.

  • Key market trends are centered on leveraging technology to create seamless and individualized guest journeys. The push for hyper-personalized guest experiences is driving the adoption of advanced data analytics and predictive modeling, enabling an anticipatory service model. Implementations of these technologies have improved customer retention by up to 18%.
  • The use of smart-room technologies is becoming standard in new hotel builds, offering enhanced control and convenience. To address operational pressures, businesses are turning to autonomous service solutions and digital service kiosks, which can reduce guest wait times by 30%.
  • These trends create new revenue opportunities through enhanced experiential offerings but also demand strict adherence to data privacy compliance, especially as alternatives like short-term residential rentals continue to compete for market share.

What challenges does the Horeca Industry face during its growth?

  • Severe labor shortages and rising personnel costs present a key challenge, impacting operational stability and profitability across the industry.

  • The industry faces significant structural challenges that constrain growth and compress margins. Persistent labor shortages and rising personnel costs are primary concerns, with high staff turnover rates exacerbating the issue. In response, operators are adopting AI-driven kitchen optimization and mobile-first digital concierges to automate tasks, with some reducing labor requirements for specific functions by up to 20%.
  • Concurrently, supply chain volatility and escalating input prices create budget uncertainty, forcing a greater emphasis on efficient procurement and ethical sourcing. Fulfilling stringent sustainability mandates adds another layer of complexity. These challenges are driving investment in AI-powered guest customization to maintain service quality with fewer resources, though such investments can pose a financial barrier for smaller operators.

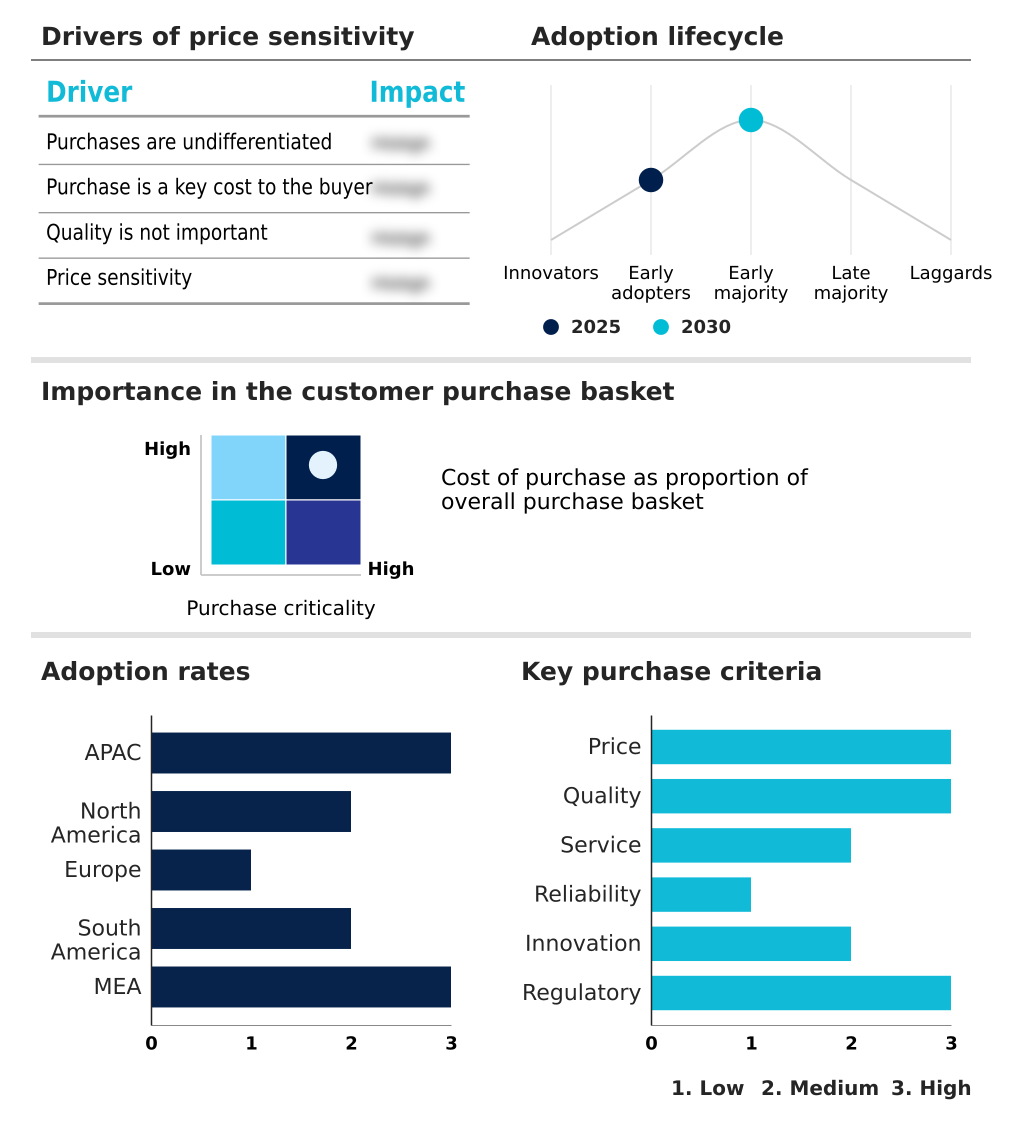
Exclusive Technavio Analysis on Customer Landscape

The horeca market forecasting report includes the adoption lifecycle of the market, covering from the innovator’s stage to the laggard’s stage. It focuses on adoption rates in different regions based on penetration. Furthermore, the horeca market report also includes key purchase criteria and drivers of price sensitivity to help companies evaluate and develop their market growth analysis strategies.

Customer Landscape of Horeca Industry

Competitive Landscape

Companies are implementing various strategies, such as strategic alliances, horeca market forecast, partnerships, mergers and acquisitions, geographical expansion, and product/service launches, to enhance their presence in the industry.

Aramark - Delivers integrated hospitality solutions, encompassing comprehensive foodservices, contract catering, facilities management, and accommodation services for diverse industries.

The industry research and growth report includes detailed analyses of the competitive landscape of the market and information about key companies, including:

  • Aramark
  • Choice Hotels International
  • Compass Group Plc
  • Darden Restaurants Inc
  • Delaware North Companies Inc.
  • Dominos Pizza Inc.
  • Elior Group SA
  • Hilton Worldwide Holdings Inc.
  • Hyatt Hotels Corp.
  • InterContinental Hotels Group
  • Jin Jiang International Hotels
  • Marriott International Inc.
  • McDonald Corp.
  • Radisson Hotel Group
  • Restaurant Brands Inc.
  • Sodexo SA
  • Starbucks Corp.
  • Whitbread PLC
  • Wyndham Hotels and Resorts
  • YUM Brands Inc.

Qualitative and quantitative analysis of companies has been conducted to help clients understand the wider business environment as well as the strengths and weaknesses of key industry players. Data is qualitatively analyzed to categorize companies as pure play, category-focused, industry-focused, and diversified; it is quantitatively analyzed to categorize companies as dominant, leading, strong, tentative, and weak.

Recent Development and News in Horeca market

  • In March, 2025, Marriott International announced a strategic expansion of its luxury collection in Europe, focusing on integrating Michelin-starred culinary concepts into its boutique properties.
  • In January, 2025, Starbucks Corp. introduced its Green Dot Assist, an AI companion designed to provide real-time conversational support to partners on recipes and service standards.
  • In February, 2025, McDonald Corp. initiated a global technology overhaul, deploying internet-connected kitchen equipment and voice-driven AI to enhance drive-thru efficiency and accuracy.
  • In April, 2025, Sodexo SA completed its acquisition of Grupo Mediterranea, significantly strengthening its market presence in Spain’s healthcare and education catering sectors.

Dive into Technavio’s robust research methodology, blending expert interviews, extensive data synthesis, and validated models for unparalleled Horeca Market insights. See full methodology.

Market Scope
Page number 288
Base year 2025
Historic period 2020-2024
Forecast period 2026-2030
Growth momentum & CAGR Accelerate at a CAGR of 3.1%
Market growth 2026-2030 USD 343.1 billion
Market structure Fragmented
YoY growth 2025-2026(%) 2.9%
Key countries China, India, Japan, South Korea, Indonesia, Australia, US, Canada, Mexico, Germany, France, UK, Italy, Spain, The Netherlands, Brazil, Argentina, Chile, Saudi Arabia, UAE, South Africa, Turkey and Israel
Competitive landscape Leading Companies, Market Positioning of Companies, Competitive Strategies, and Industry Risks

Request Free Sample

Research Analyst Overview

  • The HoReCa market's evolution is centered on technological integration and operational intelligence. The shift toward experiential dining and pronounced premiumization trends necessitates a complete digital transformation of house operations. This is most evident in the push for hyper-personalized guest experiences, where data analytics and predictive modeling are foundational.
  • Leading operators utilize property management systems that integrate with a broader digital engagement platform, enabling capabilities like biometric check-in and AI-powered guest customization. These systems capture valuable first-party data through an omni-search ecosystem.
  • To combat labor challenges, the industry is accelerating the adoption of autonomous service solutions, from mobile-first digital concierges to AI-driven kitchen optimization, which has been shown to reduce order errors by over 25%.
  • This digital industrialization is creating new lifestyle ecosystems, including a focus on wellness hospitality, and forcing a move toward hybrid service models and modular service design to meet diverse consumer demands.

What are the Key Data Covered in this Horeca Market Research and Growth Report?

  • What is the expected growth of the Horeca Market between 2026 and 2030?

    • USD 343.1 billion, at a CAGR of 3.1%

  • What segmentation does the market report cover?

    • The report is segmented by Type (Single outlet, and HoReCa chain), Service Type (Eateries and restaurants, Hotels, and Cafes and pubs), Price Range (Midscale, Luxury, and Economy) and Geography (APAC, North America, Europe, South America, Middle East and Africa)

  • Which regions are analyzed in the report?

    • APAC, North America, Europe, South America and Middle East and Africa

  • What are the key growth drivers and market challenges?

    • Expansion of experiential dining and premiumization trends, Severe labor shortages and rising personnel costs

  • Who are the major players in the Horeca Market?

    • Aramark, Choice Hotels International, Compass Group Plc, Darden Restaurants Inc, Delaware North Companies Inc., Dominos Pizza Inc., Elior Group SA, Hilton Worldwide Holdings Inc., Hyatt Hotels Corp., InterContinental Hotels Group, Jin Jiang International Hotels, Marriott International Inc., McDonald Corp., Radisson Hotel Group, Restaurant Brands Inc., Sodexo SA, Starbucks Corp., Whitbread PLC, Wyndham Hotels and Resorts and YUM Brands Inc.

Market Research Insights

  • The market's momentum is increasingly tied to the adoption of sophisticated operational strategies. For example, implementing an anticipatory service model has been shown to improve guest satisfaction scores by up to 25%. Adherence to stringent data privacy compliance is non-negotiable, as brand trust establishment is paramount.
  • The strategic use of digital service kiosks helps mitigate the impact of chronic labor shortages, with some operators reporting a 15% reduction in front-of-house personnel costs. Furthermore, the diversification into experiential offerings beyond core services is crucial for differentiation. Businesses that successfully integrate these elements can achieve superior performance, turning operational challenges into competitive advantages.

We can help! Our analysts can customize this horeca market research report to meet your requirements.

Get in touch

1. Executive Summary

1.1 Market overview

Executive Summary - Chart on Market Overview
Executive Summary - Data Table on Market Overview
Executive Summary - Chart on Global Market Characteristics
Executive Summary - Chart on Market by Geography
Executive Summary - Chart on Market Segmentation by Type
Executive Summary - Chart on Market Segmentation by Service Type
Executive Summary - Chart on Market Segmentation by Price Range
Executive Summary - Chart on Incremental Growth
Executive Summary - Data Table on Incremental Growth
Executive Summary - Chart on Company Market Positioning

2. Technavio Analysis

2.1 Analysis of price sensitivity, lifecycle, customer purchase basket, adoption rates, and purchase criteria

2.2 Criticality of inputs and Factors of differentiation

Chart on Overview on criticality of inputs and factors of differentiation

2.3 Factors of disruption

Chart on Overview on factors of disruption

2.4 Impact of drivers and challenges

Chart on Impact of drivers and challenges in 2025 and 2030

3. Market Landscape

3.1 Market ecosystem

Chart on Parent Market
Data Table on - Parent Market

3.2 Market characteristics

Chart on Market characteristics analysis

3.3 Value chain analysis

Chart on Value chain analysis

4. Market Sizing

4.1 Market definition

Data Table on Offerings of companies included in the market definition

4.2 Market segment analysis

Market segments

4.3 Market size 2025

4.4 Market outlook: Forecast for 2025-2030

Chart on Global - Market size and forecast 2025-2030 ($ billion)
Data Table on Global - Market size and forecast 2025-2030 ($ billion)
Chart on Global Market: Year-over-year growth 2025-2030 (%)
Data Table on Global Market: Year-over-year growth 2025-2030 (%)

5. Historic Market Size

5.1 Global HoReCa Market 2020 - 2024

Historic Market Size - Data Table on Global HoReCa Market 2020 - 2024 ($ billion)

5.2 Type segment analysis 2020 - 2024

Historic Market Size - Type Segment 2020 - 2024 ($ billion)

5.3 Service Type segment analysis 2020 - 2024

Historic Market Size - Service Type Segment 2020 - 2024 ($ billion)

5.4 Price Range segment analysis 2020 - 2024

Historic Market Size - Price Range Segment 2020 - 2024 ($ billion)

5.5 Geography segment analysis 2020 - 2024

Historic Market Size - Geography Segment 2020 - 2024 ($ billion)

5.6 Country segment analysis 2020 - 2024

Historic Market Size - Country Segment 2020 - 2024 ($ billion)

6. Qualitative Analysis

6.1 Impact of AI on global HoReCa market

6.2 Impact of geopolitical conflict on global HoReCa market

7. Five Forces Analysis

7.1 Five forces summary

Five forces analysis - Comparison between 2025 and 2030

7.2 Bargaining power of buyers

Bargaining power of buyers - Impact of key factors 2025 and 2030

7.3 Bargaining power of suppliers

Bargaining power of suppliers - Impact of key factors in 2025 and 2030

7.4 Threat of new entrants

Threat of new entrants - Impact of key factors in 2025 and 2030

7.5 Threat of substitutes

Threat of substitutes - Impact of key factors in 2025 and 2030

7.6 Threat of rivalry

Threat of rivalry - Impact of key factors in 2025 and 2030

7.7 Market condition

Chart on Market condition - Five forces 2025 and 2030

8. Market Segmentation by Type

8.1 Market segments

Chart on Type - Market share 2025-2030 (%)
Data Table on Type - Market share 2025-2030 (%)

8.2 Comparison by Type

Chart on Comparison by Type
Data Table on Comparison by Type

8.3 Single outlet - Market size and forecast 2025-2030

Chart on Single outlet - Market size and forecast 2025-2030 ($ billion)
Data Table on Single outlet - Market size and forecast 2025-2030 ($ billion)
Chart on Single outlet - Year-over-year growth 2025-2030 (%)
Data Table on Single outlet - Year-over-year growth 2025-2030 (%)

8.4 HoReCa chain - Market size and forecast 2025-2030

Chart on HoReCa chain - Market size and forecast 2025-2030 ($ billion)
Data Table on HoReCa chain - Market size and forecast 2025-2030 ($ billion)
Chart on HoReCa chain - Year-over-year growth 2025-2030 (%)
Data Table on HoReCa chain - Year-over-year growth 2025-2030 (%)

8.5 Market opportunity by Type

Market opportunity by Type ($ billion)
Data Table on Market opportunity by Type ($ billion)

9. Market Segmentation by Service Type

9.1 Market segments

Chart on Service Type - Market share 2025-2030 (%)
Data Table on Service Type - Market share 2025-2030 (%)

9.2 Comparison by Service Type

Chart on Comparison by Service Type
Data Table on Comparison by Service Type

9.3 Eateries and restaurants - Market size and forecast 2025-2030

Chart on Eateries and restaurants - Market size and forecast 2025-2030 ($ billion)
Data Table on Eateries and restaurants - Market size and forecast 2025-2030 ($ billion)
Chart on Eateries and restaurants - Year-over-year growth 2025-2030 (%)
Data Table on Eateries and restaurants - Year-over-year growth 2025-2030 (%)

9.4 Hotels - Market size and forecast 2025-2030

Chart on Hotels - Market size and forecast 2025-2030 ($ billion)
Data Table on Hotels - Market size and forecast 2025-2030 ($ billion)
Chart on Hotels - Year-over-year growth 2025-2030 (%)
Data Table on Hotels - Year-over-year growth 2025-2030 (%)

9.5 Cafes and pubs - Market size and forecast 2025-2030

Chart on Cafes and pubs - Market size and forecast 2025-2030 ($ billion)
Data Table on Cafes and pubs - Market size and forecast 2025-2030 ($ billion)
Chart on Cafes and pubs - Year-over-year growth 2025-2030 (%)
Data Table on Cafes and pubs - Year-over-year growth 2025-2030 (%)

9.6 Market opportunity by Service Type

Market opportunity by Service Type ($ billion)
Data Table on Market opportunity by Service Type ($ billion)

10. Market Segmentation by Price Range

10.1 Market segments

Chart on Price Range - Market share 2025-2030 (%)
Data Table on Price Range - Market share 2025-2030 (%)

10.2 Comparison by Price Range

Chart on Comparison by Price Range
Data Table on Comparison by Price Range

10.3 Midscale - Market size and forecast 2025-2030

Chart on Midscale - Market size and forecast 2025-2030 ($ billion)
Data Table on Midscale - Market size and forecast 2025-2030 ($ billion)
Chart on Midscale - Year-over-year growth 2025-2030 (%)
Data Table on Midscale - Year-over-year growth 2025-2030 (%)

10.4 Luxury - Market size and forecast 2025-2030

Chart on Luxury - Market size and forecast 2025-2030 ($ billion)
Data Table on Luxury - Market size and forecast 2025-2030 ($ billion)
Chart on Luxury - Year-over-year growth 2025-2030 (%)
Data Table on Luxury - Year-over-year growth 2025-2030 (%)

10.5 Economy - Market size and forecast 2025-2030

Chart on Economy - Market size and forecast 2025-2030 ($ billion)
Data Table on Economy - Market size and forecast 2025-2030 ($ billion)
Chart on Economy - Year-over-year growth 2025-2030 (%)
Data Table on Economy - Year-over-year growth 2025-2030 (%)

10.6 Market opportunity by Price Range

Market opportunity by Price Range ($ billion)
Data Table on Market opportunity by Price Range ($ billion)

11. Customer Landscape

11.1 Customer landscape overview

Analysis of price sensitivity, lifecycle, customer purchase basket, adoption rates, and purchase criteria

12. Geographic Landscape

12.1 Geographic segmentation

Chart on Market share by geography 2025-2030 (%)
Data Table on Market share by geography 2025-2030 (%)

12.2 Geographic comparison

Chart on Geographic comparison
Data Table on Geographic comparison

12.3 APAC - Market size and forecast 2025-2030

Chart on APAC - Market size and forecast 2025-2030 ($ billion)
Data Table on APAC - Market size and forecast 2025-2030 ($ billion)
Chart on APAC - Year-over-year growth 2025-2030 (%)
Data Table on APAC - Year-over-year growth 2025-2030 (%)
Chart on Regional Comparison - APAC
Data Table on Regional Comparison - APAC

12.3.1 China - Market size and forecast 2025-2030

Chart on China - Market size and forecast 2025-2030 ($ billion)
Data Table on China - Market size and forecast 2025-2030 ($ billion)
Chart on China - Year-over-year growth 2025-2030 (%)
Data Table on China - Year-over-year growth 2025-2030 (%)

12.3.2 India - Market size and forecast 2025-2030

Chart on India - Market size and forecast 2025-2030 ($ billion)
Data Table on India - Market size and forecast 2025-2030 ($ billion)
Chart on India - Year-over-year growth 2025-2030 (%)
Data Table on India - Year-over-year growth 2025-2030 (%)

12.3.3 Japan - Market size and forecast 2025-2030

Chart on Japan - Market size and forecast 2025-2030 ($ billion)
Data Table on Japan - Market size and forecast 2025-2030 ($ billion)
Chart on Japan - Year-over-year growth 2025-2030 (%)
Data Table on Japan - Year-over-year growth 2025-2030 (%)

12.3.4 South Korea - Market size and forecast 2025-2030

Chart on South Korea - Market size and forecast 2025-2030 ($ billion)
Data Table on South Korea - Market size and forecast 2025-2030 ($ billion)
Chart on South Korea - Year-over-year growth 2025-2030 (%)
Data Table on South Korea - Year-over-year growth 2025-2030 (%)

12.3.5 Indonesia - Market size and forecast 2025-2030

Chart on Indonesia - Market size and forecast 2025-2030 ($ billion)
Data Table on Indonesia - Market size and forecast 2025-2030 ($ billion)
Chart on Indonesia - Year-over-year growth 2025-2030 (%)
Data Table on Indonesia - Year-over-year growth 2025-2030 (%)

12.3.6 Australia - Market size and forecast 2025-2030

Chart on Australia - Market size and forecast 2025-2030 ($ billion)
Data Table on Australia - Market size and forecast 2025-2030 ($ billion)
Chart on Australia - Year-over-year growth 2025-2030 (%)
Data Table on Australia - Year-over-year growth 2025-2030 (%)

12.4 North America - Market size and forecast 2025-2030

Chart on North America - Market size and forecast 2025-2030 ($ billion)
Data Table on North America - Market size and forecast 2025-2030 ($ billion)
Chart on North America - Year-over-year growth 2025-2030 (%)
Data Table on North America - Year-over-year growth 2025-2030 (%)
Chart on Regional Comparison - North America
Data Table on Regional Comparison - North America

12.4.1 US - Market size and forecast 2025-2030

Chart on US - Market size and forecast 2025-2030 ($ billion)
Data Table on US - Market size and forecast 2025-2030 ($ billion)
Chart on US - Year-over-year growth 2025-2030 (%)
Data Table on US - Year-over-year growth 2025-2030 (%)

12.4.2 Canada - Market size and forecast 2025-2030

Chart on Canada - Market size and forecast 2025-2030 ($ billion)
Data Table on Canada - Market size and forecast 2025-2030 ($ billion)
Chart on Canada - Year-over-year growth 2025-2030 (%)
Data Table on Canada - Year-over-year growth 2025-2030 (%)

12.4.3 Mexico - Market size and forecast 2025-2030

Chart on Mexico - Market size and forecast 2025-2030 ($ billion)
Data Table on Mexico - Market size and forecast 2025-2030 ($ billion)
Chart on Mexico - Year-over-year growth 2025-2030 (%)
Data Table on Mexico - Year-over-year growth 2025-2030 (%)

12.5 Europe - Market size and forecast 2025-2030

Chart on Europe - Market size and forecast 2025-2030 ($ billion)
Data Table on Europe - Market size and forecast 2025-2030 ($ billion)
Chart on Europe - Year-over-year growth 2025-2030 (%)
Data Table on Europe - Year-over-year growth 2025-2030 (%)
Chart on Regional Comparison - Europe
Data Table on Regional Comparison - Europe

12.5.1 Germany - Market size and forecast 2025-2030

Chart on Germany - Market size and forecast 2025-2030 ($ billion)
Data Table on Germany - Market size and forecast 2025-2030 ($ billion)
Chart on Germany - Year-over-year growth 2025-2030 (%)
Data Table on Germany - Year-over-year growth 2025-2030 (%)

12.5.2 France - Market size and forecast 2025-2030

Chart on France - Market size and forecast 2025-2030 ($ billion)
Data Table on France - Market size and forecast 2025-2030 ($ billion)
Chart on France - Year-over-year growth 2025-2030 (%)
Data Table on France - Year-over-year growth 2025-2030 (%)

12.5.3 UK - Market size and forecast 2025-2030

Chart on UK - Market size and forecast 2025-2030 ($ billion)
Data Table on UK - Market size and forecast 2025-2030 ($ billion)
Chart on UK - Year-over-year growth 2025-2030 (%)
Data Table on UK - Year-over-year growth 2025-2030 (%)

12.5.4 Italy - Market size and forecast 2025-2030

Chart on Italy - Market size and forecast 2025-2030 ($ billion)
Data Table on Italy - Market size and forecast 2025-2030 ($ billion)
Chart on Italy - Year-over-year growth 2025-2030 (%)
Data Table on Italy - Year-over-year growth 2025-2030 (%)

12.5.5 Spain - Market size and forecast 2025-2030

Chart on Spain - Market size and forecast 2025-2030 ($ billion)
Data Table on Spain - Market size and forecast 2025-2030 ($ billion)
Chart on Spain - Year-over-year growth 2025-2030 (%)
Data Table on Spain - Year-over-year growth 2025-2030 (%)

12.5.6 The Netherlands - Market size and forecast 2025-2030

Chart on The Netherlands - Market size and forecast 2025-2030 ($ billion)
Data Table on The Netherlands - Market size and forecast 2025-2030 ($ billion)
Chart on The Netherlands - Year-over-year growth 2025-2030 (%)
Data Table on The Netherlands - Year-over-year growth 2025-2030 (%)

12.6 South America - Market size and forecast 2025-2030

Chart on South America - Market size and forecast 2025-2030 ($ billion)
Data Table on South America - Market size and forecast 2025-2030 ($ billion)
Chart on South America - Year-over-year growth 2025-2030 (%)
Data Table on South America - Year-over-year growth 2025-2030 (%)
Chart on Regional Comparison - South America
Data Table on Regional Comparison - South America

12.6.1 Brazil - Market size and forecast 2025-2030

Chart on Brazil - Market size and forecast 2025-2030 ($ billion)
Data Table on Brazil - Market size and forecast 2025-2030 ($ billion)
Chart on Brazil - Year-over-year growth 2025-2030 (%)
Data Table on Brazil - Year-over-year growth 2025-2030 (%)

12.6.2 Argentina - Market size and forecast 2025-2030

Chart on Argentina - Market size and forecast 2025-2030 ($ billion)
Data Table on Argentina - Market size and forecast 2025-2030 ($ billion)
Chart on Argentina - Year-over-year growth 2025-2030 (%)
Data Table on Argentina - Year-over-year growth 2025-2030 (%)

12.6.3 Chile - Market size and forecast 2025-2030

Chart on Chile - Market size and forecast 2025-2030 ($ billion)
Data Table on Chile - Market size and forecast 2025-2030 ($ billion)
Chart on Chile - Year-over-year growth 2025-2030 (%)
Data Table on Chile - Year-over-year growth 2025-2030 (%)

12.7 Middle East and Africa - Market size and forecast 2025-2030

Chart on Middle East and Africa - Market size and forecast 2025-2030 ($ billion)
Data Table on Middle East and Africa - Market size and forecast 2025-2030 ($ billion)
Chart on Middle East and Africa - Year-over-year growth 2025-2030 (%)
Data Table on Middle East and Africa - Year-over-year growth 2025-2030 (%)
Chart on Regional Comparison - Middle East and Africa
Data Table on Regional Comparison - Middle East and Africa

12.7.1 Saudi Arabia - Market size and forecast 2025-2030

Chart on Saudi Arabia - Market size and forecast 2025-2030 ($ billion)
Data Table on Saudi Arabia - Market size and forecast 2025-2030 ($ billion)
Chart on Saudi Arabia - Year-over-year growth 2025-2030 (%)
Data Table on Saudi Arabia - Year-over-year growth 2025-2030 (%)

12.7.2 UAE - Market size and forecast 2025-2030

Chart on UAE - Market size and forecast 2025-2030 ($ billion)
Data Table on UAE - Market size and forecast 2025-2030 ($ billion)
Chart on UAE - Year-over-year growth 2025-2030 (%)
Data Table on UAE - Year-over-year growth 2025-2030 (%)

12.7.3 South Africa - Market size and forecast 2025-2030

Chart on South Africa - Market size and forecast 2025-2030 ($ billion)
Data Table on South Africa - Market size and forecast 2025-2030 ($ billion)
Chart on South Africa - Year-over-year growth 2025-2030 (%)
Data Table on South Africa - Year-over-year growth 2025-2030 (%)

12.7.4 Turkey - Market size and forecast 2025-2030

Chart on Turkey - Market size and forecast 2025-2030 ($ billion)
Data Table on Turkey - Market size and forecast 2025-2030 ($ billion)
Chart on Turkey - Year-over-year growth 2025-2030 (%)
Data Table on Turkey - Year-over-year growth 2025-2030 (%)

12.7.5 Israel - Market size and forecast 2025-2030

Chart on Israel - Market size and forecast 2025-2030 ($ billion)
Data Table on Israel - Market size and forecast 2025-2030 ($ billion)
Chart on Israel - Year-over-year growth 2025-2030 (%)
Data Table on Israel - Year-over-year growth 2025-2030 (%)

12.8 Market opportunity by geography

Market opportunity by geography ($ billion)
Data Tables on Market opportunity by geography ($ billion)

13. Drivers, Challenges, and Opportunity

13.1 Market drivers

Expansion of experiential dining and premiumization trends
Strategic integration of digital transformation and house operations
Escalation of sustainability and ethical sourcing mandates

13.2 Market challenges

Severe labor shortages and rising personnel costs
Supply chain volatility and escalating input prices
Stringent sustainability mandates and evolving regulatory compliance

13.3 Impact of drivers and challenges

Impact of drivers and challenges in 2025 and 2030

13.4 Market opportunities

Proliferation of hyper-personalized guest experiences
Integration of fundamental and circular operations
Advancements in autonomous and robotic service solutions

14. Competitive Landscape

14.1 Overview

14.2

Overview on criticality of inputs and factors of differentiation

14.3 Landscape disruption

Overview on factors of disruption

14.4 Industry risks

Impact of key risks on business

15. Competitive Analysis

15.1 Companies profiled

Companies covered

15.2 Company ranking index

15.3 Market positioning of companies

Matrix on companies position and classification

15.4 Aramark

Aramark - Overview
Aramark - Business segments
Aramark - Key offerings
Aramark - Segment focus
SWOT

15.5 Compass Group Plc

Compass Group Plc - Overview
Compass Group Plc - Business segments
Compass Group Plc - Key offerings
Compass Group Plc - Segment focus
SWOT

15.6 Dominos Pizza Inc.

Dominos Pizza Inc. - Overview
Dominos Pizza Inc. - Business segments
Dominos Pizza Inc. - Key offerings
Dominos Pizza Inc. - Segment focus
SWOT

15.7 Elior Group SA

Elior Group SA - Overview
Elior Group SA - Product / Service
Elior Group SA - Key offerings
SWOT

15.8 Hilton Worldwide Holdings Inc.

Hilton Worldwide Holdings Inc. - Overview
Hilton Worldwide Holdings Inc. - Business segments
Hilton Worldwide Holdings Inc. - Key offerings
Hilton Worldwide Holdings Inc. - Segment focus
SWOT

15.9 Hyatt Hotels Corp.

Hyatt Hotels Corp. - Overview
Hyatt Hotels Corp. - Business segments
Hyatt Hotels Corp. - Key offerings
Hyatt Hotels Corp. - Segment focus
SWOT

15.10 InterContinental Hotels Group

InterContinental Hotels Group - Overview
InterContinental Hotels Group - Product / Service
InterContinental Hotels Group - Key offerings
SWOT

15.11 Marriott International Inc.

Marriott International Inc. - Overview
Marriott International Inc. - Business segments
Marriott International Inc. - Key offerings
Marriott International Inc. - Segment focus
SWOT

15.12 McDonald Corp.

McDonald Corp. - Overview
McDonald Corp. - Business segments
McDonald Corp. - Key offerings
McDonald Corp. - Segment focus
SWOT

15.13 Restaurant Brands Inc.

Restaurant Brands Inc. - Overview
Restaurant Brands Inc. - Business segments
Restaurant Brands Inc. - Key offerings
Restaurant Brands Inc. - Segment focus
SWOT

15.14 Sodexo SA

Sodexo SA - Overview
Sodexo SA - Business segments
Sodexo SA - Key offerings
Sodexo SA - Segment focus
SWOT

15.15 Starbucks Corp.

Starbucks Corp. - Overview
Starbucks Corp. - Business segments
Starbucks Corp. - Key offerings
Starbucks Corp. - Segment focus
SWOT

15.16 Whitbread PLC

Whitbread PLC - Overview
Whitbread PLC - Business segments
Whitbread PLC - Key offerings
Whitbread PLC - Segment focus
SWOT

15.17 Wyndham Hotels and Resorts

Wyndham Hotels and Resorts - Overview
Wyndham Hotels and Resorts - Business segments
Wyndham Hotels and Resorts - Key offerings
Wyndham Hotels and Resorts - Segment focus
SWOT

15.18 YUM Brands Inc.

YUM Brands Inc. - Overview
YUM Brands Inc. - Business segments
YUM Brands Inc. - Key offerings
YUM Brands Inc. - Segment focus
SWOT

16. Appendix

16.1 Scope of the report

Market definition
Objectives
Notes and caveats

16.2 Inclusions and exclusions checklist

Inclusions checklist
Exclusions checklist

16.3 Currency conversion rates for US$

16.4 Research methodology

16.5 Data procurement

Information sources

16.6 Data validation

16.7 Validation techniques employed for market sizing

16.8 Data synthesis

16.9 360 degree market analysis

16.10 List of abbreviations

Research Methodology

Technavio presents a detailed picture of the market by way of study, synthesis, and summation of data from multiple sources. The analysts have presented the various facets of the market with a particular focus on identifying the key industry influencers. The data thus presented is comprehensive, reliable, and the result of extensive research, both primary and secondary.

INFORMATION SOURCES

Primary sources

  • Manufacturers and suppliers
  • Channel partners
  • Industry experts
  • Strategic decision makers

Secondary sources

  • Industry journals and periodicals
  • Government data
  • Financial reports of key industry players
  • Historical data
  • Press releases

DATA ANALYSIS

Data Synthesis

  • Collation of data
  • Estimation of key figures
  • Analysis of derived insights

Data Validation

  • Triangulation with data models
  • Reference against proprietary databases
  • Corroboration with industry experts

REPORT WRITING

Qualitative

  • Market drivers
  • Market challenges
  • Market trends
  • Five forces analysis

Quantitative

  • Market size and forecast
  • Market segmentation
  • Geographical insights
  • Competitive landscape

Interested in this report?

Get your sample now to see our research methodology and insights!

Download Now

Frequently Asked Questions

Horeca market growth will increase by USD 343.1 billion during 2026-2030.

The Horeca market is expected to grow at a CAGR of 3.1% during 2026-2030.

Horeca market is segmented by Type (Single outlet, HoReCa chain) Service type (Eateries and restaurants, Hotels, Cafes and pubs) Price range (Midscale, Luxury, Economy)

Aramark, Choice Hotels International, Compass Group Plc, Darden Restaurants Inc, Delaware North Companies Inc., Dominos Pizza Inc., Elior Group SA, Hilton Worldwide Holdings Inc., Hyatt Hotels Corp., InterContinental Hotels Group, Jin Jiang International Hotels, Marriott International Inc., McDonald Corp., Radisson Hotel Group, Restaurant Brands Inc., Sodexo SA, Starbucks Corp., Whitbread PLC, Wyndham Hotels and Resorts, YUM Brands Inc. are a few of the key vendors in the Horeca market.

APAC will register the highest growth rate of 41.5% among the other regions. Therefore, the Horeca market in APAC is expected to garner significant business opportunities for the vendors during the forecast period.

China, India, Japan, South Korea, Indonesia, Australia, US, Canada, Mexico, Germany, France, UK, Italy, Spain, The Netherlands, Brazil, Argentina, Chile, Saudi Arabia, UAE, South Africa, Turkey, Israel

  • Expansion of experiential dining and premiumization trends is the driving factor this market.

The Horeca market vendors should focus on grabbing business opportunities from the Type segment as it accounted for the largest market share in the base year.
RIA - Research AI Assistant
Ask RIA