Horse Racing Market Analysis North America, Europe, APAC, Middle East and Africa, South America - US, UK, Australia, France, Japan - Size and Forecast 2024-2028

Horse Racing Market Analysis North America, Europe, APAC, Middle East and Africa, South America - US, UK, Australia, France, Japan - Size and Forecast 2024-2028

Published: Aug 2024 210 Pages SKU: IRTNTR80109

Market Overview at a Glance

$114.5 B
Market Opportunity
14.71%
CAGR
13.7
YoY growth 2023-2024(%)

Horse Racing Market Size 2024-2028

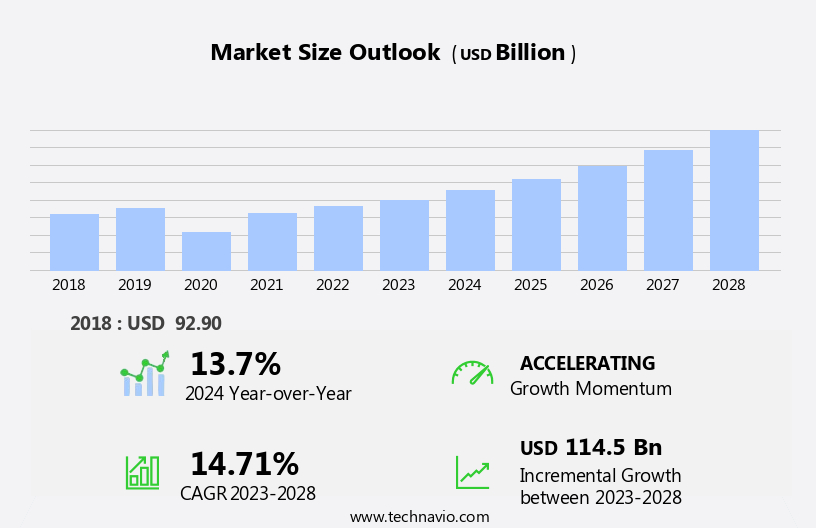
The horse racing market size is forecast to increase by USD 114.5 billion, at a CAGR of 14.71% between 2023 and 2028.

  • The market witnesses an intriguing interplay of trends and challenges. The involvement of younger generations in horse racing is a significant driver, as this demographic brings fresh energy and enthusiasm to the sport. This demographic shift is evident in the increasing popularity of horse racing events that cater to the younger audience, such as music festivals and tech-savvy initiatives. Another trend shaping the market is the growing adoption of online betting platforms. Technology has transformed the way horse racing enthusiasts engage with the sport, allowing for convenient and accessible betting experiences. This shift towards digital platforms is a response to evolving consumer preferences and the convenience they offer.
  • However, the market is not without challenges. The rising concerns for animal welfare pose a significant obstacle. The horse racing industry faces increasing scrutiny and pressure to ensure the well-being of its equine athletes. Addressing these concerns requires a collaborative effort from all stakeholders, including race organizers, trainers, and governing bodies. By implementing stricter regulations and investing in research and development, the industry can mitigate these challenges and maintain its reputation as a responsible and ethical pastime.

What will be the Size of the Horse Racing Market during the forecast period?

Horse Racing Market Size

Explore in-depth regional segment analysis with market size data - historical 2018-2022 and forecasts 2024-2028 - in the full report.  
Request Free Sample

The market continues to evolve, with various sectors experiencing ongoing dynamics that shape the industry. Veterinary care plays a crucial role in ensuring the wellbeing of equine athletes, with advancements in equine health leading to improved performance and fan engagement. Track conditions and race strategy are critical factors influencing the outcome of races, with media coverage providing real-time updates on these elements. Prize money and performance data are essential tools for horse racing media and gambling regulation, providing valuable insights for fans and stakeholders alike. Social media and online streaming platforms have revolutionized fan engagement, allowing for unprecedented access to racing events and real-time analysis of race statistics.

Governing bodies and racing associations work to maintain integrity and adhere to strict regulations, including drug testing and animal rights. The horse racing industry is a global phenomenon, with events such as the Triple Crown, Royal Ascot, Melbourne Cup, and Breeders' Cup attracting international attention. Racing equipment, including boots, helmets, and racing silks, plays a vital role in ensuring the safety and comfort of horses. Race preparation and training regimens are continually refined to optimize performance, with racing surfaces and race classes catering to various horse breeds and abilities. Pari-mutuel betting and betting exchanges offer fans the opportunity to place wagers on their preferred horses, with fixed odds providing a sense of security and predictability.

Horse racing statistics and betting odds are closely monitored by fans and industry experts, with post-race recovery and race distances influencing the outcome of races. In summary, the market is a dynamic and evolving industry, with various sectors interconnected and influencing one another. From veterinary care and track conditions to fan engagement and gambling regulation, the horse racing industry continues to innovate and adapt to meet the changing needs and expectations of fans and stakeholders.

How is this Horse Racing Industry segmented?

The horse racing industry research report provides comprehensive data (region-wise segment analysis), with forecasts and estimates in "USD billion" for the period 2024-2028, as well as historical data from 2018-2022 for the following segments.

  • Type
    • Flat racing
    • Jump racing
    • Harness racing
    • Endurance racing
  • Revenue Stream
    • Betting revenue
    • Live event revenue
    • Broadcasting rights
    • Sponsorship and advertising
    • Horse sales and breeding
  • Geography
    • North America
      • US
    • Europe
      • France
      • UK
    • APAC
      • Australia
      • Japan
    • Rest of World (ROW)

By Type Insights

The flat racing segment is estimated to witness significant growth during the forecast period.

Flat horse racing is a globally popular equestrian sport where horses compete over predetermined distances, ranging from 402 to 4,828 meters. The majority of races take place on turf, with North America predominantly using dirt surfaces. This cultural phenomenon attracts millions of spectators annually, particularly in the UK, where it intertwines with fashion and social events. The sport's strategy and unique horse-jockey bond make it captivating. Media coverage and social media platforms amplify fan engagement, allowing real-time access to races like the Kentucky Derby, Melbourne Cup, and Royal Ascot. Online streaming services and betting exchanges provide convenience for fans, while pari-mutuel betting adds an element of excitement.

Equine welfare and racing integrity are crucial concerns, with governing bodies implementing regulations and veterinary care ensuring horse health. Racing equipment, including boots and helmets, plays a significant role in optimizing performance. Race strategy and training regimens are meticulously planned to maximize a horse's potential. Performance data and statistics offer valuable insights for bettors, while gambling regulation ensures fairness. The Triple Crown, Breeders' Cup, and Grand National are prestigious events that test both horse and jockey. Race classes, distances, and surfaces vary, catering to diverse horses and riders. The horse racing industry thrives on these events, contributing billions in prize money.

Drug testing and animal rights are ongoing debates in the industry, with a focus on maintaining horse racing's integrity. The sport continues to evolve, adapting to technological advancements and fan expectations, making it an enduring and dynamic part of the equestrian world.

Horse Racing Market Size

Request Free Sample

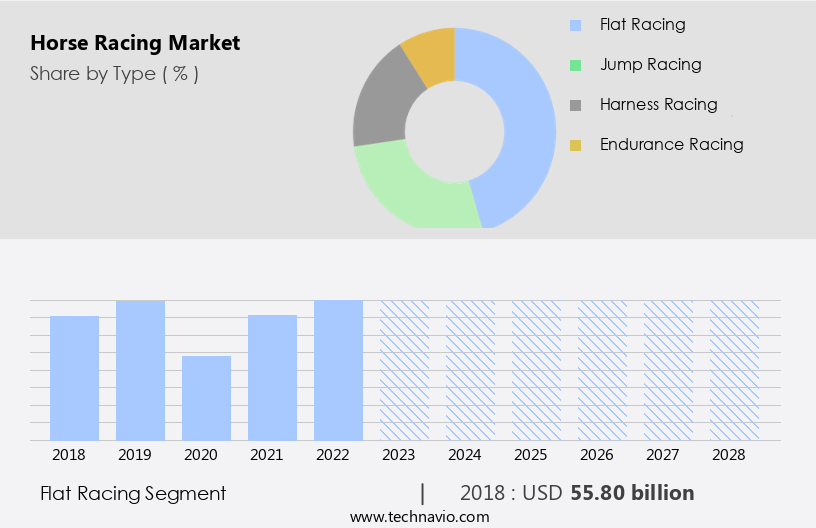
The Flat racing segment was valued at USD 55.80 billion in 2018 and showed a gradual increase during the forecast period.

Regional Analysis

North America is estimated to contribute 40% to the growth of the global market during the forecast period. Technavio's analysts have elaborately explained the regional trends and drivers that shape the market during the forecast period.

Horse Racing Market Share by Geography

 Request Free Sample

The North American market, encompassing the US and Canada, has witnessed substantial growth in recent years. Factors driving this expansion include the legalization of sports betting in numerous states, broadening the market and fueling renewed interest in horse racing as a betting alternative. Marquee events, such as the Triple Crown races, continue to captivate audiences and set record-breaking betting handles. The industry's modernization efforts, with racetracks investing in advanced facilities and technology, have significantly improved spectator experiences. Innovative betting products, like historical horse racing machines, have further bolstered revenue. Horse racing media coverage, social media engagement, and online streaming platforms have expanded fan accessibility and interaction.

Equine welfare, race strategy, and equine health remain top priorities, with governing bodies enforcing strict regulations and veterinary care ensuring the wellbeing of the animals. The horse racing industry's commitment to integrity, through drug testing and horse racing statistics, has strengthened its reputation. Horse racing events, including the Kentucky Derby, Melbourne Cup, and Royal Ascot, attract global attention, while racing associations and broadcast rights holders collaborate to maximize exposure. Racing helmets, equipment, and silks have evolved to enhance safety and performance, with racing associations setting standards for training regimens and race surfaces. The Breeders' Cup, Prix de l'Arc de Triomphe, and other prestigious races offer significant prize money and prestige.

Fan engagement initiatives, such as betting exchanges and fixed odds, have intensified the excitement around horse racing, with betting odds and race distances adding to the thrill. Animal rights advocacy groups and racing associations continue to collaborate on race preparation and race classes, ensuring fairness and transparency. The market's evolution reflects a harmonious balance of tradition and innovation.

Market Dynamics

Our researchers analyzed the data with 2023 as the base year, along with the key drivers, trends, and challenges. A holistic analysis of drivers will help companies refine their marketing strategies to gain a competitive advantage.

What are the key market drivers leading to the rise in the adoption of Horse Racing Industry?

  • The involvement of younger audiences is a significant factor fueling the growth of the market. 
  • The market is experiencing renewed growth due to strategic efforts to attract younger demographics. Previously perceived as an older generation's sport, horse racing is now embracing modern marketing techniques, digital experiences, and social media integration. Racecourses are transforming into entertainment destinations, featuring music festivals, gourmet food experiences, and technology zones, in addition to races. Online streaming, mobile betting apps, and fantasy racing leagues are making the sport more accessible and engaging for tech-savvy millennials and Gen Z. These initiatives are essential for the long-term sustainability of the industry. Media coverage, equine welfare, race strategy, and equine health remain focal points, with a strong emphasis on post-race recovery.
  • Social media platforms facilitate real-time engagement and discussion, further increasing the sport's reach and appeal. Horse racing tourism continues to thrive, with fans traveling to witness renowned events such as the Kentucky Derby. The integration of technology and innovation is propelling the market forward, ensuring its relevance in the modern world.

What are the market trends shaping the Horse Racing Industry?

  • The increasing prevalence of online betting platforms represents a significant market trend. This shift towards digital gambling solutions is driven by convenience, accessibility, and advanced technology.
  • The market is experiencing growth due to the increasing popularity of online betting platforms. These digital platforms provide fans with the convenience of placing wagers from anywhere, using smartphones or computers, eliminating the need to physically visit racetracks or betting shops. This accessibility is attracting new audiences and increasing overall participation in the sport. Veterinary care and track conditions remain crucial factors in the industry, with governing bodies ensuring strict regulations are in place to ensure the welfare of the horses. Horse racing media and statistics, including performance data and prize money, are widely available online, providing fans with comprehensive information to inform their betting decisions.
  • Gambling regulation varies from region to region, with each jurisdiction having its specific laws and guidelines. The horse racing calendar includes prestigious events such as the Triple Crown and Royal Ascot, which garner significant fan engagement and media attention. Fans can now access a wealth of horse racing statistics and data to inform their betting decisions, enhancing their overall experience. Despite the digital shift, fan engagement remains a priority, with various initiatives aimed at creating immersive and harmonious experiences for horse racing enthusiasts.

What challenges does the Horse Racing Industry face during its growth?

  • The growth of the industry is being significantly impacted by increasing concerns for animal welfare, which represents a major challenge that must be addressed by professionals in a knowledgeable and formal manner. 
  • The horse racing industry faces growing concerns for animal welfare, which poses a significant challenge to its market dynamics. Public awareness and scrutiny over the treatment of racehorses have intensified, leading to pressure on the industry to address ethical issues. Critics raise concerns about overbreeding, intense training regimens, race-day medication use, and the fate of horses post-racing careers. Incidents of horse injuries and fatalities during races have further intensified the debate, resulting in declining attendance at some racetracks and sponsors/investors distancing themselves from the sport. In response, the industry is implementing initiatives to improve horse welfare, such as enhanced veterinary care, track surface improvements, and retirement programs for ex-racehorses.
  • Stricter regulations on drug testing and race preparation are also being enforced to ensure fair competition and horse safety. The market's future relies on the industry's ability to adapt to these changing societal expectations and prioritize animal welfare while maintaining the integrity of racing events and preserving the excitement of the sport for fans.

Exclusive Customer Landscape

The horse racing market forecasting report includes the adoption lifecycle of the market, covering from the innovator's stage to the laggard's stage. It focuses on adoption rates in different regions based on penetration. Furthermore, the horse racing market report also includes key purchase criteria and drivers of price sensitivity to help companies evaluate and develop their market growth analysis strategies.
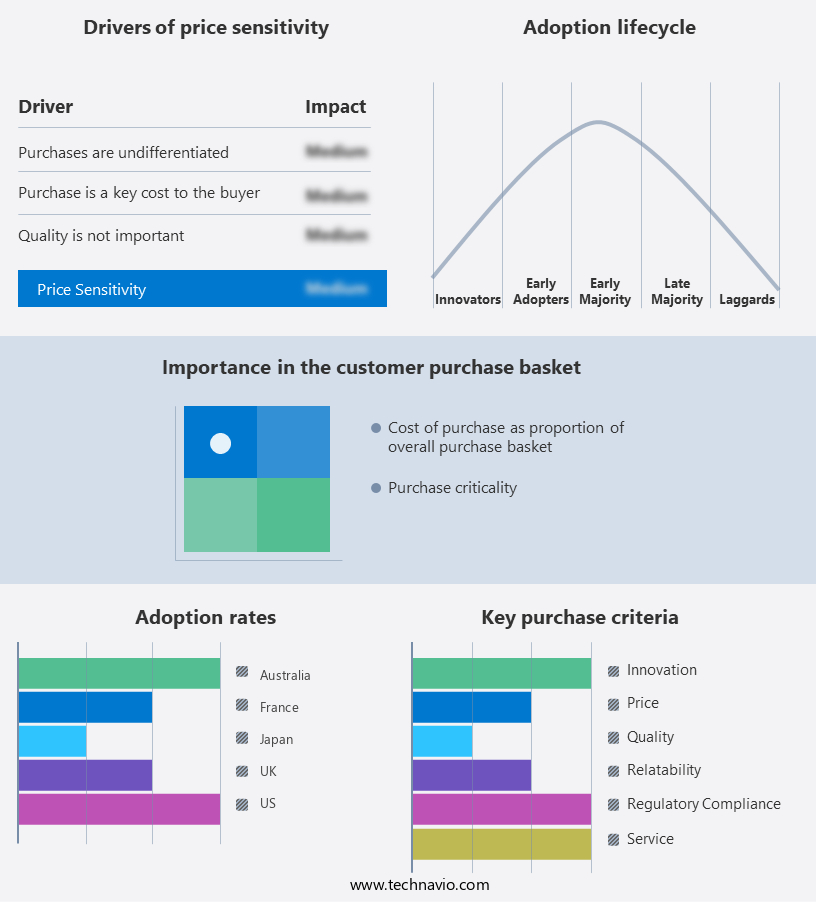
Horse Racing Market Share by Geography

 Customer Landscape

Key Companies & Market Insights

Companies are implementing various strategies, such as strategic alliances, horse racing market forecast, partnerships, mergers and acquisitions, geographical expansion, and product/service launches, to enhance their presence in the industry.

American Horse Company LLC - The company specializes in providing equine supplements, including mushroom, bluey, and misty, enhancing animal health and performance through innovative, science-backed formulations. 

The industry research and growth report includes detailed analyses of the competitive landscape of the market and information about key companies, including:

  • American Horse Company LLC
  • GALLERY HORSE
  • Godolphin
  • Goresbridge Horse Sales
  • Hemphills Horses, Feed and Saddlery, Inc.
  • Horse Scout Ltd
  • Horses China
  • Iron Spring Farm
  • JCB Horse Sales, LLC
  • KAMA GODEK
  • K and L Stables
  • MFS STUDFARM
  • Mount St John Equestrian
  • NorCordia 
  • Platinum Horse Sales
  • Primi
  • Royal Horse Farms
  • Setters Run Farm
  • VOGLIS RIDING INTERNATIONAL
  • Woodcroft Stud

Qualitative and quantitative analysis of companies has been conducted to help clients understand the wider business environment as well as the strengths and weaknesses of key industry players. Data is qualitatively analyzed to categorize companies as pure play, category-focused, industry-focused, and diversified; it is quantitatively analyzed to categorize companies as dominant, leading, strong, tentative, and weak.

Recent Development and News in Horse Racing Market

  • In January 2024, The Jockey Club, a leading American horse racing organization, announced a partnership with Microsoft to implement Microsoft Azure's cloud technology for enhancing fan engagement and optimizing race day operations (The Jockey Club press release, 2024). This collaboration aimed to provide real-time data analysis, personalized fan experiences, and improved wagering services.
  • In March 2024, Churchill Downs Incorporated, the largest company in the horse racing industry, acquired Presque Isle Downs & Casino in Pennsylvania for USD275 million, expanding its footprint in the US gambling market (Bloomberg, 2024). This acquisition added a racetrack and a casino to Churchill Downs' portfolio, enhancing its presence in the Eastern US.
  • In April 2025, the Australian Racing and Wagering Board approved the use of in-race betting technology, allowing real-time wagers during horse races (ARWB press release, 2025). This decision marked a significant shift towards modernizing the Australian horse racing industry and increasing fan engagement.
  • In May 2025, Saudi Arabia's Public Investment Fund announced a USD1 billion investment in the development of a new horse racing complex in Riyadh (Reuters, 2025). This investment is expected to attract international horse racing events and boost the Saudi Arabian equestrian industry.

Research Analyst Overview

  • In the dynamic world of horse racing, various entities play pivotal roles. Handicappers, with their analytical skills, decipher intricacies in race results and form guides to provide expert predictions. Meanwhile, equine photography captures the beauty and intensity of the sport, showcased on horse racing websites and blogs. Stud farms breed the next generation of racing champions, while race officials ensure fair competition. Horse racing legends, etched in history, inspire new generations. Equine insurance, stable management, and horse transportation are essential services, safeguarding horses and facilitating their movement. Race cards, form guides, and live odds provide valuable information for betting pools.
  • Bloodstock agents facilitate horse sales, while harness racing and flat racing cater to diverse preferences. Horse racing news keeps the industry informed, and museums preserve its rich history. Horse racing apps offer convenience, and quarter horses, with their unique traits, add to the sport's diversity. Jump racing, with its thrilling challenges, tests both horse and rider. Expert analysis and racing tips from horse racing analysts add to the excitement, making this market a captivating blend of tradition, innovation, and competition.

Dive into Technavio's robust research methodology, blending expert interviews, extensive data synthesis, and validated models for unparalleled Horse Racing Market insights. See full methodology.

Market Scope

Report Coverage

Details

Page number

210

Base year

2023

Historic period

2018-2022

Forecast period

2024-2028

Growth momentum & CAGR

Accelerate at a CAGR of 14.71%

Market growth 2024-2028

USD 114.5 billion

Market structure

Fragmented

YoY growth 2023-2024(%)

13.7

Key countries

US, UK, Australia, France, and Japan

Competitive landscape

Leading Companies, Market Positioning of Companies, Competitive Strategies, and Industry Risks

Request Free Sample

What are the Key Data Covered in this Horse Racing Market Research and Growth Report?

  • CAGR of the Horse Racing industry during the forecast period
  • Detailed information on factors that will drive the growth and forecasting between 2024 and 2028
  • Precise estimation of the size of the market and its contribution of the industry in focus to the parent market
  • Accurate predictions about upcoming growth and trends and changes in consumer behaviour
  • Growth of the market across North America, Europe, APAC, Middle East and Africa, and South America
  • Thorough analysis of the market's competitive landscape and detailed information about companies
  • Comprehensive analysis of factors that will challenge the horse racing market growth of industry companies

We can help! Our analysts can customize this horse racing market research report to meet your requirements.

Get in touch

1 Executive Summary

  • 1.1 Market overview
    • Executive Summary - Chart on Market Overview
    • Executive Summary - Data Table on Market Overview
    • Executive Summary - Chart on Global Market Characteristics
    • Executive Summary - Chart on Market by Geography
    • Executive Summary - Chart on Market Segmentation by Type
    • Executive Summary - Chart on Market Segmentation by Revenue Stream
    • Executive Summary - Chart on Incremental Growth
    • Executive Summary - Data Table on Incremental Growth
    • Executive Summary - Chart on Company Market Positioning

2 Technavio Analysis

  • 2.1 Analysis of price sensitivity, lifecycle, customer purchase basket, adoption rates, and purchase criteria
    • Analysis of price sensitivity, lifecycle, customer purchase basket, adoption rates, and purchase criteria
  • 2.2 Criticality of inputs and Factors of differentiation
    • Overview on criticality of inputs and factors of differentiation
  • 2.3 Factors of disruption
    • Overview on factors of disruption
  • 2.4 Impact of drivers and challenges
    • Impact of drivers and challenges in 2023 and 2028

3 Market Landscape

  • 3.1 Market ecosystem
    • Parent Market
    • Data Table on - Parent Market
  • 3.2 Market characteristics
    • Market characteristics analysis
  • 3.3 Value chain analysis
    • Value Chain Analysis

4 Market Sizing

  • 4.1 Market definition
    • Offerings of companies included in the market definition
  • 4.2 Market segment analysis
    • Market segments
  • 4.3 Market size 2023
    • 4.4 Market outlook: Forecast for 2023-2028
      • Chart on Global - Market size and forecast 2023-2028 ($ billion)
      • Data Table on Global - Market size and forecast 2023-2028 ($ billion)
      • Chart on Global Market: Year-over-year growth 2023-2028 (%)
      • Data Table on Global Market: Year-over-year growth 2023-2028 (%)

    5 Historic Market Size

    • 5.1 Global Horse Racing Market 2018 - 2022
      • Historic Market Size - Data Table on Global Horse Racing Market 2018 - 2022 ($ billion)
    • 5.2 Type segment analysis 2018 - 2022
      • Historic Market Size - Type Segment 2018 - 2022 ($ billion)
    • 5.3 Revenue Stream segment analysis 2018 - 2022
      • Historic Market Size - Revenue Stream Segment 2018 - 2022 ($ billion)
    • 5.4 Geography segment analysis 2018 - 2022
      • Historic Market Size - Geography Segment 2018 - 2022 ($ billion)
    • 5.5 Country segment analysis 2018 - 2022
      • Historic Market Size - Country Segment 2018 - 2022 ($ billion)

    6 Qualitative Analysis

    • 6.1 Impact of AI on the Global Horse Racing Market

      7 Five Forces Analysis

      • 7.1 Five forces summary
        • Five forces analysis - Comparison between 2023 and 2028
      • 7.2 Bargaining power of buyers
        • Bargaining power of buyers - Impact of key factors 2023 and 2028
      • 7.3 Bargaining power of suppliers
        • Bargaining power of suppliers - Impact of key factors in 2023 and 2028
      • 7.4 Threat of new entrants
        • Threat of new entrants - Impact of key factors in 2023 and 2028
      • 7.5 Threat of substitutes
        • Threat of substitutes - Impact of key factors in 2023 and 2028
      • 7.6 Threat of rivalry
        • Threat of rivalry - Impact of key factors in 2023 and 2028
      • 7.7 Market condition
        • Chart on Market condition - Five forces 2023 and 2028

      8 Market Segmentation by Type

      • 8.1 Market segments
        • Chart on Type - Market share 2023-2028 (%)
        • Data Table on Type - Market share 2023-2028 (%)
      • 8.2 Comparison by Type
        • Chart on Comparison by Type
        • Data Table on Comparison by Type
      • 8.3 Flat racing - Market size and forecast 2023-2028
        • Chart on Flat racing - Market size and forecast 2023-2028 ($ billion)
        • Data Table on Flat racing - Market size and forecast 2023-2028 ($ billion)
        • Chart on Flat racing - Year-over-year growth 2023-2028 (%)
        • Data Table on Flat racing - Year-over-year growth 2023-2028 (%)
      • 8.4 Jump racing - Market size and forecast 2023-2028
        • Chart on Jump racing - Market size and forecast 2023-2028 ($ billion)
        • Data Table on Jump racing - Market size and forecast 2023-2028 ($ billion)
        • Chart on Jump racing - Year-over-year growth 2023-2028 (%)
        • Data Table on Jump racing - Year-over-year growth 2023-2028 (%)
      • 8.5 Harness racing - Market size and forecast 2023-2028
        • Chart on Harness racing - Market size and forecast 2023-2028 ($ billion)
        • Data Table on Harness racing - Market size and forecast 2023-2028 ($ billion)
        • Chart on Harness racing - Year-over-year growth 2023-2028 (%)
        • Data Table on Harness racing - Year-over-year growth 2023-2028 (%)
      • 8.6 Endurance racing - Market size and forecast 2023-2028
        • Chart on Endurance racing - Market size and forecast 2023-2028 ($ billion)
        • Data Table on Endurance racing - Market size and forecast 2023-2028 ($ billion)
        • Chart on Endurance racing - Year-over-year growth 2023-2028 (%)
        • Data Table on Endurance racing - Year-over-year growth 2023-2028 (%)
      • 8.7 Market opportunity by Type
        • Market opportunity by Type ($ billion)
        • Data Table on Market opportunity by Type ($ billion)

      9 Market Segmentation by Revenue Stream

      • 9.1 Market segments
        • Chart on Revenue Stream - Market share 2023-2028 (%)
        • Data Table on Revenue Stream - Market share 2023-2028 (%)
      • 9.2 Comparison by Revenue Stream
        • Chart on Comparison by Revenue Stream
        • Data Table on Comparison by Revenue Stream
      • 9.3 Betting revenue - Market size and forecast 2023-2028
        • Chart on Betting revenue - Market size and forecast 2023-2028 ($ billion)
        • Data Table on Betting revenue - Market size and forecast 2023-2028 ($ billion)
        • Chart on Betting revenue - Year-over-year growth 2023-2028 (%)
        • Data Table on Betting revenue - Year-over-year growth 2023-2028 (%)
      • 9.4 Live event revenue - Market size and forecast 2023-2028
        • Chart on Live event revenue - Market size and forecast 2023-2028 ($ billion)
        • Data Table on Live event revenue - Market size and forecast 2023-2028 ($ billion)
        • Chart on Live event revenue - Year-over-year growth 2023-2028 (%)
        • Data Table on Live event revenue - Year-over-year growth 2023-2028 (%)
      • 9.5 Broadcasting rights - Market size and forecast 2023-2028
        • Chart on Broadcasting rights - Market size and forecast 2023-2028 ($ billion)
        • Data Table on Broadcasting rights - Market size and forecast 2023-2028 ($ billion)
        • Chart on Broadcasting rights - Year-over-year growth 2023-2028 (%)
        • Data Table on Broadcasting rights - Year-over-year growth 2023-2028 (%)
      • 9.6 Sponsorship and advertising - Market size and forecast 2023-2028
        • Chart on Sponsorship and advertising - Market size and forecast 2023-2028 ($ billion)
        • Data Table on Sponsorship and advertising - Market size and forecast 2023-2028 ($ billion)
        • Chart on Sponsorship and advertising - Year-over-year growth 2023-2028 (%)
        • Data Table on Sponsorship and advertising - Year-over-year growth 2023-2028 (%)
      • 9.7 Horse sales and breeding - Market size and forecast 2023-2028
        • Chart on Horse sales and breeding - Market size and forecast 2023-2028 ($ billion)
        • Data Table on Horse sales and breeding - Market size and forecast 2023-2028 ($ billion)
        • Chart on Horse sales and breeding - Year-over-year growth 2023-2028 (%)
        • Data Table on Horse sales and breeding - Year-over-year growth 2023-2028 (%)
      • 9.8 Market opportunity by Revenue Stream
        • Market opportunity by Revenue Stream ($ billion)
        • Data Table on Market opportunity by Revenue Stream ($ billion)

      10 Customer Landscape

      • 10.1 Customer landscape overview
        • Analysis of price sensitivity, lifecycle, customer purchase basket, adoption rates, and purchase criteria

      11 Geographic Landscape

      • 11.1 Geographic segmentation
        • Chart on Market share by geography 2023-2028 (%)
        • Data Table on Market share by geography 2023-2028 (%)
      • 11.2 Geographic comparison
        • Chart on Geographic comparison
        • Data Table on Geographic comparison
      • 11.3 North America - Market size and forecast 2023-2028
        • Chart on North America - Market size and forecast 2023-2028 ($ billion)
        • Data Table on North America - Market size and forecast 2023-2028 ($ billion)
        • Chart on North America - Year-over-year growth 2023-2028 (%)
        • Data Table on North America - Year-over-year growth 2023-2028 (%)
      • 11.4 Europe - Market size and forecast 2023-2028
        • Chart on Europe - Market size and forecast 2023-2028 ($ billion)
        • Data Table on Europe - Market size and forecast 2023-2028 ($ billion)
        • Chart on Europe - Year-over-year growth 2023-2028 (%)
        • Data Table on Europe - Year-over-year growth 2023-2028 (%)
      • 11.5 APAC - Market size and forecast 2023-2028
        • Chart on APAC - Market size and forecast 2023-2028 ($ billion)
        • Data Table on APAC - Market size and forecast 2023-2028 ($ billion)
        • Chart on APAC - Year-over-year growth 2023-2028 (%)
        • Data Table on APAC - Year-over-year growth 2023-2028 (%)
      • 11.6 Middle East and Africa - Market size and forecast 2023-2028
        • Chart on Middle East and Africa - Market size and forecast 2023-2028 ($ billion)
        • Data Table on Middle East and Africa - Market size and forecast 2023-2028 ($ billion)
        • Chart on Middle East and Africa - Year-over-year growth 2023-2028 (%)
        • Data Table on Middle East and Africa - Year-over-year growth 2023-2028 (%)
      • 11.7 South America - Market size and forecast 2023-2028
        • Chart on South America - Market size and forecast 2023-2028 ($ billion)
        • Data Table on South America - Market size and forecast 2023-2028 ($ billion)
        • Chart on South America - Year-over-year growth 2023-2028 (%)
        • Data Table on South America - Year-over-year growth 2023-2028 (%)
      • 11.8 US - Market size and forecast 2023-2028
        • Chart on US - Market size and forecast 2023-2028 ($ billion)
        • Data Table on US - Market size and forecast 2023-2028 ($ billion)
        • Chart on US - Year-over-year growth 2023-2028 (%)
        • Data Table on US - Year-over-year growth 2023-2028 (%)
      • 11.9 UK - Market size and forecast 2023-2028
        • Chart on UK - Market size and forecast 2023-2028 ($ billion)
        • Data Table on UK - Market size and forecast 2023-2028 ($ billion)
        • Chart on UK - Year-over-year growth 2023-2028 (%)
        • Data Table on UK - Year-over-year growth 2023-2028 (%)
      • 11.10 Australia - Market size and forecast 2023-2028
        • Chart on Australia - Market size and forecast 2023-2028 ($ billion)
        • Data Table on Australia - Market size and forecast 2023-2028 ($ billion)
        • Chart on Australia - Year-over-year growth 2023-2028 (%)
        • Data Table on Australia - Year-over-year growth 2023-2028 (%)
      • 11.11 France - Market size and forecast 2023-2028
        • Chart on France - Market size and forecast 2023-2028 ($ billion)
        • Data Table on France - Market size and forecast 2023-2028 ($ billion)
        • Chart on France - Year-over-year growth 2023-2028 (%)
        • Data Table on France - Year-over-year growth 2023-2028 (%)
      • 11.12 Japan - Market size and forecast 2023-2028
        • Chart on Japan - Market size and forecast 2023-2028 ($ billion)
        • Data Table on Japan - Market size and forecast 2023-2028 ($ billion)
        • Chart on Japan - Year-over-year growth 2023-2028 (%)
        • Data Table on Japan - Year-over-year growth 2023-2028 (%)
      • 11.13 Germany - Market size and forecast 2023-2028
        • Chart on Germany - Market size and forecast 2023-2028 ($ billion)
        • Data Table on Germany - Market size and forecast 2023-2028 ($ billion)
        • Chart on Germany - Year-over-year growth 2023-2028 (%)
        • Data Table on Germany - Year-over-year growth 2023-2028 (%)
      • 11.14 UAE - Market size and forecast 2023-2028
        • Chart on UAE - Market size and forecast 2023-2028 ($ billion)
        • Data Table on UAE - Market size and forecast 2023-2028 ($ billion)
        • Chart on UAE - Year-over-year growth 2023-2028 (%)
        • Data Table on UAE - Year-over-year growth 2023-2028 (%)
      • 11.15 Italy - Market size and forecast 2023-2028
        • Chart on Italy - Market size and forecast 2023-2028 ($ billion)
        • Data Table on Italy - Market size and forecast 2023-2028 ($ billion)
        • Chart on Italy - Year-over-year growth 2023-2028 (%)
        • Data Table on Italy - Year-over-year growth 2023-2028 (%)
      • 11.16 Canada - Market size and forecast 2023-2028
        • Chart on Canada - Market size and forecast 2023-2028 ($ billion)
        • Data Table on Canada - Market size and forecast 2023-2028 ($ billion)
        • Chart on Canada - Year-over-year growth 2023-2028 (%)
        • Data Table on Canada - Year-over-year growth 2023-2028 (%)
      • 11.17 South Africa - Market size and forecast 2023-2028
        • Chart on South Africa - Market size and forecast 2023-2028 ($ billion)
        • Data Table on South Africa - Market size and forecast 2023-2028 ($ billion)
        • Chart on South Africa - Year-over-year growth 2023-2028 (%)
        • Data Table on South Africa - Year-over-year growth 2023-2028 (%)
      • 11.18 Market opportunity by geography
        • Market opportunity by geography ($ billion)
        • Data Tables on Market opportunity by geography ($ billion)

      12 Drivers, Challenges, and Opportunity/Restraints

      • 12.1 Market drivers
        • 12.2 Market challenges
          • 12.3 Impact of drivers and challenges
            • Impact of drivers and challenges in 2023 and 2028
          • 12.4 Market opportunities/restraints

            13 Competitive Landscape

            • 13.1 Overview
              • 13.2 Competitive Landscape
                • Overview on criticality of inputs and factors of differentiation
              • 13.3 Landscape disruption
                • Overview on factors of disruption
              • 13.4 Industry risks
                • Impact of key risks on business

              14 Competitive Analysis

              • 14.1 Companies profiled
                • Companies covered
              • 14.2 Company ranking index
                • Company ranking index
              • 14.3 Market positioning of companies
                • Matrix on companies position and classification
              • 14.4 American Horse Company LLC
                • American Horse Company LLC - Overview
                • American Horse Company LLC - Product / Service
                • American Horse Company LLC - Key offerings
                • SWOT
              • 14.5 Godolphin
                • Godolphin - Overview
                • Godolphin - Product / Service
                • Godolphin - Key offerings
                • SWOT
              • 14.6 Goresbridge Horse Sales
                • Goresbridge Horse Sales - Overview
                • Goresbridge Horse Sales - Product / Service
                • Goresbridge Horse Sales - Key offerings
                • SWOT
              • 14.7 Hemphills Horses, Feed and Saddlery, Inc.
                • Hemphills Horses, Feed and Saddlery, Inc. - Overview
                • Hemphills Horses, Feed and Saddlery, Inc. - Product / Service
                • Hemphills Horses, Feed and Saddlery, Inc. - Key offerings
                • SWOT
              • 14.8 Horses China
                • Horses China - Overview
                • Horses China - Product / Service
                • Horses China - Key offerings
                • SWOT
              • 14.9 Iron Spring Farm
                • Iron Spring Farm - Overview
                • Iron Spring Farm - Product / Service
                • Iron Spring Farm - Key offerings
                • SWOT
              • 14.10 JCB Horse Sales, LLC
                • JCB Horse Sales, LLC - Overview
                • JCB Horse Sales, LLC - Product / Service
                • JCB Horse Sales, LLC - Key offerings
                • SWOT
              • 14.11 KAMA GODEK
                • KAMA GODEK - Overview
                • KAMA GODEK - Product / Service
                • KAMA GODEK - Key offerings
                • SWOT
              • 14.12 K and L Stables
                • K and L Stables - Overview
                • K and L Stables - Product / Service
                • K and L Stables - Key offerings
                • SWOT
              • 14.13 MFS STUDFARM
                • MFS STUDFARM - Overview
                • MFS STUDFARM - Product / Service
                • MFS STUDFARM - Key offerings
                • SWOT
              • 14.14 Mount St John Equestrian
                • Mount St John Equestrian - Overview
                • Mount St John Equestrian - Product / Service
                • Mount St John Equestrian - Key offerings
                • SWOT
              • 14.15 Platinum Horse Sales
                • Platinum Horse Sales - Overview
                • Platinum Horse Sales - Product / Service
                • Platinum Horse Sales - Key offerings
                • SWOT
              • 14.16 Royal Horse Farms
                • Royal Horse Farms - Overview
                • Royal Horse Farms - Product / Service
                • Royal Horse Farms - Key offerings
                • SWOT
              • 14.17 Setters Run Farm
                • Setters Run Farm - Overview
                • Setters Run Farm - Product / Service
                • Setters Run Farm - Key offerings
                • SWOT
              • 14.18 Woodcroft Stud
                • Woodcroft Stud - Overview
                • Woodcroft Stud - Product / Service
                • Woodcroft Stud - Key offerings
                • SWOT

              15 Appendix

              • 15.1 Scope of the report
                • 15.2 Inclusions and exclusions checklist
                  • Inclusions checklist
                  • Exclusions checklist
                • 15.3 Currency conversion rates for US$
                  • Currency conversion rates for US$
                • 15.4 Research methodology
                  • Research methodology
                • 15.5 Data procurement
                  • Information sources
                • 15.6 Data validation
                  • Data validation
                • 15.7 Validation techniques employed for market sizing
                  • Validation techniques employed for market sizing
                • 15.8 Data synthesis
                  • Data synthesis
                • 15.9 360 degree market analysis
                  • 360 degree market analysis
                • 15.10 List of abbreviations
                  • List of abbreviations

                Research Methodology

                Technavio presents a detailed picture of the market by way of study, synthesis, and summation of data from multiple sources. The analysts have presented the various facets of the market with a particular focus on identifying the key industry influencers. The data thus presented is comprehensive, reliable, and the result of extensive research, both primary and secondary.

                INFORMATION SOURCES

                Primary sources

                • Manufacturers and suppliers
                • Channel partners
                • Industry experts
                • Strategic decision makers

                Secondary sources

                • Industry journals and periodicals
                • Government data
                • Financial reports of key industry players
                • Historical data
                • Press releases

                DATA ANALYSIS

                Data Synthesis

                • Collation of data
                • Estimation of key figures
                • Analysis of derived insights

                Data Validation

                • Triangulation with data models
                • Reference against proprietary databases
                • Corroboration with industry experts

                REPORT WRITING

                Qualitative

                • Market drivers
                • Market challenges
                • Market trends
                • Five forces analysis

                Quantitative

                • Market size and forecast
                • Market segmentation
                • Geographical insights
                • Competitive landscape

                Interested in this report?

                Get your sample now to see our research methodology and insights!

                Download Now

                Frequently Asked Questions

                Horse Racing market growth will increase by $ 114.5 bn during 2024-2028.

                The Horse Racing market is expected to grow at a CAGR of 14.71% during 2024-2028.

                Horse Racing market is segmented by Type( Flat racing, Jump racing, Harness racing, Endurance racing) Revenue Stream( Betting revenue, Live event revenue, Broadcasting rights, Sponsorship and advertising, Horse sales and breeding)

                American Horse Company LLC, GALLERY HORSE, Godolphin, Goresbridge Horse Sales, Hemphills Horses, Feed and Saddlery, Inc., Horse Scout Ltd, Horses China, Iron Spring Farm, JCB Horse Sales, LLC, KAMA GODEK, K and L Stables, MFS STUDFARM, Mount St John Equestrian, NorCordia , Platinum Horse Sales, Primi, Royal Horse Farms, Setters Run Farm, VOGLIS RIDING INTERNATIONAL, Woodcroft Stud are a few of the key vendors in the Horse Racing market.

                North America will register the highest growth rate of 40% among the other regions. Therefore, the Horse Racing market in North America is expected to garner significant business opportunities for the vendors during the forecast period.

                US, UK, Australia, France, Japan

                • Increasing involvement of younger audiences in horse racing is the driving factor this market.
                • sans-serif;font-size:12.0pt;">The increasing involvement of younger audiences is providing a significant boost to the global horse racing market. Traditionally seen as a sport favored by older generations is the driving factor this market.
                • the industry has been making concerted efforts to appeal to millennials and Gen Z. This shift is driven by innovative marketing strategies is the driving factor this market.
                • enhanced digital experiences is the driving factor this market.
                • and the integration of social media elements. Racecourses are reimagining themselves as entertainment destinations is the driving factor this market.
                • offering music festivals is the driving factor this market.
                • gourmet food experiences is the driving factor this market.
                • and interactive technology zones alongside races. Mobile betting apps and fantasy racing leagues are making the sport more accessible and engaging for tech-savvy younger audiences. Engaging younger audiences is critical for the long-term sustainability of horse racing. By fostering positive experiences and encouraging participation is the driving factor this market.
                • the industry aims to cultivate lifelong fans who may eventually become owners or active participants in the sport. Great British Racing (GBR) has launched campaigns in February 2022 aimed at attracting younger audiences is the driving factor this market.
                • particularly those aged 25 to 34 years. Additionally is the driving factor this market.
                • the emphasis on the social aspects of race days is the driving factor this market.
                • including fashion and lifestyle elements is the driving factor this market.
                • is attracting a new demographic. This influx of younger enthusiasts is not only revitalizing attendance numbers but also securing the long-term sustainability of the sport by cultivating a new generation of horse racing fans and potential owners. Thus is the driving factor this market.
                • the high involvement of younger audiences will boost the growth of the global market in focus during the forecast period. is the driving factor this market.

                The Horse Racing market vendors should focus on grabbing business opportunities from the Flat racing segment as it accounted for the largest market share in the base year.