
Sports Betting Market Size 2026-2030
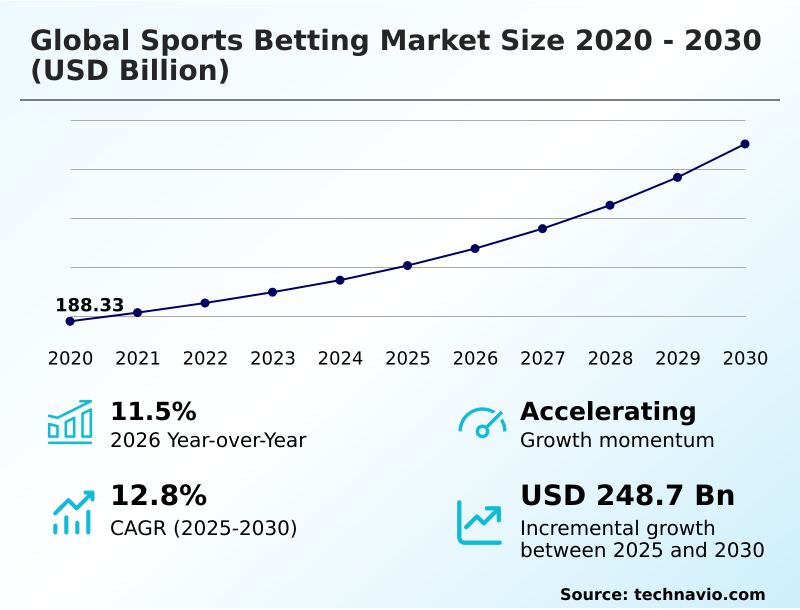
The sports betting market size is valued to increase by USD 248.70 billion, at a CAGR of 12.8% from 2025 to 2030. Progressive frameworks and widespread market legalization will drive the sports betting market.
Major Market Trends & Insights
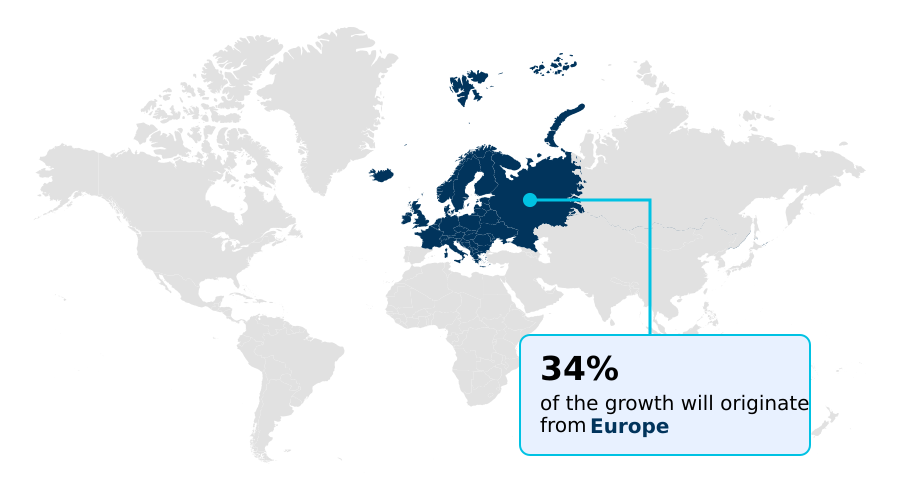
- Europe dominated the market and accounted for a 33.7% growth during the forecast period.
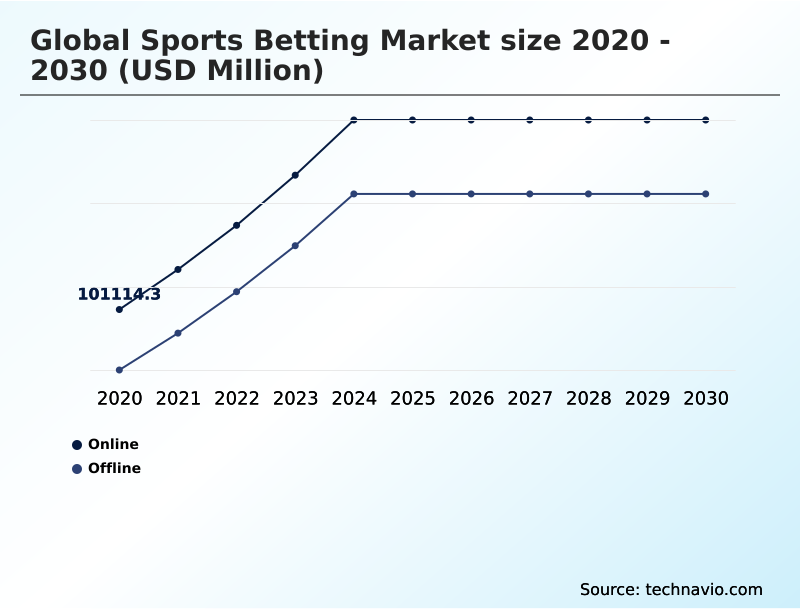
- By Platform - Online segment was valued at USD 144.69 billion in 2024
- By Type - Basketball segment accounted for the largest market revenue share in 2024
Market Size & Forecast
- Market Opportunities: USD 362.66 billion
- Market Future Opportunities: USD 248.70 billion
- CAGR from 2025 to 2030 : 12.8%
Market Summary
- The sports betting market is undergoing a profound transformation, driven by legislative shifts and technological innovation. The expansion into new jurisdictions, particularly in North America, has created a highly competitive environment where operators vie for market share. This growth is underpinned by the dominance of mobile platforms, which have become the primary point of engagement for consumers.
- The industry is characterized by a rapid evolution of product offerings, with a strong emphasis on in-play wagering and micro-betting, which enhance fan engagement by turning passive viewing into an interactive experience. In this dynamic landscape, a key business scenario involves operators leveraging AI and machine learning not just for odds creation and risk management, but for promoting responsible gaming.
- For instance, platforms now analyze user activity in real time to identify patterns of at-risk behavior, triggering automated interventions to encourage safer habits. This proactive approach is becoming a cornerstone of regulatory compliance and brand reputation, as the industry grapples with heightened public and governmental scrutiny.
- The convergence with sports media further fuels growth, embedding betting seamlessly into the sports consumption ecosystem and creating a powerful flywheel effect for the entire industry.
What will be the Size of the Sports Betting Market during the forecast period?
Get Key Insights on Market Forecast (PDF) Get Free Sample
How is the Sports Betting Market Segmented?
The sports betting industry research report provides comprehensive data (region-wise segment analysis), with forecasts and estimates in "USD million" for the period 2026-2030, as well as historical data from 2020-2024 for the following segments.
- Platform
- Online
- Offline
- Type
- Basketball
- Horse riding
- Football
- Others
- Category
- Live betting
- Fixed odds wagering
- Esports betting
- Exchange betting
- Geography
- APAC
- China
- Japan
- Australia
- Europe
- UK
- Germany
- France
- North America
- US
- Canada
- Mexico
- South America
- Brazil
- Argentina
- Middle East and Africa
- South Africa
- Turkey
- Israel
- Rest of World (ROW)
- APAC
By Platform Insights
The online segment is estimated to witness significant growth during the forecast period.
The online segment's expansion is fundamentally altering the sports betting market, driven by powerful sports betting platforms and sophisticated mobile betting applications. These platforms offer unparalleled convenience and have become the primary channel for fan engagement strategies.
Key to this is the variety of betting formats, from traditional fixed odds wagering to peer-to-peer betting exchange models.
Sportsbook operators are leveraging technology for algorithmic odds creation to provide dynamic live betting odds, particularly for high-frequency in-play wagering and micro-betting. Products like same-game parlays further boost user interaction.
However, this growth occurs within a complex online gambling regulation framework, where some jurisdictions still rely on older pari-mutuel system structures. In some regulated markets, operators face revenue reductions of up to 10% from new compliance measures.
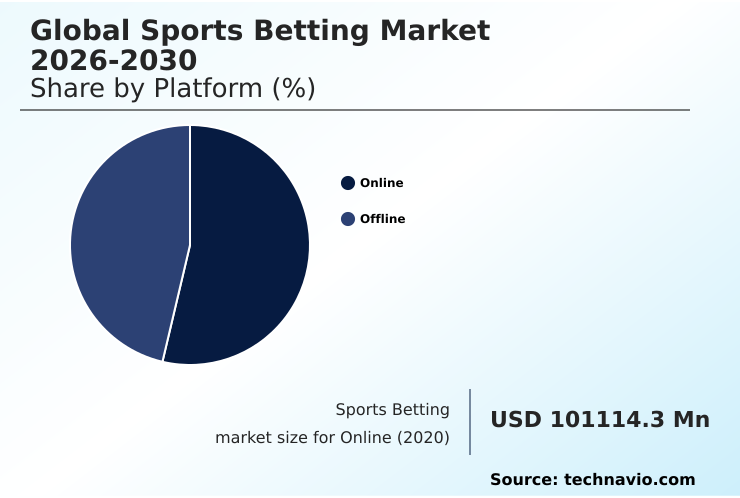
The Online segment was valued at USD 144.69 billion in 2024 and showed a gradual increase during the forecast period.
Regional Analysis
Europe is estimated to contribute 33.7% to the growth of the global market during the forecast period.Technavio’s analysts have elaborately explained the regional trends and drivers that shape the market during the forecast period.
See How Sports Betting Market Demand is Rising in Europe Get Free Sample
The geographic landscape is highly varied. Europe, representing 33.7% of the incremental growth, is a mature region where established bookmakers and modern online platforms compete, facing stringent betting advertising restrictions.
In contrast, North America is experiencing explosive growth, with the betting handle increasing over 50% in some newly regulated states.
The sports wagering experience is shifting from the traditional retail sportsbook to mobile-first interfaces with a focus on intuitive user interface design. Operators analyze wagering volume and use player risk profiling to manage liability.
In emerging markets, gamification techniques and diverse betting markets, including prop bets, are used to drive customer retention. A player's journey from creating a bet slip to cashing out is a key focus for product development.
Market Dynamics
Our researchers analyzed the data with 2025 as the base year, along with the key drivers, trends, and challenges. A holistic analysis of drivers will help companies refine their marketing strategies to gain a competitive advantage.
- A core strategic discussion for any modern operator centers on product and compliance. The first question is often how does in-play betting work from a technical standpoint, which leads directly to the need for robust technologies for micro-betting markets. This is closely tied to the role of data providers in sportsbooks and the necessity of real-time risk management in sportsbooks.
- Simultaneously, the legal team outlines the challenges of sports betting regulation and the regulatory hurdles in emerging betting markets, emphasizing the complex legal framework for online sports betting. This includes implementing geofencing solutions for state-level betting. The discussion then pivots to customer-facing issues.
- Marketing presents its analysis on optimizing customer acquisition in betting and proposes strategies for reducing betting marketing costs in a saturated environment. A key initiative is integrating betting into sports media to drive organic growth and enhance fan engagement through sports betting.
- The product team demonstrates the future of esports betting platforms and presents an omni-channel strategy for betting operators, which data shows can improve retention by over 25% compared to online-only models. They also address the impact of mobile on sports wagering and the need for continuous improvement in payment processing for online sportsbooks.
- The session concludes with a deep dive into AI applications in responsible gaming, the implementation of responsible gaming tools for players, and a technical review comparing fixed odds and exchange betting while also analyzing player proposition bet value to refine the overall offering.
What are the key market drivers leading to the rise in the adoption of Sports Betting Industry?
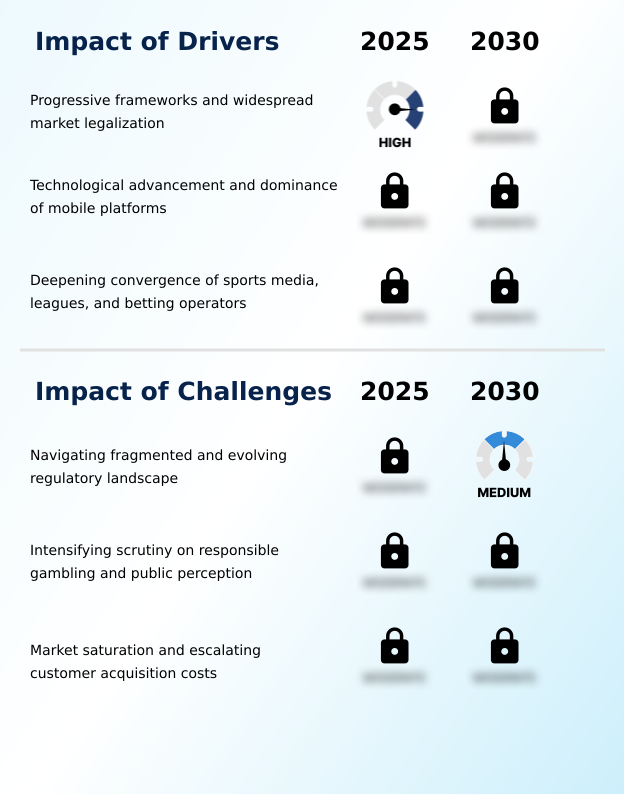
- The expansion of progressive regulatory frameworks and widespread market legalization serves as a key driver for the industry's growth.
- Regulatory liberalization is a primary driver, with new frameworks enabling market entry and growth. The success of these markets hinges on sports wagering technology, including geofencing technology for state-level compliance and robust KYC compliance protocols.
- The consumer experience is enhanced through an omni-channel approach and seamless payment gateway integration for digital payment solutions. Technologically, low latency data feeds using official league data are critical for in-play offerings.
- Operators are adopting sports analytics for betting to refine odds and marketing, often using betting affiliate marketing to expand reach.
- Many operators are also investing heavily in responsible gambling initiatives, with some platforms seeing a 15% increase in user adoption of voluntary limit-setting tools, which supports a sustainable cross-platform betting experience despite pressures from affordability checks.
What are the market trends shaping the Sports Betting Industry?
- A key market trend is the deep integration of betting functionalities into the live sports media experience. This convergence transforms passive viewership into an interactive engagement platform.
- The market is defined by a deep sports media integration, creating a seamless watch-and-wager environment. The focus is shifting from pure growth to maximizing customer lifetime value, with operators using responsible gaming technology and robust player protection tools to ensure sustainability. This includes deploying AI-powered player monitoring to identify at-risk behaviors.
- The proliferation of player proposition bets and the cash-out feature enhances user control, while emerging esports betting markets and fantasy sports integration attract new demographics. The competitive landscape, however, leads to high customer acquisition cost, sometimes exceeding $500 per user, and challenges with promotional bonus abuse.
- These dynamics operate within strict regulatory compliance frameworks that influence betting market liquidity and overall strategy.
What challenges does the Sports Betting Industry face during its growth?
- Navigating a fragmented and continuously evolving regulatory landscape presents a key challenge to industry growth and operational scalability.
- Key challenges stem from intense competition and market saturation, which compresses margins. The reliance on sports data providers for real-time data feeds is critical, but also a significant cost. Maintaining betting integrity monitoring is paramount to consumer trust, especially with the rise of peer-to-peer betting. Operators deploy sophisticated risk management algorithms and track user engagement metrics to optimize performance.
- To differentiate, firms are exploring in-stadium betting solutions and using AI in sports betting for data-driven personalization and personalized betting recommendations. However, aggressive betting sponsorships have led to public backlash and tighter regulations in some regions, impacting brand visibility. Operators now prioritize customer loyalty programs over bonuses, achieving a 20% improvement in retention over acquisition-focused models.
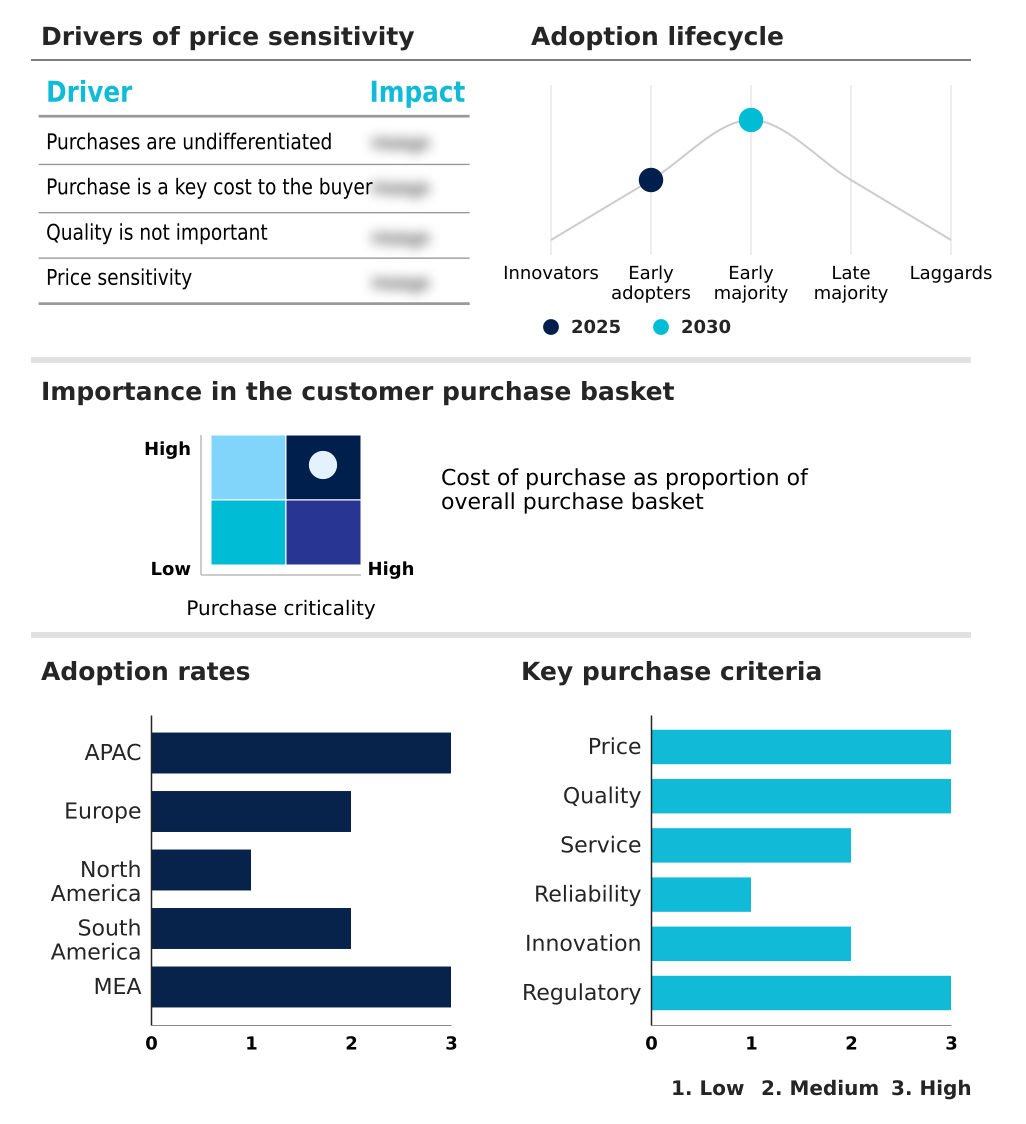
Exclusive Technavio Analysis on Customer Landscape
The sports betting market forecasting report includes the adoption lifecycle of the market, covering from the innovator’s stage to the laggard’s stage. It focuses on adoption rates in different regions based on penetration. Furthermore, the sports betting market report also includes key purchase criteria and drivers of price sensitivity to help companies evaluate and develop their market growth analysis strategies.
Customer Landscape of Sports Betting Industry
Competitive Landscape
Companies are implementing various strategies, such as strategic alliances, sports betting market forecast, partnerships, mergers and acquisitions, geographical expansion, and product/service launches, to enhance their presence in the industry.
Bet365 Group Ltd. - Delivering real-time engagement through comprehensive sports coverage, live odds, and dynamic in-play wagering, defining a key market position.
The industry research and growth report includes detailed analyses of the competitive landscape of the market and information about key companies, including:
- Bet365 Group Ltd.
- BetOnline
- Betsson AB
- Abudantia BV
- The Betway Group
- CASINO-INS
- Churchill Downs Inc.
- Dream Sports Group
- Entain Plc
- evoke plc
- FDJ UNITED
- Flutter Entertainment Plc
- LeoVegas AB
- Mobile Premier League
- Parimatch
- PENN Entertainment Inc.
- Sportech Plc
- SportsBetting.ag
- The Hong Kong Jockey Club
- Webis Holdings Plc
Qualitative and quantitative analysis of companies has been conducted to help clients understand the wider business environment as well as the strengths and weaknesses of key industry players. Data is qualitatively analyzed to categorize companies as pure play, category-focused, industry-focused, and diversified; it is quantitatively analyzed to categorize companies as dominant, leading, strong, tentative, and weak.
Recent Development and News in Sports betting market
- In March, 2025, Brazil's gaming regulatory body imposed a significant fine on a prominent European sports betting operator for violating new advertising guidelines prohibiting the use of active professional athletes in marketing campaigns.
- In April, 2025, the National Basketball Association announced a partnership with Genius Sports and Sportradar to develop and distribute an official data feed specifically designed for powering micro-betting markets.
- In June, 2025, Amazon announced that its Prime Video broadcasts of Thursday Night Football would feature a fully integrated betting overlay powered by DraftKings, allowing viewers in legal jurisdictions to place wagers on in-play markets.
- In August, 2025, Bet365 announced the global launch of its Guardian system, an in-house developed AI platform providing players with a personalized monthly risk rating and tailored protective tools.
Dive into Technavio’s robust research methodology, blending expert interviews, extensive data synthesis, and validated models for unparalleled Sports Betting Market insights. See full methodology.
| Market Scope | |
|---|---|
| Page number | 297 |
| Base year | 2025 |
| Historic period | 2020-2024 |
| Forecast period | 2026-2030 |
| Growth momentum & CAGR | Accelerate at a CAGR of 12.8% |
| Market growth 2026-2030 | USD 248697.0 million |
| Market structure | Fragmented |
| YoY growth 2025-2026(%) | 11.5% |
| Key countries | China, Japan, Australia, India, South Korea, Indonesia, UK, Germany, France, Italy, Spain, The Netherlands, US, Canada, Mexico, Brazil, Argentina, Chile, South Africa, Turkey, Israel, Saudi Arabia and UAE |
| Competitive landscape | Leading Companies, Market Positioning of Companies, Competitive Strategies, and Industry Risks |
Research Analyst Overview
- The sports betting market's evolution is defined by a technological arms race and a complex regulatory environment. At the core, sports data providers are crucial, delivering the real-time data feeds and low latency data feeds necessary for in-play wagering and micro-betting.
- Operators are building out their platforms with features like same-game parlays and the cash-out feature, alongside a wide array of player proposition bets to boost user engagement metrics and customer retention. The strategic shift toward an omni-channel approach integrates the retail sportsbook with mobile offerings.
- Boardroom decisions are increasingly focused on responsible gaming technology, employing AI-powered player monitoring and player risk profiling to meet stringent KYC compliance and affordability checks. In a maturing US market, for instance, one state reported a record annual betting handle, demonstrating the immense financial scale once a market stabilizes, underscoring the importance of balancing growth with sustainable, compliant operations.
What are the Key Data Covered in this Sports Betting Market Research and Growth Report?
-
What is the expected growth of the Sports Betting Market between 2026 and 2030?
-
USD 248.70 billion, at a CAGR of 12.8%
-
-
What segmentation does the market report cover?
-
The report is segmented by Platform (Online, and Offline), Type (Basketball, Horse riding, Football, and Others), Category (Live betting, Fixed odds wagering, Esports betting, and Exchange betting) and Geography (APAC, Europe, North America, South America, Middle East and Africa)
-
-
Which regions are analyzed in the report?
-
APAC, Europe, North America, South America and Middle East and Africa
-
-
What are the key growth drivers and market challenges?
-
Progressive frameworks and widespread market legalization, Navigating fragmented and evolving regulatory landscape
-
-
Who are the major players in the Sports Betting Market?
-
Bet365 Group Ltd., BetOnline, Betsson AB, Abudantia BV, The Betway Group, CASINO-INS, Churchill Downs Inc., Dream Sports Group, Entain Plc, evoke plc, FDJ UNITED, Flutter Entertainment Plc, LeoVegas AB, Mobile Premier League, Parimatch, PENN Entertainment Inc., Sportech Plc, SportsBetting.ag, The Hong Kong Jockey Club and Webis Holdings Plc
-
Market Research Insights
- The sports betting market is shaped by intense competitive dynamics and a shift toward sustainable profitability. In high-growth regions, customer acquisition costs have escalated, with some operators reporting an average spend exceeding $500 to acquire a single user.
- This has forced a strategic pivot from aggressive promotional spending to a focus on maximizing customer lifetime value through enhanced product offerings and loyalty programs. Concurrently, regulatory pressures are intensifying. In mature markets, new affordability checks and advertising restrictions have led operators to project potential revenue reductions of 5 to 10%.
- This environment requires sophisticated sports wagering technology and data analytics to navigate compliance, manage risk, and deliver a personalized, engaging cross-platform betting experience while maintaining profitability.
We can help! Our analysts can customize this sports betting market research report to meet your requirements.
 RIA -
RIA - 
