Equine Healthcare Market Analysis North America, Europe, Asia, Rest of World (ROW) - US, China, Mexico, UK, Germany - Size and Forecast 2024-2028

Equine Healthcare Market Analysis North America, Europe, Asia, Rest of World (ROW) - US, China, Mexico, UK, Germany - Size and Forecast 2024-2028

Published: Jun 2024 167 Pages SKU: IRTNTR75362

Market Overview at a Glance

$582.4 Mn
Market Opportunity
6.78%
CAGR
6.24
YoY growth 2023-2024(%)

Equine Healthcare Market Size 2024-2028 

The equine healthcare market size is forecast to increase by USD 582.4 million at a CAGR of 6.78% between 2023 and 2028.

  • The market is experiencing significant growth due to several key trends and factors. The rise in the incidence of zoonotic diseases, which can be transmitted from animals to humans, is a major concern driving market growth. Additionally, the adoption of new technologies, such as telemedicine and electronic health records, is revolutionizing the industry. 
  • However, high costs associated with equine healthcare remain a challenge in both veterinary telehealth and for horse owners. The implementation of advanced technologies and preventive measures to address the increasing incidence of zoonotic diseases is expected to provide significant opportunities for market growth. Alltech, a leading company, offers equine healthcare such as nutritional supplements and feed additives to support horse health, performance, and digestive health.

What will be the Size of the Equine Healthcare Market During the Forecast Period?

Equine Healthcare Market Size

 Request Free Sample

  • The market encompasses a range of products and services aimed at preventing and treating diseases in horses. Key diseases of concern include equine infectious anemia, rabies, West Nile fever, and Venezuelan equine encephalomyelitis. Equine industry participants, including equine veterinary practitioners, play a crucial role in managing these health issues. Technologies such as CT systems and vaccines are essential tools in equine healthcare, with vaccination programs a critical component of disease prevention.
  • Furthermore, the equine population's size and the need for skilled veterinarians continue to drive market growth. Animal health companies offer various products, including vaccines and health plans, to cater to the industry's needs. The market is subject to ongoing trends, including the development of advanced diagnostic tools and the integration of technology into veterinary practices.

How is this Equine Healthcare Industry segmented and which is the largest segment?

The equine healthcare industry research report provides comprehensive data (region-wise segment analysis), with forecasts and estimates in "USD million" for the period 2024-2028, as well as historical data from 2018-2022 for the following segments. 

  • Product
    • Pharmaceuticals
    • Vaccines
    • Others
  • Distribution Channel
    • Offline
    • Online
  • Indication
    • Musculoskeletal Disorders
    • Parasitic Infections
    • Equine Herpes Virus
    • Equine Viral Arteritis (EVA)
    • Equine Influenza
    • West Nile Virus
    • Tetanus
    • Others
  • Activity
    • Sports/Racing
    • Recreation
    • Others
  • Geography
    • North America
      • Mexico
      • US
    • Europe
      • Germany
      • UK
    • Asia
      • China
    • Rest of World (ROW)

By Product Insights

  • The pharmaceuticals segment is estimated to witness significant growth during the forecast period.

The market encompasses various sectors, with pharmaceuticals holding the largest share due to the demand for medications and therapies to prevent and treat equine diseases. Pharmaceutical offerings for horses cater to their unique physiological requirements and include anti-inflammatory drugs, antibiotics, dewormers, antiparasitic drugs, antifungal medications, pain relievers, hormonal therapies, and other formulations. Preventive medications are essential for maintaining equine health and preventing diseases, such as tetanus, rabies, equine influenza, equine herpes, equine infectious anemia, equine encephalomyelitis, and West Nile fever.

Furthermore, animal healthcare spending on equine pharmaceuticals also covers vaccines and medicinal feed additives for parasite control. Animal insurance, equine veterinary practitioners, equine care equipment, diagnostics, and e-commerce platforms further contribute to the market. Animal healthcare products and services are essential for horse farms, racing events, and recreational activities, ensuring the well-being of the equine population. Regenerative therapies, such as stem cell therapy, are emerging trends in the industry.

Equine Healthcare Market Size

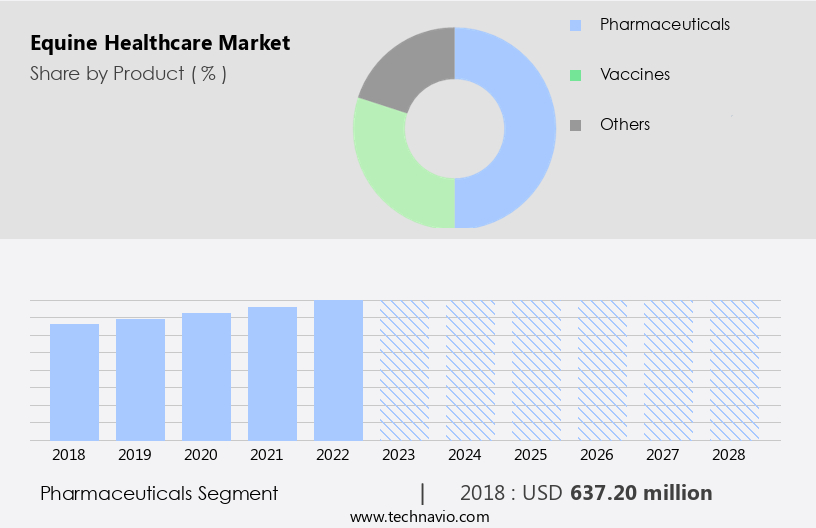
Get a glance at the  Equine Healthcare Industry report of share of various segments Request Free Sample

The pharmaceuticals segment was valued at USD 637.20 million in 2018 and showed a gradual increase during the forecast period.
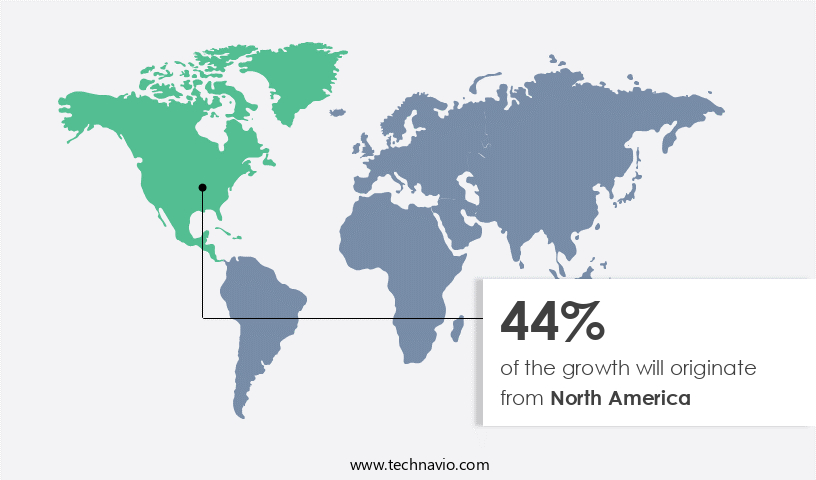
Regional Analysis

  • North America is estimated to contribute 44% to the growth of the global market during the forecast period.

Technavio's analysts have elaborately explained the regional trends and drivers that shape the market during the forecast period.

Equine Healthcare Market Share by Geography

For more insights on the market share of various regions, Request Free Sample

The market in North America, primarily driven by the US, is shaped by the presence of leading companies like Zoetis, committed to advancing equine health through innovative products. Government initiatives prioritizing animal health and regulations ensuring product safety contribute significantly to market growth. The US government oversees the safety and efficacy of biologics, feed additives, and pharmaceuticals for horses through two federal agencies. These measures safeguard the health and well-being of horses in the region.

Furthermore, key sectors include equine veterinary practitioners, horse farms, racing events, and recreational activities. Products encompass equine vaccines, analgesics, anti-inflammatory, parasiticides, and medicinal feed additives. Diseases such as equine influenza, tetanus, rabies, equine encephalomyelitis, Venezuelan equine encephalomyelitis, West Nile fever, and equine infectious anemia pose ongoing challenges. Innovations in diagnostics, CT systems, and regenerative therapies, including stem cell therapy, are addressing these challenges. E-commerce platforms facilitate the sale of products, enhancing accessibility.

Market Dynamics

Our market researchers analyzed the data with 2023 as the base year, along with the key drivers, trends, and challenges. A holistic analysis of drivers will help companies refine their marketing strategies to gain a competitive advantage.

What are the key market drivers leading to the rise in the adoption of Equine Healthcare Industry?

The rise in incidences of zoonotic diseases is the key driver of the market.

  • The market encompasses a range of products and services aimed at preventing and treating various diseases and conditions affecting horses. Animal healthcare spending in this sector includes expenditures on animal insurance, vaccines, analgesics, anti-inflammatory drugs, parasiticides, and medicinal feed additives. Equine diseases, such as Equine Influenza, Equine Herpes, Equine Encephalomyelitis, Venezuelan Equine Encephalomyelitis, West Nile Fever, Rabies, Tetanus, and Equine Infectious Anemia, pose significant challenges to the equine population. Equine healthcare products and services include diagnostics, such as CT systems and the EquiTrace platform, equine equipment, and regenerative therapies like stem cell therapy.
  • Furthermore, horse farms and racing events are major consumers of these products and services due to the large equine populations and high-value animals involved. Parasite control is an essential aspect, with parasiticides used to prevent and treat parasitic infestations. Skilled veterinarians play a crucial role, providing preventative care, diagnosing and treating diseases, and ensuring the overall well-being of horses. E-commerce platforms have made it easier for equine industry participants to access and purchase products, enabling convenient and efficient transactions. The equine industry continues to innovate, with developments in areas such as bio-thermo microchips and advanced diagnostic technologies contributing to improved outcomes.

What are the market trends shaping the Equine Healthcare Industry?

Adoption of new technologies is the upcoming market trend.

  • The market is experiencing significant growth due to increasing animal health spending and the adoption of advanced technologies. Animal healthcare, including equine care, is a critical sector with a substantial equine population requiring preventative measures and treatment for various diseases. Equine diseases such as Equine encephalomyelitis, Equine influenza, Equine herpes, Equine infectious anemia, Venezuelan equine encephalomyelitis, West Nile fever, Rabies, and Tetanus continue to pose challenges, necessitating the development of new vaccines, medicinal feed additives, parasiticides, and anti-inflammatory and analgesic drugs. Advancements in diagnostics, including CT systems and the EquiTrace platform, enable early detection and effective treatment. E-commerce platforms facilitate the sale of equine healthcare products, including anti-infectives and regenerative therapies like stem cell therapy.
  • Furthermore, horse farms and racing events are significant consumers of equine healthcare products and services. Animal insurance and equine veterinary practitioners play a crucial role in ensuring the well-being of horses. companies in the equine healthcare industry are investing in research and development to introduce innovative solutions. For instance, Arenus Animal Health is focusing on bio-thermo microchips for temperature monitoring and stem cell therapy. IDEXX Laboratories and Zoetis are expanding their diagnostic offerings with AI applications for dermatology and equine fecal analysis. These trends will drive The market during the forecast period.

What challenges does the Equine Healthcare Industry face during its growth?

High costs associated with equine healthcare are key challenges affecting the industry growth.

  • The market encompasses a range of products and services designed to maintain the health and wellbeing of horses. Animal healthcare spending in this sector is driven by various factors, including the need for analgesics, animal insurance, animal vaccines, anti-infectives, and anti-inflammatory medications. Horses are prone to several diseases, such as equine encephalomyelitis, equine influenza, equine herpes, tetanus, rabies, West Nile fever, and equine infectious anemia. To ensure effective diagnosis and treatment, equine veterinary practitioners utilize advanced diagnostic tools, such as CT systems and the EquiTrace platform. Equine care also involves parasite control through parasiticides and medicinal feed additives. In addition, regenerative therapies, including stem cell therapy, are gaining popularity in equine healthcare. The high costs associated with equine healthcare are a significant challenge for horse owners.
  • Furthermore, veterinary services, which include routine check-ups, vaccinations, and complex surgeries, require specialized expertise and advanced equipment, leading to higher fees. For instance, colic surgery can cost several thousand dollars, including pre-operative evaluations, anesthesia, surgical equipment, and post-operative care. Equine healthcare products, such as vaccines and medications, can also be expensive. For example, equine vaccination programs can cost several hundred dollars per horse annually. Additionally, specialized equine equipment, such as Bio Thermo microchips and Arenus animal health products, can be costly. E-commerce platforms have made it easier for horse owners to access equine healthcare products and services. Horse farms and racing events also play a crucial role in the equine healthcare industry by providing equine healthcare services and promoting preventative care programs. Overall, the market is dynamic, with ongoing research and development in areas such as diagnostics, pharmaceuticals, and equipment.

Exclusive Customer Landscape

The equine healthcare market forecasting report includes the adoption lifecycle of the market, covering from the innovator's stage to the laggard's stage. It focuses on adoption rates in different regions based on penetration. Furthermore, the equine healthcare market report also includes key purchase criteria and drivers of price sensitivity to help companies evaluate and develop their market growth analysis strategies.
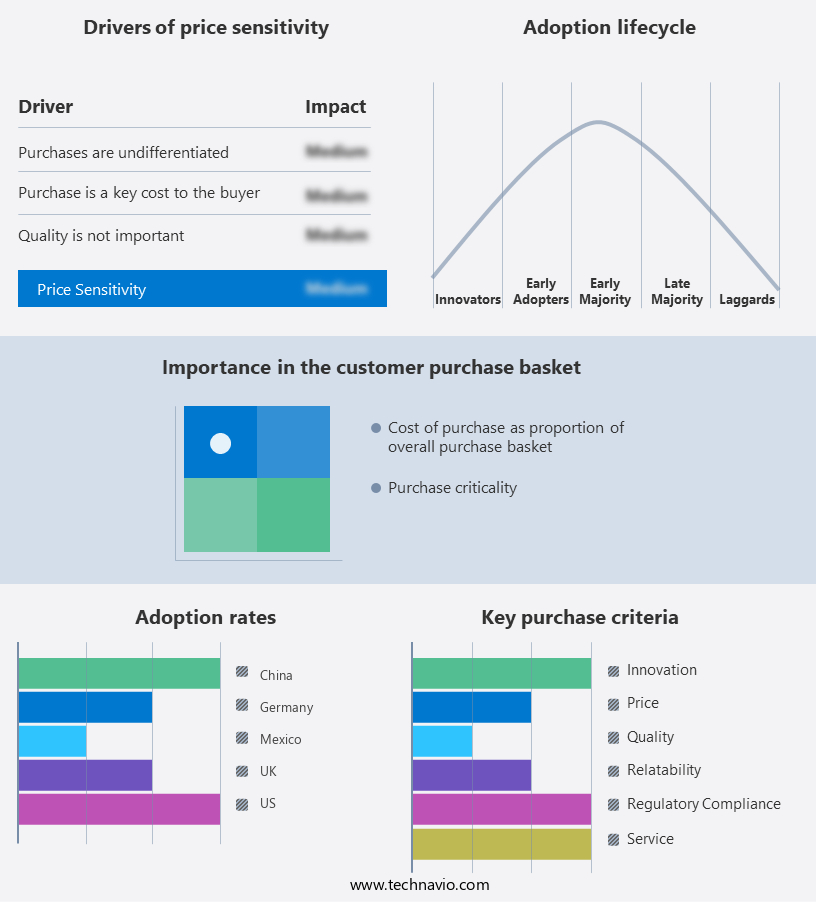
Equine Healthcare Market Share by Geography

 Customer Landscape

Key Companies & Market Insights

Companies are implementing various strategies, such as strategic alliances, equine healthcare market forecast, partnerships, mergers and acquisitions, geographical expansion, and product/service launches, to enhance their presence in the industry. The industry research and growth report includes detailed analyses of the competitive landscape of the market and information about key companies, including:

  • Alltech Inc.
  • Boehringer Ingelheim International GmbH
  • Central Garden and Pet Co.
  • Ceva Sante Animale
  • Dechra Pharmaceuticals Plc
  • Elanco Animal Health Inc.
  • Equine Products UK LTD.
  • Esaote Spa
  • Forte Healthcare Ltd.
  • Hallmarq Veterinary Imaging Ltd.
  • IDEXX LABORATORIES INC.
  • Jacks Inc.
  • Kemin Industries Inc.
  • Land O Lakes Inc.
  • Merck KGaA
  • Peak Equine Health
  • Scone Equine Group
  • Thermo Fisher Scientific Inc.
  • Vetoquinol SA
  • Zoetis Inc.

Qualitative and quantitative analysis of companies has been conducted to help clients understand the wider business environment as well as the strengths and weaknesses of key industry players. Data is qualitatively analyzed to categorize companies as pure play, category-focused, industry-focused, and diversified; it is quantitatively analyzed to categorize companies as dominant, leading, strong, tentative, and weak.

Research Analyst Overview

The market encompasses a range of products and services designed to promote the health and well-being of horses. This market is driven by several factors, including the increasing popularity of horses as companions, the growth of the equine industry, and the need to address various health challenges that horses face. One significant trend in the market is the rising demand for preventative care. Horse owners are increasingly recognizing the importance of regular veterinary check-ups, vaccinations, and parasite control measures to maintain the health of their animals. This has led to an increase in demand for vaccines, anti-inflammatory drugs, and other preventative healthcare products. Another trend in the market is the use of advanced diagnostic tools and technologies. Diagnostic tools such as CT systems and imaging technologies are becoming increasingly common in equine healthcare, allowing veterinarians to diagnose conditions more accurately and effectively. Additionally, e-commerce platforms and telemedicine services are making it easier for horse owners to access veterinary care and order healthcare products from the comfort of their own homes. The market is also witnessing the emergence of new technologies and treatments.

For instance, regenerative therapies such as stem cell therapy are gaining popularity for their ability to promote healing and improve the overall health of horses. Medication delivery systems, such as bio-thermo microchips, are also being developed to make medication administration more convenient and effective. Despite these trends, the market faces several challenges. One major challenge is the prevalence of various diseases that affect horses, such as equine encephalomyelitis, equine influenza, and equine herpes. These diseases can have significant economic and health consequences for horse owners and the equine industry as a whole.

Additionally, the high cost of equine healthcare and the need for skilled veterinarians are also major challenges for the market. In summary, the market is a dynamic and evolving industry that is driven by the need to promote the health and well-being of horses. Preventative care, advanced diagnostic tools, and new technologies are key trends in the market, while diseases and the high cost of healthcare remain significant challenges. Skilled veterinarians and equine industry participants play a crucial role in addressing these challenges and ensuring the health and well-being of horses.

Equine Healthcare Market Scope

Report Coverage

Details

Page number

167

Base year

2023

Historic period

2018-2022

Forecast period

2024-2028

Growth momentum & CAGR

Accelerate at a CAGR of 6.78%

Market growth 2024-2028

USD 582.4 million

Market structure

Fragmented

YoY growth 2023-2024(%)

6.24

Key countries

US, China, Mexico, UK, and Germany

Competitive landscape

Leading Companies, Market Positioning of Companies, Competitive Strategies, and Industry Risks

Request Free Sample

What are the Key Data Covered in this Equine Healthcare Market Research and Growth Report?

  • CAGR of the Equine Healthcare industry during the forecast period
  • Detailed information on factors that will drive the Equine Healthcare growth and forecasting between 2024 and 2028
  • Precise estimation of the size of the market and its contribution of the industry in focus to the parent market
  • Accurate predictions about upcoming growth and trends and changes in consumer behaviour
  • Growth of the market across North America, Europe, Asia, and Rest of World (ROW)
  • Thorough analysis of the market's competitive landscape and detailed information about companies
  • Comprehensive analysis of factors that will challenge the equine healthcare market growth of industry companies

We can help! Our analysts can customize this equine healthcare market research report to meet your requirements.

Get in touch

1 Executive Summary

  • 1.1 Market overview
    • Executive Summary - Chart on Market Overview
    • Executive Summary - Data Table on Market Overview
    • Executive Summary - Chart on Global Market Characteristics
    • Executive Summary - Chart on Market by Geography
    • Executive Summary - Chart on Market Segmentation by Product
    • Executive Summary - Chart on Market Segmentation by Distribution Channel
    • Executive Summary - Chart on Incremental Growth
    • Executive Summary - Data Table on Incremental Growth
    • Executive Summary - Chart on Company Market Positioning

2 Market Landscape

  • 2.1 Market ecosystem
    • Parent Market
    • Data Table on - Parent Market
  • 2.2 Market characteristics
    • Market characteristics analysis
  • 2.3 Value chain analysis
    • Value Chain Analysis

3 Market Sizing

  • 3.1 Market definition
    • Offerings of companies included in the market definition
  • 3.2 Market segment analysis
    • Market segments
  • 3.3 Market size 2023
    • 3.4 Market outlook: Forecast for 2023-2028
      • Chart on Global - Market size and forecast 2023-2028 ($ million)
      • Data Table on Global - Market size and forecast 2023-2028 ($ million)
      • Chart on Global Market: Year-over-year growth 2023-2028 (%)
      • Data Table on Global Market: Year-over-year growth 2023-2028 (%)

    4 Historic Market Size

    • 4.1 Global Equine Healthcare Market 2018 - 2022
      • Historic Market Size - Data Table on Global Equine Healthcare Market 2018 - 2022 ($ million)
    • 4.2 Product segment analysis 2018 - 2022
      • Historic Market Size - Product Segment 2018 - 2022 ($ million)
    • 4.3 Distribution Channel segment analysis 2018 - 2022
      • Historic Market Size - Distribution Channel Segment 2018 - 2022 ($ million)
    • 4.4 Geography segment analysis 2018 - 2022
      • Historic Market Size - Geography Segment 2018 - 2022 ($ million)
    • 4.5 Country segment analysis 2018 - 2022
      • Historic Market Size - Country Segment 2018 - 2022 ($ million)

    5 Five Forces Analysis

    • 5.1 Five forces summary
      • Five forces analysis - Comparison between 2023 and 2028
    • 5.2 Bargaining power of buyers
      • Bargaining power of buyers - Impact of key factors 2023 and 2028
    • 5.3 Bargaining power of suppliers
      • Bargaining power of suppliers - Impact of key factors in 2023 and 2028
    • 5.4 Threat of new entrants
      • Threat of new entrants - Impact of key factors in 2023 and 2028
    • 5.5 Threat of substitutes
      • Threat of substitutes - Impact of key factors in 2023 and 2028
    • 5.6 Threat of rivalry
      • Threat of rivalry - Impact of key factors in 2023 and 2028
    • 5.7 Market condition
      • Chart on Market condition - Five forces 2023 and 2028

    6 Market Segmentation by Product

    • 6.1 Market segments
      • Chart on Product - Market share 2023-2028 (%)
      • Data Table on Product - Market share 2023-2028 (%)
    • 6.2 Comparison by Product
      • Chart on Comparison by Product
      • Data Table on Comparison by Product
    • 6.3 Pharmaceuticals - Market size and forecast 2023-2028
      • Chart on Pharmaceuticals - Market size and forecast 2023-2028 ($ million)
      • Data Table on Pharmaceuticals - Market size and forecast 2023-2028 ($ million)
      • Chart on Pharmaceuticals - Year-over-year growth 2023-2028 (%)
      • Data Table on Pharmaceuticals - Year-over-year growth 2023-2028 (%)
    • 6.4 Vaccines - Market size and forecast 2023-2028
      • Chart on Vaccines - Market size and forecast 2023-2028 ($ million)
      • Data Table on Vaccines - Market size and forecast 2023-2028 ($ million)
      • Chart on Vaccines - Year-over-year growth 2023-2028 (%)
      • Data Table on Vaccines - Year-over-year growth 2023-2028 (%)
    • 6.5 Others - Market size and forecast 2023-2028
      • Chart on Others - Market size and forecast 2023-2028 ($ million)
      • Data Table on Others - Market size and forecast 2023-2028 ($ million)
      • Chart on Others - Year-over-year growth 2023-2028 (%)
      • Data Table on Others - Year-over-year growth 2023-2028 (%)
    • 6.6 Market opportunity by Product
      • Market opportunity by Product ($ million)
      • Data Table on Market opportunity by Product ($ million)

    7 Market Segmentation by Distribution Channel

    • 7.1 Market segments
      • Chart on Distribution Channel - Market share 2023-2028 (%)
      • Data Table on Distribution Channel - Market share 2023-2028 (%)
    • 7.2 Comparison by Distribution Channel
      • Chart on Comparison by Distribution Channel
      • Data Table on Comparison by Distribution Channel
    • 7.3 Offline - Market size and forecast 2023-2028
      • Chart on Offline - Market size and forecast 2023-2028 ($ million)
      • Data Table on Offline - Market size and forecast 2023-2028 ($ million)
      • Chart on Offline - Year-over-year growth 2023-2028 (%)
      • Data Table on Offline - Year-over-year growth 2023-2028 (%)
    • 7.4 Online - Market size and forecast 2023-2028
      • Chart on Online - Market size and forecast 2023-2028 ($ million)
      • Data Table on Online - Market size and forecast 2023-2028 ($ million)
      • Chart on Online - Year-over-year growth 2023-2028 (%)
      • Data Table on Online - Year-over-year growth 2023-2028 (%)
    • 7.5 Market opportunity by Distribution Channel
      • Market opportunity by Distribution Channel ($ million)
      • Data Table on Market opportunity by Distribution Channel ($ million)

    8 Market Segmentation by Indication

    • 8.1 Market segments
      • Chart on Indication - Market share (2023-2028) (%)
      • Data Table on Indication - Market share (2023-2028) (%)
      • Chart on Others - Market size and forecast (2023-2028) ($ million)
      • Data Table on Others - Market size and forecast (2023-2028) ($ million)
      • Chart on Others - Year-over-year growth (2023-2028) (%)
      • Data Table on Others - Year-over-year growth (2023-2028) (%)
    • 8.2 Comparison by Indication
      • Chart on Comparison by Indication
      • Data Table on Comparison by Indication
      • Market opportunity by $segment_name ($ million)
      • Data Table on Market opportunity by $segment_name ($ million)
    • 8.3 Musculoskeletal Disorders - Market size and forecast (2023-2028)
      • Chart on Musculoskeletal Disorders - Market size and forecast (2023-2028) ($ million)
      • Data Table on Musculoskeletal Disorders - Market size and forecast (2023-2028) ($ million)
      • Chart on Musculoskeletal Disorders - Year-over-year growth (2023-2028) (%)
      • Data Table on Musculoskeletal Disorders - Year-over-year growth (2023-2028) (%)
    • 8.4 Parasitic Infections - Market size and forecast (2023-2028)
      • Chart on Parasitic Infections - Market size and forecast (2023-2028) ($ million)
      • Data Table on Parasitic Infections - Market size and forecast (2023-2028) ($ million)
      • Chart on Parasitic Infections - Year-over-year growth (2023-2028) (%)
      • Data Table on Parasitic Infections - Year-over-year growth (2023-2028) (%)
    • 8.5 Equine Herpes Virus - Market size and forecast (2023-2028)
      • Chart on Equine Herpes Virus - Market size and forecast (2023-2028) ($ million)
      • Data Table on Equine Herpes Virus - Market size and forecast (2023-2028) ($ million)
      • Chart on Equine Herpes Virus - Year-over-year growth (2023-2028) (%)
      • Data Table on Equine Herpes Virus - Year-over-year growth (2023-2028) (%)
    • 8.6 Equine Viral Arteritis (EVA) - Market size and forecast (2023-2028)
      • Chart on Equine Viral Arteritis (EVA) - Market size and forecast (2023-2028) ($ million)
      • Data Table on Equine Viral Arteritis (EVA) - Market size and forecast (2023-2028) ($ million)
      • Chart on Equine Viral Arteritis (EVA) - Year-over-year growth (2023-2028) (%)
      • Data Table on Equine Viral Arteritis (EVA) - Year-over-year growth (2023-2028) (%)
    • 8.7 Equine Influenza - Market size and forecast (2023-2028)
      • Chart on Equine Influenza - Market size and forecast (2023-2028) ($ million)
      • Data Table on Equine Influenza - Market size and forecast (2023-2028) ($ million)
      • Chart on Equine Influenza - Year-over-year growth (2023-2028) (%)
      • Data Table on Equine Influenza - Year-over-year growth (2023-2028) (%)
    • 8.8 West Nile Virus - Market size and forecast (2023-2028)
      • Chart on West Nile Virus - Market size and forecast (2023-2028) ($ million)
      • Data Table on West Nile Virus - Market size and forecast (2023-2028) ($ million)
      • Chart on West Nile Virus - Year-over-year growth (2023-2028) (%)
      • Data Table on West Nile Virus - Year-over-year growth (2023-2028) (%)
    • 8.9 Tetanus - Market size and forecast (2023-2028)
      • Chart on Tetanus - Market size and forecast (2023-2028) ($ million)
      • Data Table on Tetanus - Market size and forecast (2023-2028) ($ million)
      • Chart on Tetanus - Year-over-year growth (2023-2028) (%)
      • Data Table on Tetanus - Year-over-year growth (2023-2028) (%)

    9 Market Segmentation by Activity

    • 9.1 Market segments
      • Chart on Activity - Market share (2023-2028) (%)
      • Data Table on Activity - Market share (2023-2028) (%)
    • 9.2 Comparison by Activity
      • Chart on Comparison by Activity
      • Data Table on Comparison by Activity
    • 9.3 Sports/Racing - Market size and forecast (2023-2028)
      • Chart on Sports/Racing - Market size and forecast (2023-2028) ($ million)
      • Data Table on Sports/Racing - Market size and forecast (2023-2028) ($ million)
      • Chart on Sports/Racing - Year-over-year growth (2023-2028) (%)
      • Data Table on Sports/Racing - Year-over-year growth (2023-2028) (%)
    • 9.4 Recreation - Market size and forecast (2023-2028)
      • Chart on Recreation - Market size and forecast (2023-2028) ($ million)
      • Data Table on Recreation - Market size and forecast (2023-2028) ($ million)
      • Chart on Recreation - Year-over-year growth (2023-2028) (%)
      • Data Table on Recreation - Year-over-year growth (2023-2028) (%)
    • 9.5 Others - Market size and forecast (2023-2028)
      • Chart on Others - Market size and forecast (2023-2028) ($ million)
      • Data Table on Others - Market size and forecast (2023-2028) ($ million)
      • Chart on Others - Year-over-year growth (2023-2028) (%)
      • Data Table on Others - Year-over-year growth (2023-2028) (%)
    • 9.6 Market opportunity by Activity
      • Market opportunity by $segment_name ($ million)
      • Data Table on Market opportunity by $segment_name ($ million)

    10 Customer Landscape

    • 10.1 Customer landscape overview
      • Analysis of price sensitivity, lifecycle, customer purchase basket, adoption rates, and purchase criteria

    11 Geographic Landscape

    • 11.1 Geographic segmentation
      • Chart on Market share by geography 2023-2028 (%)
      • Data Table on Market share by geography 2023-2028 (%)
    • 11.2 Geographic comparison
      • Chart on Geographic comparison
      • Data Table on Geographic comparison
    • 11.3 North America - Market size and forecast 2023-2028
      • Chart on North America - Market size and forecast 2023-2028 ($ million)
      • Data Table on North America - Market size and forecast 2023-2028 ($ million)
      • Chart on North America - Year-over-year growth 2023-2028 (%)
      • Data Table on North America - Year-over-year growth 2023-2028 (%)
    • 11.4 Europe - Market size and forecast 2023-2028
      • Chart on Europe - Market size and forecast 2023-2028 ($ million)
      • Data Table on Europe - Market size and forecast 2023-2028 ($ million)
      • Chart on Europe - Year-over-year growth 2023-2028 (%)
      • Data Table on Europe - Year-over-year growth 2023-2028 (%)
    • 11.5 Asia - Market size and forecast 2023-2028
      • Chart on Asia - Market size and forecast 2023-2028 ($ million)
      • Data Table on Asia - Market size and forecast 2023-2028 ($ million)
      • Chart on Asia - Year-over-year growth 2023-2028 (%)
      • Data Table on Asia - Year-over-year growth 2023-2028 (%)
    • 11.6 Rest of World (ROW) - Market size and forecast 2023-2028
      • Chart on Rest of World (ROW) - Market size and forecast 2023-2028 ($ million)
      • Data Table on Rest of World (ROW) - Market size and forecast 2023-2028 ($ million)
      • Chart on Rest of World (ROW) - Year-over-year growth 2023-2028 (%)
      • Data Table on Rest of World (ROW) - Year-over-year growth 2023-2028 (%)
    • 11.7 US - Market size and forecast 2023-2028
      • Chart on US - Market size and forecast 2023-2028 ($ million)
      • Data Table on US - Market size and forecast 2023-2028 ($ million)
      • Chart on US - Year-over-year growth 2023-2028 (%)
      • Data Table on US - Year-over-year growth 2023-2028 (%)
    • 11.8 China - Market size and forecast 2023-2028
      • Chart on China - Market size and forecast 2023-2028 ($ million)
      • Data Table on China - Market size and forecast 2023-2028 ($ million)
      • Chart on China - Year-over-year growth 2023-2028 (%)
      • Data Table on China - Year-over-year growth 2023-2028 (%)
    • 11.9 Mexico - Market size and forecast 2023-2028
      • Chart on Mexico - Market size and forecast 2023-2028 ($ million)
      • Data Table on Mexico - Market size and forecast 2023-2028 ($ million)
      • Chart on Mexico - Year-over-year growth 2023-2028 (%)
      • Data Table on Mexico - Year-over-year growth 2023-2028 (%)
    • 11.10 UK - Market size and forecast 2023-2028
      • Chart on UK - Market size and forecast 2023-2028 ($ million)
      • Data Table on UK - Market size and forecast 2023-2028 ($ million)
      • Chart on UK - Year-over-year growth 2023-2028 (%)
      • Data Table on UK - Year-over-year growth 2023-2028 (%)
    • 11.11 Germany - Market size and forecast 2023-2028
      • Chart on Germany - Market size and forecast 2023-2028 ($ million)
      • Data Table on Germany - Market size and forecast 2023-2028 ($ million)
      • Chart on Germany - Year-over-year growth 2023-2028 (%)
      • Data Table on Germany - Year-over-year growth 2023-2028 (%)
    • 11.12 Market opportunity by geography
      • Market opportunity by geography ($ million)
      • Data Tables on Market opportunity by geography ($ million)

    12 Drivers, Challenges, and Opportunity/Restraints

    • 12.1 Market drivers
      • 12.2 Market challenges
        • 12.3 Impact of drivers and challenges
          • Impact of drivers and challenges in 2023 and 2028
        • 12.4 Market opportunities/restraints

          13 Competitive Landscape

          • 13.1 Overview
            • 13.2 Competitive Landscape
              • Overview on criticality of inputs and factors of differentiation
            • 13.3 Landscape disruption
              • Overview on factors of disruption
            • 13.4 Industry risks
              • Impact of key risks on business

            14 Competitive Analysis

            • 14.1 Companies profiled
              • Companies covered
            • 14.2 Market positioning of companies
              • Matrix on companies position and classification
            • 14.3 Alltech Inc.
              • Alltech Inc. - Overview
              • Alltech Inc. - Product / Service
              • Alltech Inc. - Key news
              • Alltech Inc. - Key offerings
            • 14.4 Boehringer Ingelheim International GmbH
              • Boehringer Ingelheim International GmbH - Overview
              • Boehringer Ingelheim International GmbH - Product / Service
              • Boehringer Ingelheim International GmbH - Key news
              • Boehringer Ingelheim International GmbH - Key offerings
            • 14.5 Central Garden and Pet Co.
              • Central Garden and Pet Co. - Overview
              • Central Garden and Pet Co. - Business segments
              • Central Garden and Pet Co. - Key offerings
              • Central Garden and Pet Co. - Segment focus
            • 14.6 Ceva Sante Animale
              • Ceva Sante Animale - Overview
              • Ceva Sante Animale - Product / Service
              • Ceva Sante Animale - Key offerings
            • 14.7 Dechra Pharmaceuticals Plc
              • Dechra Pharmaceuticals Plc - Overview
              • Dechra Pharmaceuticals Plc - Business segments
              • Dechra Pharmaceuticals Plc - Key offerings
              • Dechra Pharmaceuticals Plc - Segment focus
            • 14.8 Esaote Spa
              • Esaote Spa - Overview
              • Esaote Spa - Product / Service
              • Esaote Spa - Key offerings
            • 14.9 Forte Healthcare Ltd.
              • Forte Healthcare Ltd. - Overview
              • Forte Healthcare Ltd. - Product / Service
              • Forte Healthcare Ltd. - Key offerings
            • 14.10 Hallmarq Veterinary Imaging Ltd.
              • Hallmarq Veterinary Imaging Ltd. - Overview
              • Hallmarq Veterinary Imaging Ltd. - Product / Service
              • Hallmarq Veterinary Imaging Ltd. - Key offerings
            • 14.11 IDEXX LABORATORIES INC.
              • IDEXX LABORATORIES INC. - Overview
              • IDEXX LABORATORIES INC. - Business segments
              • IDEXX LABORATORIES INC. - Key news
              • IDEXX LABORATORIES INC. - Key offerings
              • IDEXX LABORATORIES INC. - Segment focus
            • 14.12 Kemin Industries Inc.
              • Kemin Industries Inc. - Overview
              • Kemin Industries Inc. - Product / Service
              • Kemin Industries Inc. - Key news
              • Kemin Industries Inc. - Key offerings
            • 14.13 Land O Lakes Inc.
              • Land O Lakes Inc. - Overview
              • Land O Lakes Inc. - Product / Service
              • Land O Lakes Inc. - Key offerings
            • 14.14 Merck KGaA
              • Merck KGaA - Overview
              • Merck KGaA - Business segments
              • Merck KGaA - Key news
              • Merck KGaA - Key offerings
              • Merck KGaA - Segment focus
            • 14.15 Peak Equine Health
              • Peak Equine Health - Overview
              • Peak Equine Health - Product / Service
              • Peak Equine Health - Key offerings
            • 14.16 Vetoquinol SA
              • Vetoquinol SA - Overview
              • Vetoquinol SA - Business segments
              • Vetoquinol SA - Key offerings
              • Vetoquinol SA - Segment focus
            • 14.17 Zoetis Inc.
              • Zoetis Inc. - Overview
              • Zoetis Inc. - Business segments
              • Zoetis Inc. - Key news
              • Zoetis Inc. - Key offerings
              • Zoetis Inc. - Segment focus

            15 Appendix

            • 15.1 Scope of the report
              • 15.2 Inclusions and exclusions checklist
                • Inclusions checklist
                • Exclusions checklist
              • 15.3 Currency conversion rates for US$
                • Currency conversion rates for US$
              • 15.4 Research methodology
                • Research methodology
              • 15.5 Data procurement
                • Information sources
              • 15.6 Data validation
                • Data validation
              • 15.7 Validation techniques employed for market sizing
                • Validation techniques employed for market sizing
              • 15.8 Data synthesis
                • Data synthesis
              • 15.9 360 degree market analysis
                • 360 degree market analysis
              • 15.10 List of abbreviations
                • List of abbreviations

              Research Methodology

              Technavio presents a detailed picture of the market by way of study, synthesis, and summation of data from multiple sources. The analysts have presented the various facets of the market with a particular focus on identifying the key industry influencers. The data thus presented is comprehensive, reliable, and the result of extensive research, both primary and secondary.

              INFORMATION SOURCES

              Primary sources

              • Manufacturers and suppliers
              • Channel partners
              • Industry experts
              • Strategic decision makers

              Secondary sources

              • Industry journals and periodicals
              • Government data
              • Financial reports of key industry players
              • Historical data
              • Press releases

              DATA ANALYSIS

              Data Synthesis

              • Collation of data
              • Estimation of key figures
              • Analysis of derived insights

              Data Validation

              • Triangulation with data models
              • Reference against proprietary databases
              • Corroboration with industry experts

              REPORT WRITING

              Qualitative

              • Market drivers
              • Market challenges
              • Market trends
              • Five forces analysis

              Quantitative

              • Market size and forecast
              • Market segmentation
              • Geographical insights
              • Competitive landscape

              Interested in this report?

              Get your sample now to see our research methodology and insights!

              Download Now

              Frequently Asked Questions

              Equine Healthcare market growth will increase by $ 582.4 mn during 2024-2028.

              The Equine Healthcare market is expected to grow at a CAGR of 6.78% during 2024-2028.

              Equine Healthcare market is segmented by Product( Pharmaceuticals, Vaccines, Others) Distribution Channel( Offline, Online)

              Alltech Inc., Boehringer Ingelheim International GmbH, Central Garden and Pet Co., Ceva Sante Animale, Dechra Pharmaceuticals Plc, Elanco Animal Health Inc., Equine Products UK LTD., Esaote Spa, Forte Healthcare Ltd., Hallmarq Veterinary Imaging Ltd., IDEXX LABORATORIES INC., Jacks Inc., Kemin Industries Inc., Land O Lakes Inc., Merck KGaA, Peak Equine Health, Scone Equine Group, Thermo Fisher Scientific Inc., Vetoquinol SA, Zoetis Inc. are a few of the key vendors in the Equine Healthcare market.

              North America will register the highest growth rate of 44% among the other regions. Therefore, the Equine Healthcare market in North America is expected to garner significant business opportunities for the vendors during the forecast period.

              US, China, Mexico, UK, Germany

              • Rise in incidences of zoonotic diseasesZoonosis (zoonotic disease) is an infectious disease that is transmitted between species from animals to humans. These diseases may be spread by viruses is the driving factor this market.
              • bacteria is the driving factor this market.
              • parasites is the driving factor this market.
              • or fungi through direct contact is the driving factor this market.
              • indirect contact is the driving factor this market.
              • vector-borne such as mosquitoes is the driving factor this market.
              • and food-borne. For instance is the driving factor this market.
              • Hendra virus (HeV) is an infectious zoonosis disease that can be transmitted from horse to human. Children younger than five is the driving factor this market.
              • adults older than 65 is the driving factor this market.
              • and people with weakened immune systems are at a higher risk of severe illness from zoonotic diseases. It is mainly the rural poor people and a fraction of the urban poor who depend on livestock for food and income. The concept of preventive healthcare is gaining popularity across regions. It includes the periodic examination of animals such as horses to determine vaccinations is the driving factor this market.
              • nutrition is the driving factor this market.
              • dental care is the driving factor this market.
              • prophylaxis for various infections is the driving factor this market.
              • and risk factor assessment. Therefore is the driving factor this market.
              • the increased incidences of zoonotic diseases have increased the need for equine healthcare to avoid the spread of disease among animals and humans. Such factors will drive the growth of the market during the forecast period. is the driving factor this market.

              The Equine Healthcare market vendors should focus on grabbing business opportunities from the Pharmaceuticals segment as it accounted for the largest market share in the base year.