Horticulture Lighting Market Size 2025-2029
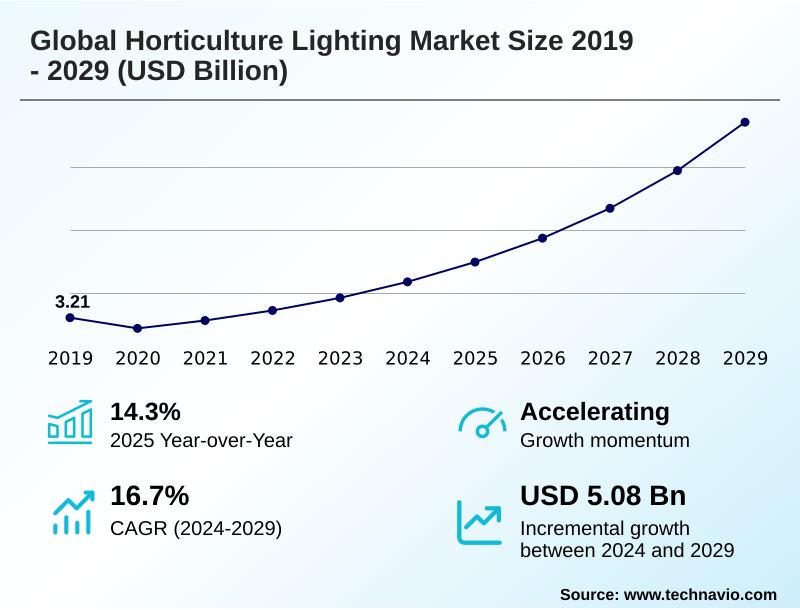
The horticulture lighting market size is valued to increase by USD 5.08 billion, at a CAGR of 16.7% from 2024 to 2029. Increasing adoption of controlled environment agriculture for global food security will drive the horticulture lighting market.
Major Market Trends & Insights
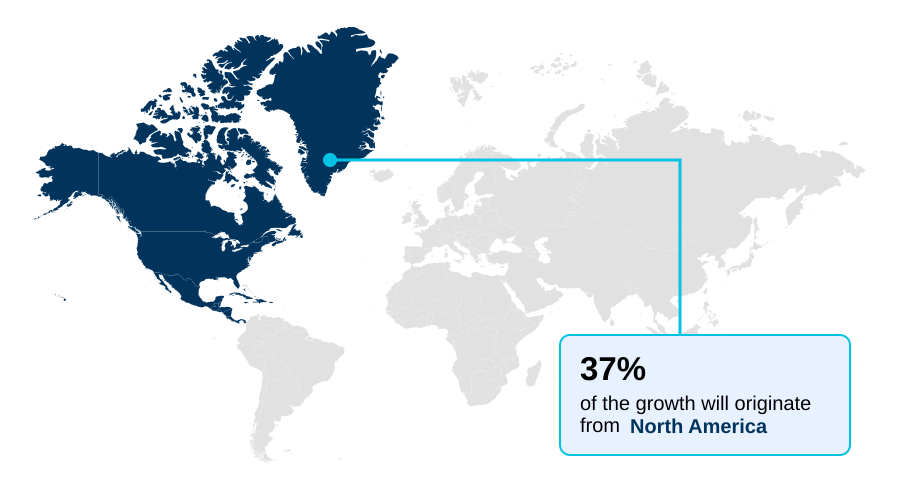
- North America dominated the market and accounted for a 36.6% growth during the forecast period.
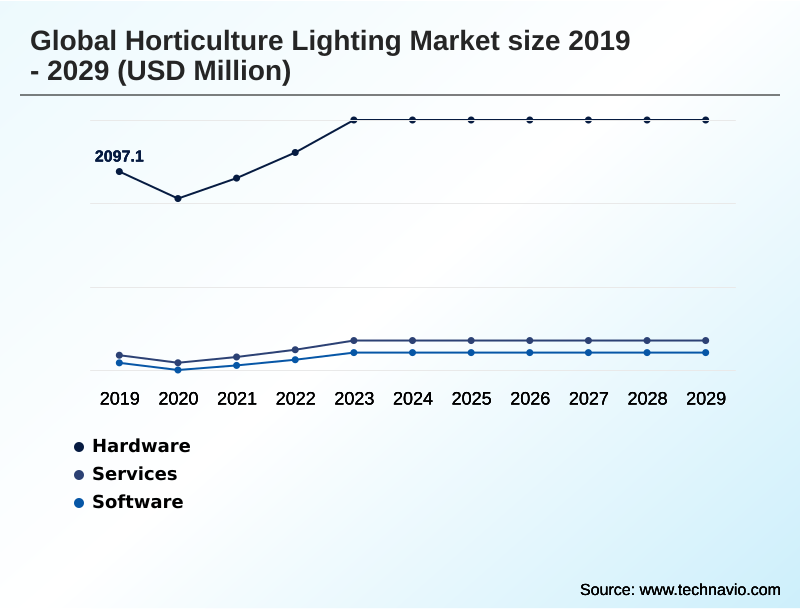
- By Component - Hardware segment was valued at USD 2.52 billion in 2023
- By Installation Type - Retrofit installation segment accounted for the largest market revenue share in 2023
Market Size & Forecast
- Market Opportunities: USD 6.22 billion
- Market Future Opportunities: USD 5.08 billion
- CAGR from 2024 to 2029 : 16.7%
Market Summary
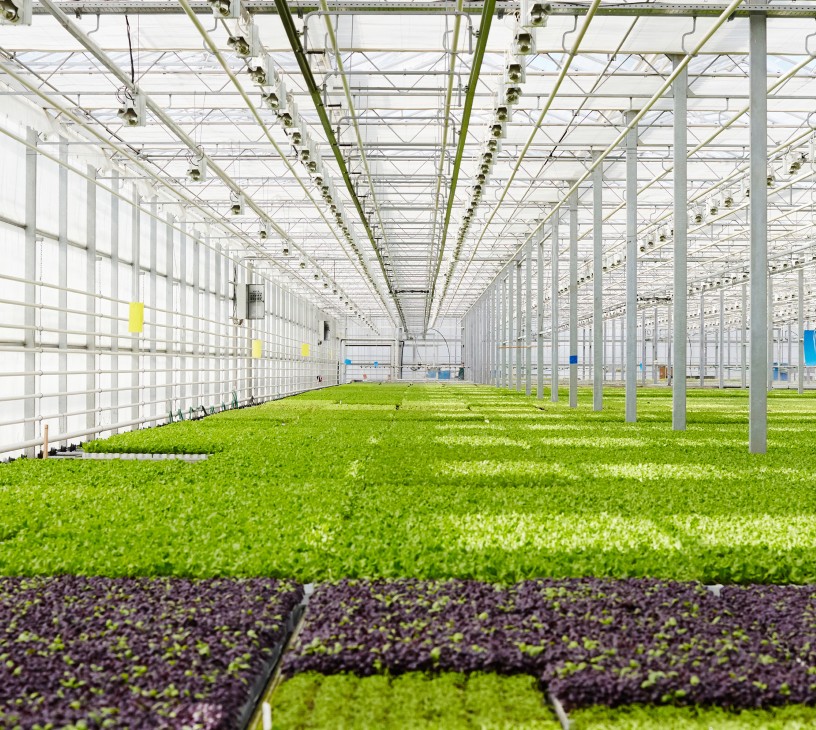
- The horticulture lighting market is undergoing a significant transformation, driven by the convergence of agricultural science and advanced technology. The primary catalyst is the global expansion of controlled environment agriculture (CEA), a necessary response to challenges like climate change, water scarcity, and the need for resilient food supply chains.
- Innovations in solid-state lighting (SSL) are central to this shift, with ongoing improvements in photosynthetic photon efficacy (ppe) and the development of sophisticated light recipe optimization. This allows growers to move beyond simple illumination to precisely steer plant development, influencing everything from yield to nutritional content.
- For instance, a commercial vertical farm can deploy dynamic spectrum control to enhance the coloration and shelf life of leafy greens, meeting specific retailer demands without chemical inputs. However, the high capital cost of advanced systems and the economic viability of end-user operations remain significant hurdles.
- The industry is also focused on developing application-specific hardware, such as inter-canopy lighting and specialized multi-bar fixture designs, to address the unique needs of different cultivation environments, from high-tech greenhouses to sole-source lighting systems in urban farms.
What will be the Size of the Horticulture Lighting Market during the forecast period?
Get Key Insights on Market Forecast (PDF) Get Free Sample
How is the Horticulture Lighting Market Segmented?
The horticulture lighting industry research report provides comprehensive data (region-wise segment analysis), with forecasts and estimates in "USD million" for the period 2025-2029, as well as historical data from 2019-2023 for the following segments.
- Component
- Hardware
- Services
- Software
- Installation type
- Retrofit installation
- New installation
- Application
- Greenhouse
- Vertical farms
- Indoor farms
- Research and tissue culture
- Others
- Geography
- North America
- US
- Canada
- Mexico
- Europe
- Germany
- UK
- The Netherlands
- APAC
- China
- Japan
- South Korea
- South America
- Brazil
- Colombia
- Argentina
- Middle East and Africa
- UAE
- Saudi Arabia
- South Africa
- Rest of World (ROW)
- North America
By Component Insights
The hardware segment is estimated to witness significant growth during the forecast period.
Hardware remains the foundational segment, encompassing all physical components from the light fixtures to drivers. Innovation centers on enhancing photosynthetic photon efficacy (ppe) through advanced luminaire optical design and superior thermal management systems.
The market is increasingly adopting solid-state lighting (ssl) and multi-bar fixture designs, specifically engineered for applications like vertical farming light systems and commercial greenhouse lighting.
A key focus is the development of one-for-one HPS replacement units that simplify retrofitting and minimize infrastructure costs for growers.
These advanced systems, integrating fixture-level sensing, are capable of improving light capture efficiency by up to 15% compared to legacy setups, forming the core of sustainable agriculture lighting and urban farming lighting technology.
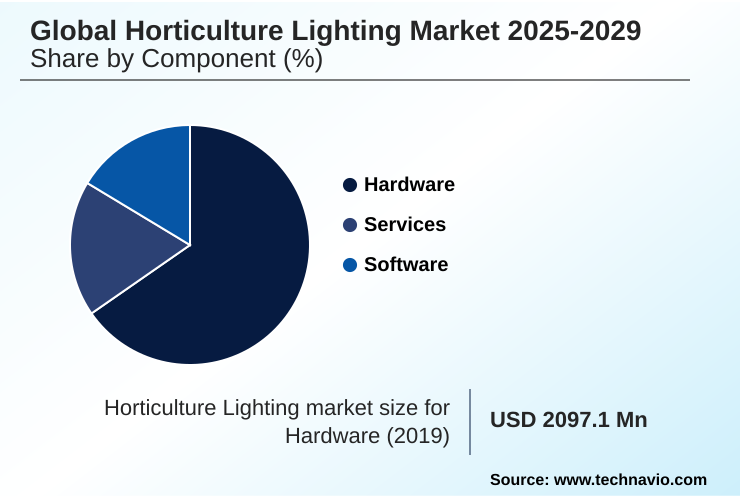
The Hardware segment was valued at USD 2.52 billion in 2023 and showed a gradual increase during the forecast period.
Regional Analysis
North America is estimated to contribute 36.6% to the growth of the global market during the forecast period.Technavio’s analysts have elaborately explained the regional trends and drivers that shape the market during the forecast period.
See How Horticulture Lighting Market Demand is Rising in North America Get Free Sample
The global geographic landscape is diverse, with North America leading in incremental growth, contributing to 36.6% of the market's expansion. This is driven by large-scale investments in controlled environment agriculture and the legalized cannabis cultivation lights market.
Europe, a mature market, prioritizes energy efficiency, accelerating the shift to next-generation grow lights. In APAC, countries are aggressively adopting sole-source lighting systems for food security, making it the fastest-growing region.
Innovations in horticultural lighting for research are prominent in developed regions, fostering new techniques in crop-specific spectral science.
These regional dynamics highlight a global shift toward high-performance horticulture leds and precision agriculture lighting to meet localized demands for food production and high-value crops.
Market Dynamics
Our researchers analyzed the data with 2024 as the base year, along with the key drivers, trends, and challenges. A holistic analysis of drivers will help companies refine their marketing strategies to gain a competitive advantage.
- Strategic decision-making in the horticulture lighting market increasingly relies on a detailed understanding of specific application outcomes. The debate over led vs hps for greenhouse tomato production is now nuanced by data on spectral efficiency and heat load reduction. Simultaneously, the impact of far-red spectrum on cannabis flowering is a key focus for cultivators aiming to maximize yield and quality.
- In vertical farms, optimizing daily light integral for lettuce is critical for achieving predictable, rapid growth cycles. For growers considering upgrades, a detailed roi calculation for horticulture led retrofit is essential, factoring in energy savings and potential yield increases. The benefits of dynamic spectrum control for leafy greens include enhanced coloration and nutritional value.
- Advanced operations explore specific spectral requirements for strawberry cultivation indoors and deploy inter-canopy lighting strategies for high-wire cucumbers to boost whole-plant photosynthesis. Even niche areas like the best lighting for tissue culture and micropropagation are seeing innovation. The choice between multi-bar vs monolithic led grow lights depends heavily on the specific crop and facility layout.
- Forward-looking facilities are now using ai for predictive light recipe management, with facilities implementing these strategies reporting up to a 25% improvement in resource allocation efficiency compared to those with static systems.
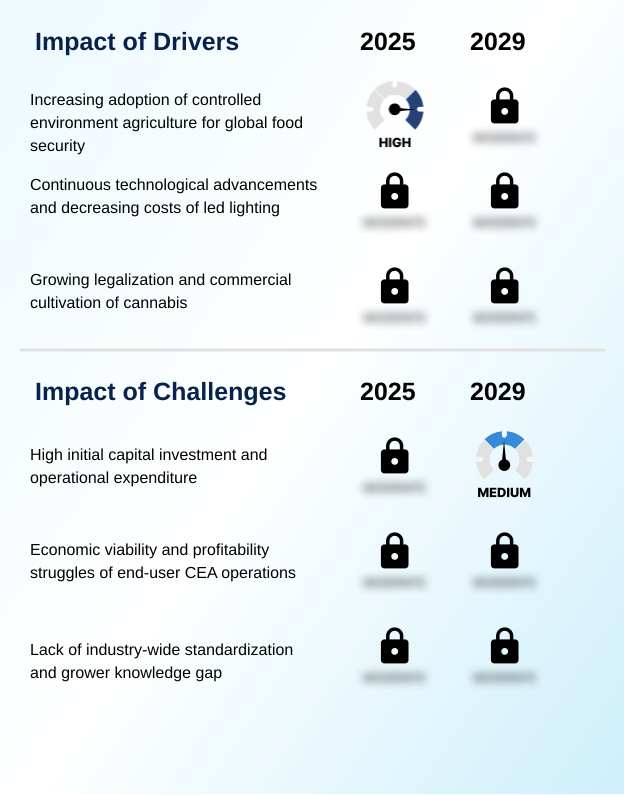
What are the key market drivers leading to the rise in the adoption of Horticulture Lighting Industry?
- The increasing adoption of controlled environment agriculture is a primary market driver, directly addressing global food security needs and supply chain resilience.
- The market's primary driver is the accelerating adoption of controlled environment agriculture (CEA) to ensure global food security. CEA facilities, which utilize up to 95% less water than traditional farming, depend on advanced horticulture lighting.
- The relentless pace of innovation in light-emitting diode (LED) technology is a powerful catalyst, as evidenced by dramatic increases in photosynthetic photon efficacy (ppe).
- This technological maturation, coupled with decreasing costs, makes LED systems an increasingly compelling investment, with some growers reporting energy cost reductions of 50% or more compared to legacy high-intensity discharge (hid) lamps.
- Furthermore, the progressive legalization of cannabis has created a high-value segment requiring high-output, full-spectrum led grow lights and precise ppfd levels for optimal yield, directly fueling demand for passive heat sink technology and other advanced components.
What are the market trends shaping the Horticulture Lighting Industry?
- The integration of smart controls, the Internet of Things (IoT), and artificial intelligence represents a defining trend. This evolution transforms lighting from standalone hardware into intelligent, networked systems.
- A defining trend is the shift from standalone hardware to intelligent, networked systems powered by automated lighting for greenhouses and indoor farms. The integration of advanced controls, IoT, and AI is enabling dynamic, data-driven lighting strategies that move far beyond simple scheduling.
- Smart control platforms, leveraging fixture-level sensing, allow for real-time adjustments to light intensity and spectrum based on environmental data, improving harvest predictability by over 25%. The application of AI for analyzing vast datasets on lighting inputs and crop outputs facilitates the autonomous optimization of light recipes.
- This continuous refinement can reduce manual system adjustments by 40%, enhancing both productivity and energy efficiency in indoor farming led solutions and commercial greenhouse applications. This evolution underscores the market's focus on micromoles per joule and overall system intelligence.
What challenges does the Horticulture Lighting Industry face during its growth?
- The high initial capital investment and ongoing operational expenditures present a key challenge that affects industry-wide growth and technology adoption rates.
- A significant challenge is the high initial capital investment, with lighting systems often representing 25-30% of a new CEA facility's total budget. This financial barrier, coupled with high electricity costs, affects the economic viability of custom spectrum led lighting operations. The profitability struggles of end-users, particularly in the competitive vertical farming sector, create market uncertainty for manufacturers of advanced lighting.
- The bankruptcy of even well-funded startups can slow investment in new facilities. Another hurdle is the lack of industry-wide standardization in performance reporting and a persistent knowledge gap among growers regarding light science.
- This complexity can deter the adoption of sophisticated systems, which could otherwise improve operational efficiency by more than 20% through precise control over factors like led driver efficiency.
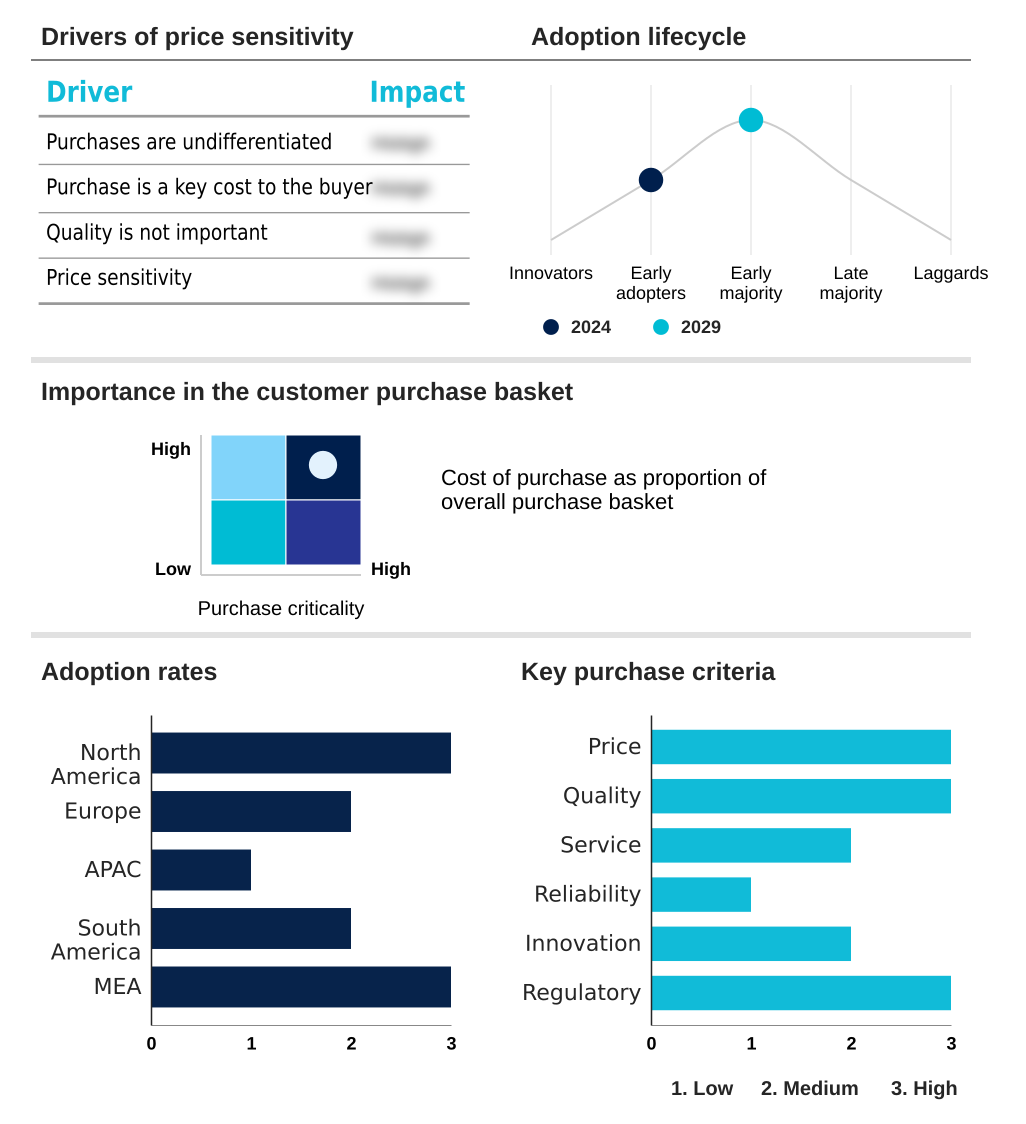
Exclusive Technavio Analysis on Customer Landscape
The horticulture lighting market forecasting report includes the adoption lifecycle of the market, covering from the innovator’s stage to the laggard’s stage. It focuses on adoption rates in different regions based on penetration. Furthermore, the horticulture lighting market report also includes key purchase criteria and drivers of price sensitivity to help companies evaluate and develop their market growth analysis strategies.
Customer Landscape of Horticulture Lighting Industry
Competitive Landscape
Companies are implementing various strategies, such as strategic alliances, horticulture lighting market forecast, partnerships, mergers and acquisitions, geographical expansion, and product/service launches, to enhance their presence in the industry.
Acuity Brands Inc. - Offerings include high-performance LED systems with dynamic spectrum control for greenhouse, vertical farming, and indoor cultivation, focusing on optimizing crop yield and quality.
The industry research and growth report includes detailed analyses of the competitive landscape of the market and information about key companies, including:
- Acuity Brands Inc.
- Bridgelux Inc.
- California LightWorks
- Cree LED
- Everlight Electronics Co. Ltd.
- Gavita International B.V.
- Growers Choice
- Heliospectra AB
- Horticulture Lighting Group
- Hortilux Schrede
- ILUMINAR Lighting LLC
- Lumileds Holding BV
- OSRAM GmbH
- Samsung Electronics Co. Ltd.
- Signify NV
- Valoya Oy
Qualitative and quantitative analysis of companies has been conducted to help clients understand the wider business environment as well as the strengths and weaknesses of key industry players. Data is qualitatively analyzed to categorize companies as pure play, category-focused, industry-focused, and diversified; it is quantitatively analyzed to categorize companies as dominant, leading, strong, tentative, and weak.
Recent Development and News in Horticulture lighting market
- In March 2025, Signify NV announced the launch of its new Philips GreenPower LED top-lighting series, delivering a reported 15% increase in photosynthetic photon efficacy over previous models, detailed in their Q1 product release statement.
- In January 2025, Acuity Brands Inc. completed its acquisition of a specialized agricultural IoT startup, aiming to integrate advanced sensor and control software into its horticulture lighting portfolio, according to an SEC filing.
- In November 2024, Samsung Electronics Co. Ltd. formed a strategic research partnership with a leading agricultural university to develop next-generation light recipes for vertical farming, with a goal of boosting nutritional content in leafy greens.
- In September 2024, Gavita International B.V. opened a new manufacturing and distribution center in North America to meet growing demand from the region's controlled environment agriculture sector, effectively doubling its production capacity.
Dive into Technavio’s robust research methodology, blending expert interviews, extensive data synthesis, and validated models for unparalleled Horticulture Lighting Market insights. See full methodology.
| Market Scope | |
|---|---|
| Page number | 295 |
| Base year | 2024 |
| Historic period | 2019-2023 |
| Forecast period | 2025-2029 |
| Growth momentum & CAGR | Accelerate at a CAGR of 16.7% |
| Market growth 2025-2029 | USD 5075.0 million |
| Market structure | Fragmented |
| YoY growth 2024-2025(%) | 14.3% |
| Key countries | US, Canada, Mexico, Germany, UK, The Netherlands, France, Italy, Spain, China, Japan, South Korea, India, Australia, Indonesia, Brazil, Colombia, Argentina, UAE, Saudi Arabia, South Africa, Israel and Turkey |
| Competitive landscape | Leading Companies, Market Positioning of Companies, Competitive Strategies, and Industry Risks |
Research Analyst Overview
- The horticulture lighting market is defined by rapid technological evolution, where performance metrics are paramount for boardroom-level investment decisions. The core technology, solid-state lighting (ssl), has matured significantly, with a primary focus on photosynthetic photon efficacy (ppe), which directly impacts operational expenditure. Optimized systems now achieve a ppe over 3.8 micromoles per joule, a 30% improvement over earlier LED models.
- Innovations in luminaire optical design and advanced thermal management systems ensure this efficiency is maintained. The development of quantum board technology and specialized phosphor-converted leds has enabled precise light recipe optimization and dynamic spectrum control. This allows for far-red light signaling to influence flowering and for the application of crop-specific spectral science.
- The market offers a range of hardware, from inter-canopy lighting to one-for-one hps replacement fixtures, each designed for specific controlled environment agriculture (cea) applications. The ability to manipulate photosynthetically active radiation (par) and daily light integral (dli) with such precision is transforming cultivation strategies and business models.
What are the Key Data Covered in this Horticulture Lighting Market Research and Growth Report?
-
What is the expected growth of the Horticulture Lighting Market between 2025 and 2029?
-
USD 5.08 billion, at a CAGR of 16.7%
-
-
What segmentation does the market report cover?
-
The report is segmented by Component (Hardware, Services, and Software), Installation Type (Retrofit installation, and New installation), Application (Greenhouse, Vertical farms, Indoor farms, Research and tissue culture, and Others) and Geography (North America, Europe, APAC, South America, Middle East and Africa)
-
-
Which regions are analyzed in the report?
-
North America, Europe, APAC, South America and Middle East and Africa
-
-
What are the key growth drivers and market challenges?
-
Increasing adoption of controlled environment agriculture for global food security, High initial capital investment and operational expenditure
-
-
Who are the major players in the Horticulture Lighting Market?
-
Acuity Brands Inc., Bridgelux Inc., California LightWorks, Cree LED, Everlight Electronics Co. Ltd., Gavita International B.V., Growers Choice, Heliospectra AB, Horticulture Lighting Group, Hortilux Schrede, ILUMINAR Lighting LLC, Lumileds Holding BV, OSRAM GmbH, Samsung Electronics Co. Ltd., Signify NV and Valoya Oy
-
Market Research Insights
- Market dynamics are shaped by a push toward higher efficiency and intelligent control. The adoption of smart lighting for agriculture, integrated with advanced horticulture lighting controls, allows facilities to achieve up to 20% faster crop cycles.
- Furthermore, the transition to energy-efficient grow lights from legacy systems can reduce direct energy consumption by more than 35%, a critical factor in the profitability of commercial-grade LED fixtures. The deployment of professional grow light systems, supported by integrated climate and lighting control, enhances operational oversight.
- This data-driven approach allows for precise environmental management, improving resource allocation and crop consistency across large-scale operations and demonstrating clear ROI for technology investment.
We can help! Our analysts can customize this horticulture lighting market research report to meet your requirements.
 RIA -
RIA - 
