Smart Lighting Market Analysis, Size, and Forecast 2026-2030: North America (US, Canada, and Mexico), Europe (Germany, UK, and France), APAC (China, India, and Japan), South America (Brazil and Argentina), Middle East and Africa (UAE, Saudi Arabia, and South Africa), and Rest of World (ROW)

Smart Lighting Market Analysis, Size, and Forecast 2026-2030:
North America (US, Canada, and Mexico), Europe (Germany, UK, and France), APAC (China, India, and Japan), South America (Brazil and Argentina), Middle East and Africa (UAE, Saudi Arabia, and South Africa), and Rest of World (ROW)

Published: Mar 2026 331 Pages SKU: IRTNTR43717

Market Overview at a Glance

$139.36 B
Market Opportunity
18.8%
CAGR 2025 - 2030
31.2%
North America Growth
$39.92 B
Software segment 2024

Smart Lighting Market Size 2026-2030

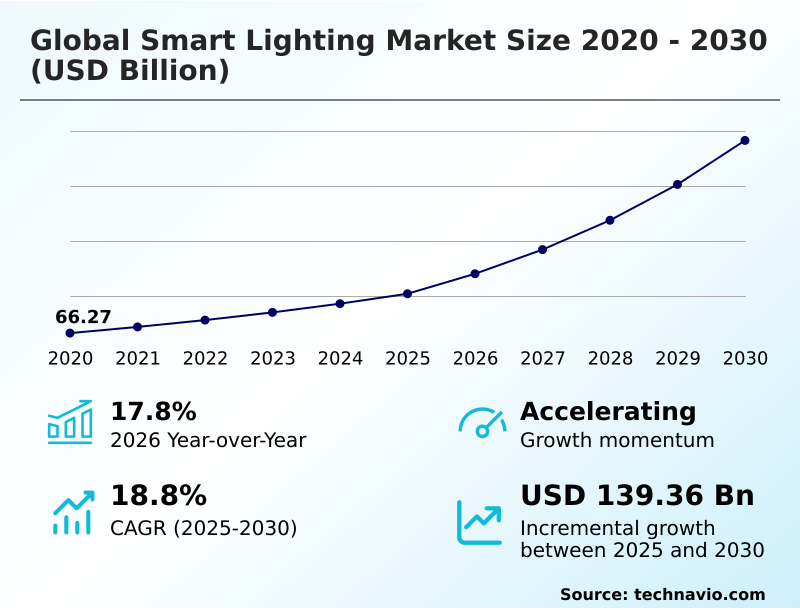
The smart lighting market size is valued to increase by USD 139.36 billion, at a CAGR of 18.8% from 2025 to 2030. Increasing emphasis on energy conservation and stringent governmental regulations will drive the smart lighting market.

Major Market Trends & Insights

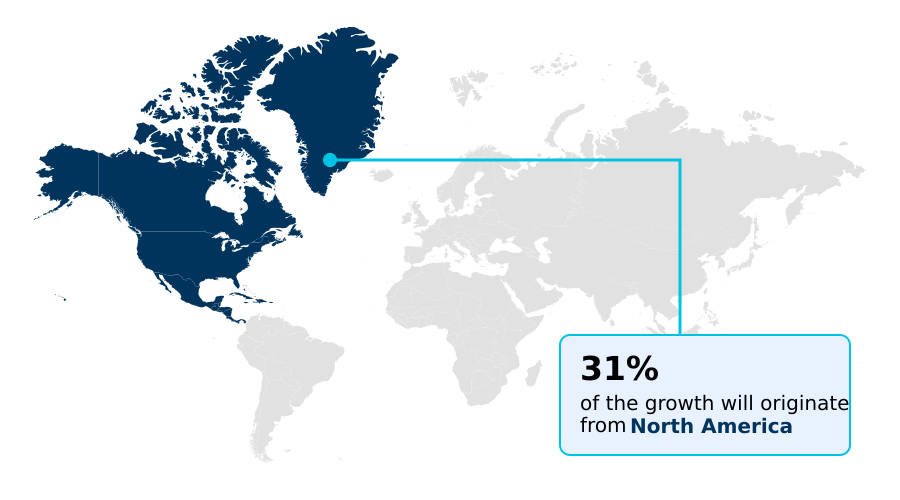
  • North America dominated the market and accounted for a 31.2% growth during the forecast period.
  • By Component - Software segment was valued at USD 39.92 billion in 2024
  • By Product - BMS segment accounted for the largest market revenue share in 2024

Market Size & Forecast

  • Market Opportunities: USD 175.15 billion
  • Market Future Opportunities: USD 139.36 billion
  • CAGR from 2025 to 2030 : 18.8%

Market Summary

  • The smart lighting market represents a significant technological shift, moving beyond basic illumination to become an integral component of the Internet of Things (IoT) ecosystem. This evolution is propelled by a global focus on energy efficiency, with intelligent controls and LED technology offering substantial operational cost reductions.
  • A primary trend shaping the industry is the adoption of human-centric lighting, which aims to enhance occupant well-being and productivity by adjusting light characteristics to support natural circadian rhythms. However, significant challenges persist, including the high initial investment cost and the pervasive market fragmentation caused by a lack of interoperability standards between different manufacturers' systems.
  • In a commercial facility management scenario, for instance, integrating data from lighting occupancy sensors with an HVAC system to dynamically manage climate control remains complex without unified protocols.
  • Overcoming these hurdles is crucial for the market to realize its full potential as a foundational platform for creating truly intelligent, responsive, and sustainable built environments that cater to both efficiency and human experience.

What will be the Size of the Smart Lighting Market during the forecast period?

Get Key Insights on Market Forecast (PDF) Request Free Sample

How is the Smart Lighting Market Segmented?

The smart lighting industry research report provides comprehensive data (region-wise segment analysis), with forecasts and estimates in "USD million" for the period 2026-2030, as well as historical data from 2020-2024 for the following segments.
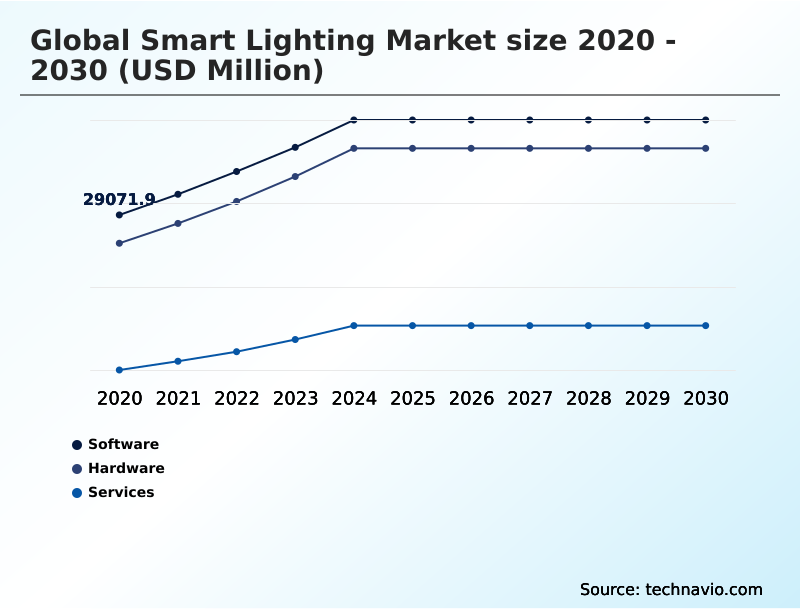
  • Component
    • Software
    • Hardware
    • Services
  • Product
    • BMS
    • HVAC
    • Lighting control
    • Security and access control
    • Others
  • Connectivity
    • Wireless
    • Wired
  • Geography
    • North America
      • US
      • Canada
      • Mexico
    • Europe
      • Germany
      • UK
      • France
    • APAC
      • China
      • India
      • Japan
    • South America
      • Brazil
      • Argentina
    • Middle East and Africa
      • UAE
      • Saudi Arabia
      • South Africa
    • Rest of World (ROW)

By Component Insights

The software segment is estimated to witness significant growth during the forecast period.

The software segment serves as the intelligent control layer, shifting from device-level firmware to sophisticated cloud-based management platforms. These systems translate user intent into commands, with innovation centered on open application programming interfaces (APIs) that foster a vibrant developer ecosystem.

The integration of predictive maintenance algorithms enables proactive servicing, reducing system downtime by up to 25%. A key area of development is mitigating cybersecurity vulnerabilities through robust security protocols and ensuring data privacy compliance for an enhanced user experience.

The rise of generative AI lighting effects and edge computing in lighting, supported by a flexible integrated systems architecture and continuous firmware over-the-air (FOTA) updates, is redefining system capabilities and supporting human-centric lighting implementation for agile workspace design.

Request Free Sample

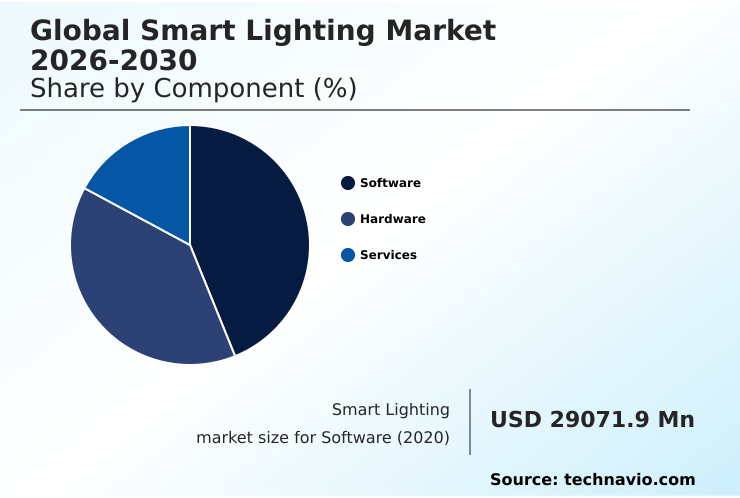
The Software segment was valued at USD 39.92 billion in 2024 and showed a gradual increase during the forecast period.

Request Free Sample

Regional Analysis

North America is estimated to contribute 31.2% to the growth of the global market during the forecast period.Technavio’s analysts have elaborately explained the regional trends and drivers that shape the market during the forecast period.

See How Smart Lighting Market Demand is Rising in North America Request Free Sample

The global smart lighting market 2026-2030 landscape is shaped by distinct regional drivers, with North America contributing 31% of incremental growth, Europe 30%, and APAC 28%.

In North America, the market is propelled by a strong demand-side pull for smart home ecosystem integration. Europe leads in regulatory-driven adoption, with stringent green building certification standards mandating advanced control systems.

APAC's growth is fueled by massive government-led smart city projects deploying intelligent street lighting, which can reduce municipal energy costs by over 60%.

Advanced applications like indoor positioning systems and asset tracking beacons are gaining traction globally, transforming connected building networks into platforms for creating a digital twin of building operations.

Technologies such as Power over Ethernet (PoE) and luminaire level lighting control (LLLC) are enabling this shift, supporting automated demand response and agile workspace design within a broader smart building IoT network.

Market Dynamics

Our researchers analyzed the data with 2025 as the base year, along with the key drivers, trends, and challenges. A holistic analysis of drivers will help companies refine their marketing strategies to gain a competitive advantage.

  • The strategic value of the global smart lighting market 2026-2030 is increasingly defined by its integration capabilities and specialized applications. Boardroom discussions now evaluate the impact of smart lighting on productivity, where studies show that implementing the benefits of human-centric lighting in offices can improve employee alertness.
  • A critical use case is integrating smart lighting with HVAC systems, which can more than double a building's overall energy savings compared to standalone system management. This synergy is a core component of optimizing building operations with smart lighting.
  • The debate over a wireless vs wired smart lighting comparison often centers on deployment flexibility versus network security, with Power over Ethernet lighting system advantages in reliability being weighed against the ease of retrofitting with wireless. Cybersecurity risks in connected lighting systems and data privacy concerns with smart lighting remain paramount, influencing technology choices.
  • Business models are also evolving, with the lighting as a service ROI calculation becoming a key factor for shifting from capital to operational spending. The role of smart lighting in sustainability goals is expanding beyond simple energy management, as seen in smart lighting for retail customer engagement, where dynamic illumination enhances the shopping experience.
  • For municipalities, smart street lighting benefits for cities include improved safety and a foundational network for IoT services. The emergence of unified standards like the Matter protocol affects smart lighting by simplifying integration. Advanced functionalities now include using smart lighting for asset tracking and deploying daylight harvesting sensors in commercial buildings, which are critical for effective energy management.
  • These systems, particularly smart lighting solutions for healthcare facilities, create tailored residential smart lighting automation scenes, directly influencing the smart lighting impact on circadian rhythm and paving the way for the future of generative AI in lighting design.

What are the key market drivers leading to the rise in the adoption of Smart Lighting Industry?

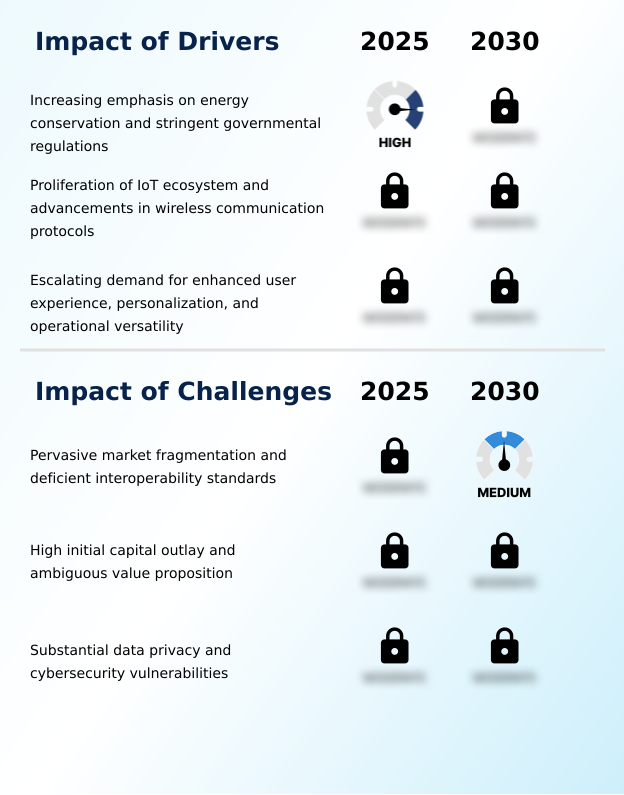
  • A primary driver for market expansion is the intensifying global emphasis on energy conservation, which is reinforced by stringent governmental regulations and sustainability mandates.

  • Market growth is fundamentally propelled by stringent energy conservation mandates and the rapid expansion of the integrated smart environment.
  • The widespread adoption of energy-efficient light emitting diodes (LED) and wireless communication protocols provides the foundation, while intelligent components like occupancy sensors and daylight harvesting sensors deliver significant operational savings.
  • A robust return on investment (ROI) analysis consistently shows that integrated building management systems can reduce energy costs by over 40% compared to conventional lighting.
  • This synergy, combined with the increasing demand for smart home ecosystem integration to meet corporate sustainability goals, drives adoption.
  • Furthermore, the capability for remote monitoring and control is a critical factor, enabling automated demand-response programs that enhance grid stability and further optimize energy use.

What are the market trends shaping the Smart Lighting Industry?

  • The ascendancy of human-centric lighting marks a significant market evolution, shifting the focus beyond simple illumination and energy efficiency. This trend prioritizes the influence of light on human health, productivity, and overall well-being.

  • Key trends are reshaping the market, moving beyond basic illumination toward enhancing human well-being and operational efficiency. The rise of the light as a service (LaaS) model, driven by a human-centric design approach, is converting capital costs into predictable operational expenditure (OpEx), making advanced systems more accessible.
  • This is closely tied to the adoption of human-centric lighting principles, which leverage tunable-white LED modules for circadian rhythm regulation to improve occupant comfort optimization. Such systems can enhance productivity by over 15%. This light as a service business model is crucial for effective building lifecycle management.
  • The use of space utilization analytics, another key trend, allows organizations to optimize their physical footprint, with some achieving a 20% improvement in space efficiency.

What challenges does the Smart Lighting Industry face during its growth?

  • Pervasive market fragmentation, caused by a lack of universally adopted communication protocols and interoperability standards, remains a significant challenge to accelerated market growth.

  • Persistent challenges hinder widespread adoption, primarily stemming from a lack of interoperability standards among competing wireless technologies like the zigbee protocol, bluetooth mesh networking, and z-wave standard. This fragmentation complicates facility management optimization and increases the total cost of ownership, as integrating disparate networked lighting controls often requires custom solutions.
  • The high initial capital expenditure (cap-ex) remains a significant barrier, particularly when the technology adoption rate is slowed by an unclear value proposition. This is amplified by the complexities of system-on-a-chip (soc) for lighting design and achieving a high color rendering index (CRI) with some budget options. Overcoming the demand-side pull for lower-cost, non-standardized products is essential for market maturation.

Exclusive Technavio Analysis on Customer Landscape

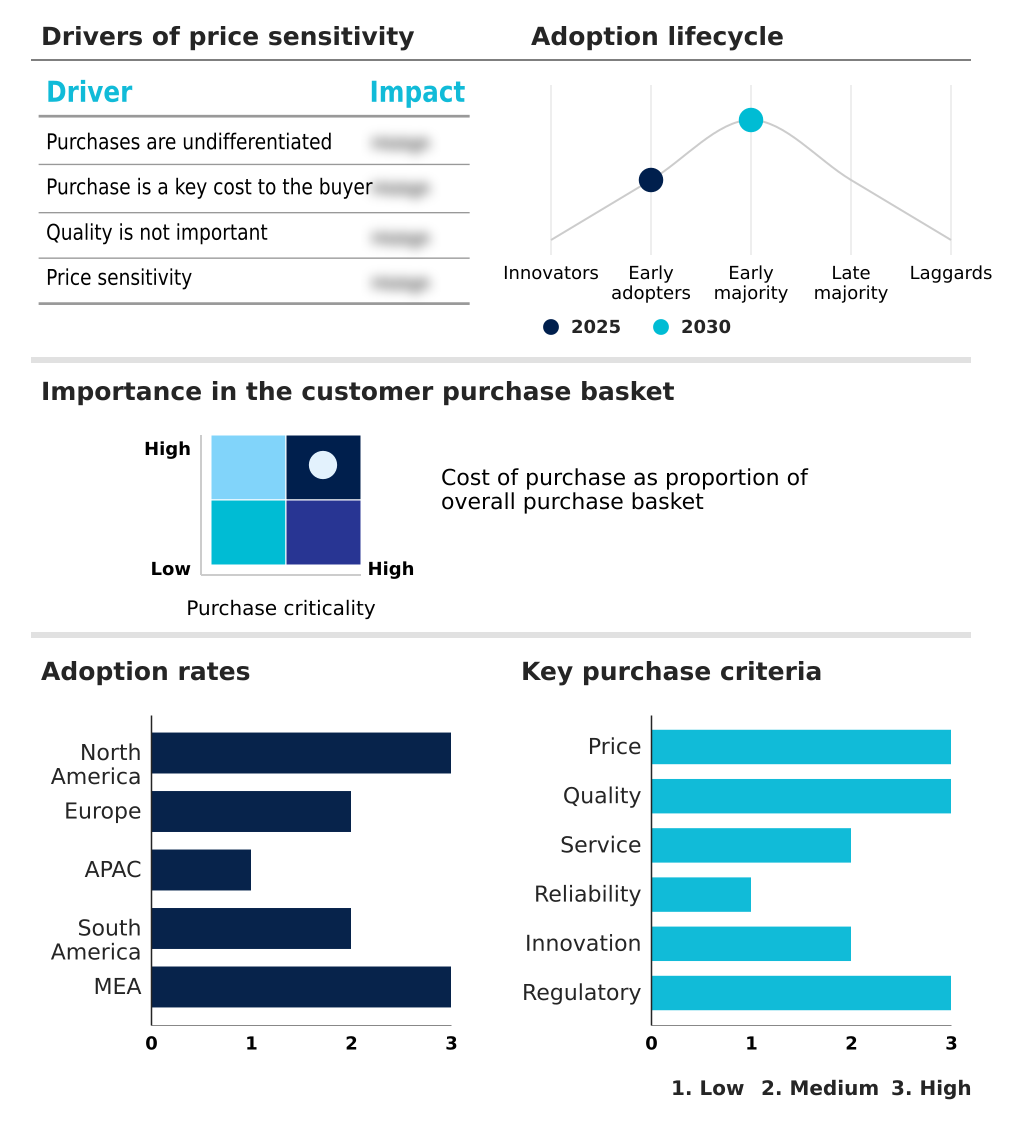
The smart lighting market forecasting report includes the adoption lifecycle of the market, covering from the innovator’s stage to the laggard’s stage. It focuses on adoption rates in different regions based on penetration. Furthermore, the smart lighting market report also includes key purchase criteria and drivers of price sensitivity to help companies evaluate and develop their market growth analysis strategies.

Customer Landscape of Smart Lighting Industry

Competitive Landscape

Companies are implementing various strategies, such as strategic alliances, smart lighting market forecast, partnerships, mergers and acquisitions, geographical expansion, and product/service launches, to enhance their presence in the industry.

Acuity Brands Inc. - Delivering integrated intelligent lighting systems and connected controls for commercial and residential applications, enhancing space functionality through advanced wireless and embedded solutions.

The industry research and growth report includes detailed analyses of the competitive landscape of the market and information about key companies, including:

  • Acuity Brands Inc.
  • ams OSRAM AG
  • Cree Lighting
  • Current Lighting Solutions LLC
  • Digital Lumens Inc.
  • Eaton Corp. Plc
  • Govee
  • Hubbell Inc.
  • Legrand SA
  • Leviton Manufacturing Co. Inc.
  • LIFX
  • Lutron Electronics Co. Inc.
  • Nanoleaf Canada Ltd.
  • RAB Lighting Inc.
  • Samsung Electronics Co. Ltd.
  • Shengdi Smart Technology Co. Ltd
  • Signify NV
  • TP Link Corp. Ltd.
  • YEELIGHT
  • Zumtobel Group AG

Qualitative and quantitative analysis of companies has been conducted to help clients understand the wider business environment as well as the strengths and weaknesses of key industry players. Data is qualitatively analyzed to categorize companies as pure play, category-focused, industry-focused, and diversified; it is quantitatively analyzed to categorize companies as dominant, leading, strong, tentative, and weak.

Recent Development and News in Smart lighting market

  • In January 2025, Philips Hue, a brand of Signify NV, introduced a generative AI lighting assistant at the Consumer Electronics Show, designed to create personalized lighting scenes via text or voice commands.
  • In January 2025, the Connectivity Standards Alliance updated its universal standard with the release of Matter 1.4, aimed at improving seamless interoperability between smart lighting devices from different manufacturers.
  • In May 2025, Brilliant launched its second-generation smart home control panels, offering higher-resolution screens and faster responsiveness for integrated management of lighting and other connected home systems.
  • In April 2025, Signify NV initiated a patent infringement lawsuit against Nanoleaf Canada Ltd., highlighting the increasing strategic importance of intellectual property in the competitive landscape.

Dive into Technavio’s robust research methodology, blending expert interviews, extensive data synthesis, and validated models for unparalleled Smart Lighting Market insights. See full methodology.

Market Scope
Page number 331
Base year 2025
Historic period 2020-2024
Forecast period 2026-2030
Growth momentum & CAGR Accelerate at a CAGR of 18.8%
Market growth 2026-2030 USD 139361.2 million
Market structure Fragmented
YoY growth 2025-2026(%) 17.8%
Key countries US, Canada, Mexico, Germany, UK, France, Italy, Spain, The Netherlands, China, India, Japan, South Korea, Australia, Indonesia, Brazil, Argentina, Chile, UAE, Saudi Arabia, South Africa, Egypt and Nigeria
Competitive landscape Leading Companies, Market Positioning of Companies, Competitive Strategies, and Industry Risks

Request Free Sample

Research Analyst Overview

  • The smart lighting market has evolved from a hardware-centric industry to a strategic enabler of intelligent building infrastructure, driven by advancements in light emitting diodes (LED) and networked lighting controls. The integration of occupancy sensors and daylight harvesting sensors is now standard for energy management, but the true value emerges from sophisticated system intelligence.
  • The implementation of a light as a service (LaaS) business model, supported by cloud-based management platforms, allows enterprises to adopt advanced solutions like human-centric lighting and circadian rhythm regulation without prohibitive upfront investment. For corporate boards, the decision to deploy tunable-white LED modules is no longer just a facilities upgrade but a strategic investment in talent retention and productivity.
  • For example, systems incorporating predictive maintenance algorithms demonstrate a clear operational benefit, reducing unscheduled service calls by over 30%. This shift positions lighting as a critical data-generating asset within integrated building management systems, essential for optimizing modern workspaces.

What are the Key Data Covered in this Smart Lighting Market Research and Growth Report?

  • What is the expected growth of the Smart Lighting Market between 2026 and 2030?

    • USD 139.36 billion, at a CAGR of 18.8%

  • What segmentation does the market report cover?

    • The report is segmented by Component (Software, Hardware, and Services), Product (BMS, HVAC, Lighting control, Security and access control, and Others), Connectivity (Wireless, and Wired) and Geography (North America, Europe, APAC, South America, Middle East and Africa)

  • Which regions are analyzed in the report?

    • North America, Europe, APAC, South America and Middle East and Africa

  • What are the key growth drivers and market challenges?

    • Increasing emphasis on energy conservation and stringent governmental regulations, Pervasive market fragmentation and deficient interoperability standards

  • Who are the major players in the Smart Lighting Market?

    • Acuity Brands Inc., ams OSRAM AG, Cree Lighting, Current Lighting Solutions LLC, Digital Lumens Inc., Eaton Corp. Plc, Govee, Hubbell Inc., Legrand SA, Leviton Manufacturing Co. Inc., LIFX, Lutron Electronics Co. Inc., Nanoleaf Canada Ltd., RAB Lighting Inc., Samsung Electronics Co. Ltd., Shengdi Smart Technology Co. Ltd, Signify NV, TP Link Corp. Ltd., YEELIGHT and Zumtobel Group AG

Market Research Insights

  • The market's momentum is increasingly defined by tangible business outcomes derived from an integrated smart environment and smart home ecosystem integration. Enterprises leveraging an integrated systems architecture are reporting that remote monitoring and control capabilities can reduce manual oversight costs by up to 30%.
  • Furthermore, the adoption of human-centric lighting implementation, guided by a human-centric design approach, is tied to productivity gains of over 10% in corporate settings. This shift from novelty to necessity is underscored by a compelling return on investment (ROI) analysis, with the total cost of ownership for connected systems being offset by significant energy savings and operational efficiencies.
  • These quantifiable benefits are aligning with corporate sustainability goals, making adoption a strategic priority for facility management optimization.

We can help! Our analysts can customize this smart lighting market research report to meet your requirements.

Get in touch

1. Executive Summary

1.1 Market overview

Executive Summary - Chart on Market Overview
Executive Summary - Data Table on Market Overview
Executive Summary - Chart on Global Market Characteristics
Executive Summary - Chart on Market by Geography
Executive Summary - Chart on Market Segmentation by Component
Executive Summary - Chart on Market Segmentation by Product
Executive Summary - Chart on Market Segmentation by Connectivity
Executive Summary - Chart on Incremental Growth
Executive Summary - Data Table on Incremental Growth
Executive Summary - Chart on Company Market Positioning

2. Technavio Analysis

2.1 Analysis of price sensitivity, lifecycle, customer purchase basket, adoption rates, and purchase criteria

2.2 Criticality of inputs and Factors of differentiation

Chart on Overview on criticality of inputs and factors of differentiation

2.3 Factors of disruption

Chart on Overview on factors of disruption

2.4 Impact of drivers and challenges

Chart on Impact of drivers and challenges in 2025 and 2030

3. Market Landscape

3.1 Market ecosystem

Chart on Parent Market
Data Table on - Parent Market

3.2 Market characteristics

Chart on Market characteristics analysis

3.3 Value chain analysis

Chart on Value chain analysis

4. Market Sizing

4.1 Market definition

Data Table on Offerings of companies included in the market definition

4.2 Market segment analysis

Market segments

4.3 Market size 2025

4.4 Market outlook: Forecast for 2025-2030

Chart on Global - Market size and forecast 2025-2030 ($ million)
Data Table on Global - Market size and forecast 2025-2030 ($ million)
Chart on Global Market: Year-over-year growth 2025-2030 (%)
Data Table on Global Market: Year-over-year growth 2025-2030 (%)

5. Historic Market Size

5.1 Global Smart Lighting Market 2020 - 2024

Historic Market Size - Data Table on Global Smart Lighting Market 2020 - 2024 ($ million)

5.2 Component segment analysis 2020 - 2024

Historic Market Size - Component Segment 2020 - 2024 ($ million)

5.3 Product segment analysis 2020 - 2024

Historic Market Size - Product Segment 2020 - 2024 ($ million)

5.4 Connectivity segment analysis 2020 - 2024

Historic Market Size - Connectivity Segment 2020 - 2024 ($ million)

5.5 Geography segment analysis 2020 - 2024

Historic Market Size - Geography Segment 2020 - 2024 ($ million)

5.6 Country segment analysis 2020 - 2024

Historic Market Size - Country Segment 2020 - 2024 ($ million)

6. Qualitative Analysis

6.1 Impact of AI on global smart lighting market

6.2 Impact of geopolitical conflicts on global smart lighting market

7. Five Forces Analysis

7.1 Five forces summary

Five forces analysis - Comparison between 2025 and 2030

7.2 Bargaining power of buyers

Bargaining power of buyers - Impact of key factors 2025 and 2030

7.3 Bargaining power of suppliers

Bargaining power of suppliers - Impact of key factors in 2025 and 2030

7.4 Threat of new entrants

Threat of new entrants - Impact of key factors in 2025 and 2030

7.5 Threat of substitutes

Threat of substitutes - Impact of key factors in 2025 and 2030

7.6 Threat of rivalry

Threat of rivalry - Impact of key factors in 2025 and 2030

7.7 Market condition

Chart on Market condition - Five forces 2025 and 2030

8. Market Segmentation by Component

8.1 Market segments

Chart on Component - Market share 2025-2030 (%)
Data Table on Component - Market share 2025-2030 (%)

8.2 Comparison by Component

Chart on Comparison by Component
Data Table on Comparison by Component

8.3 Software - Market size and forecast 2025-2030

Chart on Software - Market size and forecast 2025-2030 ($ million)
Data Table on Software - Market size and forecast 2025-2030 ($ million)
Chart on Software - Year-over-year growth 2025-2030 (%)
Data Table on Software - Year-over-year growth 2025-2030 (%)

8.4 Hardware - Market size and forecast 2025-2030

Chart on Hardware - Market size and forecast 2025-2030 ($ million)
Data Table on Hardware - Market size and forecast 2025-2030 ($ million)
Chart on Hardware - Year-over-year growth 2025-2030 (%)
Data Table on Hardware - Year-over-year growth 2025-2030 (%)

8.5 Services - Market size and forecast 2025-2030

Chart on Services - Market size and forecast 2025-2030 ($ million)
Data Table on Services - Market size and forecast 2025-2030 ($ million)
Chart on Services - Year-over-year growth 2025-2030 (%)
Data Table on Services - Year-over-year growth 2025-2030 (%)

8.6 Market opportunity by Component

Market opportunity by Component ($ million)
Data Table on Market opportunity by Component ($ million)

9. Market Segmentation by Product

9.1 Market segments

Chart on Product - Market share 2025-2030 (%)
Data Table on Product - Market share 2025-2030 (%)

9.2 Comparison by Product

Chart on Comparison by Product
Data Table on Comparison by Product

9.3 BMS - Market size and forecast 2025-2030

Chart on BMS - Market size and forecast 2025-2030 ($ million)
Data Table on BMS - Market size and forecast 2025-2030 ($ million)
Chart on BMS - Year-over-year growth 2025-2030 (%)
Data Table on BMS - Year-over-year growth 2025-2030 (%)

9.4 HVAC - Market size and forecast 2025-2030

Chart on HVAC - Market size and forecast 2025-2030 ($ million)
Data Table on HVAC - Market size and forecast 2025-2030 ($ million)
Chart on HVAC - Year-over-year growth 2025-2030 (%)
Data Table on HVAC - Year-over-year growth 2025-2030 (%)

9.5 Lighting control - Market size and forecast 2025-2030

Chart on Lighting control - Market size and forecast 2025-2030 ($ million)
Data Table on Lighting control - Market size and forecast 2025-2030 ($ million)
Chart on Lighting control - Year-over-year growth 2025-2030 (%)
Data Table on Lighting control - Year-over-year growth 2025-2030 (%)

9.6 Security and access control - Market size and forecast 2025-2030

Chart on Security and access control - Market size and forecast 2025-2030 ($ million)
Data Table on Security and access control - Market size and forecast 2025-2030 ($ million)
Chart on Security and access control - Year-over-year growth 2025-2030 (%)
Data Table on Security and access control - Year-over-year growth 2025-2030 (%)

9.7 Others - Market size and forecast 2025-2030

Chart on Others - Market size and forecast 2025-2030 ($ million)
Data Table on Others - Market size and forecast 2025-2030 ($ million)
Chart on Others - Year-over-year growth 2025-2030 (%)
Data Table on Others - Year-over-year growth 2025-2030 (%)

9.8 Market opportunity by Product

Market opportunity by Product ($ million)
Data Table on Market opportunity by Product ($ million)

10. Market Segmentation by Connectivity

10.1 Market segments

Chart on Connectivity - Market share 2025-2030 (%)
Data Table on Connectivity - Market share 2025-2030 (%)

10.2 Comparison by Connectivity

Chart on Comparison by Connectivity
Data Table on Comparison by Connectivity

10.3 Wireless - Market size and forecast 2025-2030

Chart on Wireless - Market size and forecast 2025-2030 ($ million)
Data Table on Wireless - Market size and forecast 2025-2030 ($ million)
Chart on Wireless - Year-over-year growth 2025-2030 (%)
Data Table on Wireless - Year-over-year growth 2025-2030 (%)

10.4 Wired - Market size and forecast 2025-2030

Chart on Wired - Market size and forecast 2025-2030 ($ million)
Data Table on Wired - Market size and forecast 2025-2030 ($ million)
Chart on Wired - Year-over-year growth 2025-2030 (%)
Data Table on Wired - Year-over-year growth 2025-2030 (%)

10.5 Market opportunity by Connectivity

Market opportunity by Connectivity ($ million)
Data Table on Market opportunity by Connectivity ($ million)

11. Customer Landscape

11.1 Customer landscape overview

Analysis of price sensitivity, lifecycle, customer purchase basket, adoption rates, and purchase criteria

12. Geographic Landscape

12.1 Geographic segmentation

Chart on Market share by geography 2025-2030 (%)
Data Table on Market share by geography 2025-2030 (%)

12.2 Geographic comparison

Chart on Geographic comparison
Data Table on Geographic comparison

12.3 North America - Market size and forecast 2025-2030

Chart on North America - Market size and forecast 2025-2030 ($ million)
Data Table on North America - Market size and forecast 2025-2030 ($ million)
Chart on North America - Year-over-year growth 2025-2030 (%)
Data Table on North America - Year-over-year growth 2025-2030 (%)
Chart on Regional Comparison - North America
Data Table on Regional Comparison - North America

12.3.1 US - Market size and forecast 2025-2030

Chart on US - Market size and forecast 2025-2030 ($ million)
Data Table on US - Market size and forecast 2025-2030 ($ million)
Chart on US - Year-over-year growth 2025-2030 (%)
Data Table on US - Year-over-year growth 2025-2030 (%)

12.3.2 Canada - Market size and forecast 2025-2030

Chart on Canada - Market size and forecast 2025-2030 ($ million)
Data Table on Canada - Market size and forecast 2025-2030 ($ million)
Chart on Canada - Year-over-year growth 2025-2030 (%)
Data Table on Canada - Year-over-year growth 2025-2030 (%)

12.3.3 Mexico - Market size and forecast 2025-2030

Chart on Mexico - Market size and forecast 2025-2030 ($ million)
Data Table on Mexico - Market size and forecast 2025-2030 ($ million)
Chart on Mexico - Year-over-year growth 2025-2030 (%)
Data Table on Mexico - Year-over-year growth 2025-2030 (%)

12.4 Europe - Market size and forecast 2025-2030

Chart on Europe - Market size and forecast 2025-2030 ($ million)
Data Table on Europe - Market size and forecast 2025-2030 ($ million)
Chart on Europe - Year-over-year growth 2025-2030 (%)
Data Table on Europe - Year-over-year growth 2025-2030 (%)
Chart on Regional Comparison - Europe
Data Table on Regional Comparison - Europe

12.4.1 Germany - Market size and forecast 2025-2030

Chart on Germany - Market size and forecast 2025-2030 ($ million)
Data Table on Germany - Market size and forecast 2025-2030 ($ million)
Chart on Germany - Year-over-year growth 2025-2030 (%)
Data Table on Germany - Year-over-year growth 2025-2030 (%)

12.4.2 UK - Market size and forecast 2025-2030

Chart on UK - Market size and forecast 2025-2030 ($ million)
Data Table on UK - Market size and forecast 2025-2030 ($ million)
Chart on UK - Year-over-year growth 2025-2030 (%)
Data Table on UK - Year-over-year growth 2025-2030 (%)

12.4.3 France - Market size and forecast 2025-2030

Chart on France - Market size and forecast 2025-2030 ($ million)
Data Table on France - Market size and forecast 2025-2030 ($ million)
Chart on France - Year-over-year growth 2025-2030 (%)
Data Table on France - Year-over-year growth 2025-2030 (%)

12.4.4 Italy - Market size and forecast 2025-2030

Chart on Italy - Market size and forecast 2025-2030 ($ million)
Data Table on Italy - Market size and forecast 2025-2030 ($ million)
Chart on Italy - Year-over-year growth 2025-2030 (%)
Data Table on Italy - Year-over-year growth 2025-2030 (%)

12.4.5 Spain - Market size and forecast 2025-2030

Chart on Spain - Market size and forecast 2025-2030 ($ million)
Data Table on Spain - Market size and forecast 2025-2030 ($ million)
Chart on Spain - Year-over-year growth 2025-2030 (%)
Data Table on Spain - Year-over-year growth 2025-2030 (%)

12.4.6 The Netherlands - Market size and forecast 2025-2030

Chart on The Netherlands - Market size and forecast 2025-2030 ($ million)
Data Table on The Netherlands - Market size and forecast 2025-2030 ($ million)
Chart on The Netherlands - Year-over-year growth 2025-2030 (%)
Data Table on The Netherlands - Year-over-year growth 2025-2030 (%)

12.5 APAC - Market size and forecast 2025-2030

Chart on APAC - Market size and forecast 2025-2030 ($ million)
Data Table on APAC - Market size and forecast 2025-2030 ($ million)
Chart on APAC - Year-over-year growth 2025-2030 (%)
Data Table on APAC - Year-over-year growth 2025-2030 (%)
Chart on Regional Comparison - APAC
Data Table on Regional Comparison - APAC

12.5.1 China - Market size and forecast 2025-2030

Chart on China - Market size and forecast 2025-2030 ($ million)
Data Table on China - Market size and forecast 2025-2030 ($ million)
Chart on China - Year-over-year growth 2025-2030 (%)
Data Table on China - Year-over-year growth 2025-2030 (%)

12.5.2 India - Market size and forecast 2025-2030

Chart on India - Market size and forecast 2025-2030 ($ million)
Data Table on India - Market size and forecast 2025-2030 ($ million)
Chart on India - Year-over-year growth 2025-2030 (%)
Data Table on India - Year-over-year growth 2025-2030 (%)

12.5.3 Japan - Market size and forecast 2025-2030

Chart on Japan - Market size and forecast 2025-2030 ($ million)
Data Table on Japan - Market size and forecast 2025-2030 ($ million)
Chart on Japan - Year-over-year growth 2025-2030 (%)
Data Table on Japan - Year-over-year growth 2025-2030 (%)

12.5.4 South Korea - Market size and forecast 2025-2030

Chart on South Korea - Market size and forecast 2025-2030 ($ million)
Data Table on South Korea - Market size and forecast 2025-2030 ($ million)
Chart on South Korea - Year-over-year growth 2025-2030 (%)
Data Table on South Korea - Year-over-year growth 2025-2030 (%)

12.5.5 Australia - Market size and forecast 2025-2030

Chart on Australia - Market size and forecast 2025-2030 ($ million)
Data Table on Australia - Market size and forecast 2025-2030 ($ million)
Chart on Australia - Year-over-year growth 2025-2030 (%)
Data Table on Australia - Year-over-year growth 2025-2030 (%)

12.5.6 Indonesia - Market size and forecast 2025-2030

Chart on Indonesia - Market size and forecast 2025-2030 ($ million)
Data Table on Indonesia - Market size and forecast 2025-2030 ($ million)
Chart on Indonesia - Year-over-year growth 2025-2030 (%)
Data Table on Indonesia - Year-over-year growth 2025-2030 (%)

12.6 South America - Market size and forecast 2025-2030

Chart on South America - Market size and forecast 2025-2030 ($ million)
Data Table on South America - Market size and forecast 2025-2030 ($ million)
Chart on South America - Year-over-year growth 2025-2030 (%)
Data Table on South America - Year-over-year growth 2025-2030 (%)
Chart on Regional Comparison - South America
Data Table on Regional Comparison - South America

12.6.1 Brazil - Market size and forecast 2025-2030

Chart on Brazil - Market size and forecast 2025-2030 ($ million)
Data Table on Brazil - Market size and forecast 2025-2030 ($ million)
Chart on Brazil - Year-over-year growth 2025-2030 (%)
Data Table on Brazil - Year-over-year growth 2025-2030 (%)

12.6.2 Argentina - Market size and forecast 2025-2030

Chart on Argentina - Market size and forecast 2025-2030 ($ million)
Data Table on Argentina - Market size and forecast 2025-2030 ($ million)
Chart on Argentina - Year-over-year growth 2025-2030 (%)
Data Table on Argentina - Year-over-year growth 2025-2030 (%)

12.6.3 Chile - Market size and forecast 2025-2030

Chart on Chile - Market size and forecast 2025-2030 ($ million)
Data Table on Chile - Market size and forecast 2025-2030 ($ million)
Chart on Chile - Year-over-year growth 2025-2030 (%)
Data Table on Chile - Year-over-year growth 2025-2030 (%)

12.7 Middle East and Africa - Market size and forecast 2025-2030

Chart on Middle East and Africa - Market size and forecast 2025-2030 ($ million)
Data Table on Middle East and Africa - Market size and forecast 2025-2030 ($ million)
Chart on Middle East and Africa - Year-over-year growth 2025-2030 (%)
Data Table on Middle East and Africa - Year-over-year growth 2025-2030 (%)
Chart on Regional Comparison - Middle East and Africa
Data Table on Regional Comparison - Middle East and Africa

12.7.1 UAE - Market size and forecast 2025-2030

Chart on UAE - Market size and forecast 2025-2030 ($ million)
Data Table on UAE - Market size and forecast 2025-2030 ($ million)
Chart on UAE - Year-over-year growth 2025-2030 (%)
Data Table on UAE - Year-over-year growth 2025-2030 (%)

12.7.2 Saudi Arabia - Market size and forecast 2025-2030

Chart on Saudi Arabia - Market size and forecast 2025-2030 ($ million)
Data Table on Saudi Arabia - Market size and forecast 2025-2030 ($ million)
Chart on Saudi Arabia - Year-over-year growth 2025-2030 (%)
Data Table on Saudi Arabia - Year-over-year growth 2025-2030 (%)

12.7.3 South Africa - Market size and forecast 2025-2030

Chart on South Africa - Market size and forecast 2025-2030 ($ million)
Data Table on South Africa - Market size and forecast 2025-2030 ($ million)
Chart on South Africa - Year-over-year growth 2025-2030 (%)
Data Table on South Africa - Year-over-year growth 2025-2030 (%)

12.7.4 Egypt - Market size and forecast 2025-2030

Chart on Egypt - Market size and forecast 2025-2030 ($ million)
Data Table on Egypt - Market size and forecast 2025-2030 ($ million)
Chart on Egypt - Year-over-year growth 2025-2030 (%)
Data Table on Egypt - Year-over-year growth 2025-2030 (%)

12.7.5 Nigeria - Market size and forecast 2025-2030

Chart on Nigeria - Market size and forecast 2025-2030 ($ million)
Data Table on Nigeria - Market size and forecast 2025-2030 ($ million)
Chart on Nigeria - Year-over-year growth 2025-2030 (%)
Data Table on Nigeria - Year-over-year growth 2025-2030 (%)

12.8 Market opportunity by geography

Market opportunity by geography ($ million)
Data Tables on Market opportunity by geography ($ million)

13. Drivers, Challenges, and Opportunity

13.1 Market drivers

Increasing emphasis on energy conservation and stringent governmental regulations
Proliferation of IoT ecosystem and advancements in wireless communication protocols
Escalating demand for enhanced user experience, personalization, and operational versatility

13.2 Market challenges

Pervasive market fragmentation and deficient interoperability standards
High initial capital outlay and ambiguous value proposition
Substantial data privacy and cybersecurity vulnerabilities

13.3 Impact of drivers and challenges

Impact of drivers and challenges in 2025 and 2030

13.4 Market opportunities

Ascendancy of human-centric lighting and focus on wellness
Deep integration with building automation and rise of lighting-powered IoT network
Proliferation of LaaS business models

14. Competitive Landscape

14.1 Overview

14.2

Overview on criticality of inputs and factors of differentiation

14.3 Landscape disruption

Overview on factors of disruption

14.4 Industry risks

Impact of key risks on business

15. Competitive Analysis

15.1 Companies profiled

Companies covered

15.2 Company ranking index

15.3 Market positioning of companies

Matrix on companies position and classification

15.4 Acuity Brands Inc.

Acuity Brands Inc. - Overview
Acuity Brands Inc. - Business segments
Acuity Brands Inc. - Key offerings
Acuity Brands Inc. - Segment focus
SWOT

15.5 ams OSRAM AG

ams OSRAM AG - Overview
ams OSRAM AG - Business segments
ams OSRAM AG - Key news
ams OSRAM AG - Key offerings
ams OSRAM AG - Segment focus
SWOT

15.6 Current Lighting Solutions LLC

Current Lighting Solutions LLC - Overview
Current Lighting Solutions LLC - Product / Service
Current Lighting Solutions LLC - Key offerings
SWOT

15.7 Digital Lumens Inc.

Digital Lumens Inc. - Overview
Digital Lumens Inc. - Product / Service
Digital Lumens Inc. - Key offerings
SWOT

15.8 Eaton Corp. Plc

Eaton Corp. Plc - Overview
Eaton Corp. Plc - Business segments
Eaton Corp. Plc - Key news
Eaton Corp. Plc - Key offerings
Eaton Corp. Plc - Segment focus
SWOT

15.9 Hubbell Inc.

Hubbell Inc. - Overview
Hubbell Inc. - Business segments
Hubbell Inc. - Key news
Hubbell Inc. - Key offerings
Hubbell Inc. - Segment focus
SWOT

15.10 Legrand SA

Legrand SA - Overview
Legrand SA - Business segments
Legrand SA - Key news
Legrand SA - Key offerings
Legrand SA - Segment focus
SWOT

15.11 Leviton Manufacturing Co. Inc.

Leviton Manufacturing Co. Inc. - Overview
Leviton Manufacturing Co. Inc. - Product / Service
Leviton Manufacturing Co. Inc. - Key offerings
SWOT

15.12 Lutron Electronics Co. Inc.

Lutron Electronics Co. Inc. - Overview
Lutron Electronics Co. Inc. - Product / Service
Lutron Electronics Co. Inc. - Key offerings
SWOT

15.13 Nanoleaf Canada Ltd.

Nanoleaf Canada Ltd. - Overview
Nanoleaf Canada Ltd. - Product / Service
Nanoleaf Canada Ltd. - Key offerings
SWOT

15.14 RAB Lighting Inc.

RAB Lighting Inc. - Overview
RAB Lighting Inc. - Product / Service
RAB Lighting Inc. - Key offerings
SWOT

15.15 Samsung Electronics Co. Ltd.

Samsung Electronics Co. Ltd. - Overview
Samsung Electronics Co. Ltd. - Business segments
Samsung Electronics Co. Ltd. - Key news
Samsung Electronics Co. Ltd. - Key offerings
Samsung Electronics Co. Ltd. - Segment focus
SWOT

15.16 Shengdi Smart Technology Co. Ltd

Shengdi Smart Technology Co. Ltd - Overview
Shengdi Smart Technology Co. Ltd - Product / Service
Shengdi Smart Technology Co. Ltd - Key offerings
SWOT

15.17 Signify NV

Signify NV - Overview
Signify NV - Business segments
Signify NV - Key news
Signify NV - Key offerings
Signify NV - Segment focus
SWOT

15.18 Zumtobel Group AG

Zumtobel Group AG - Overview
Zumtobel Group AG - Business segments
Zumtobel Group AG - Key offerings
Zumtobel Group AG - Segment focus
SWOT

16. Appendix

16.1 Scope of the report

Market definition
Objectives
Notes and caveats

16.2 Inclusions and exclusions checklist

Inclusions checklist
Exclusions checklist

16.3 Currency conversion rates for US$

16.4 Research methodology

16.5 Data procurement

Information sources

16.6 Data validation

16.7 Validation techniques employed for market sizing

16.8 Data synthesis

16.9 360 degree market analysis

16.10 List of abbreviations

Research Methodology

Technavio presents a detailed picture of the market by way of study, synthesis, and summation of data from multiple sources. The analysts have presented the various facets of the market with a particular focus on identifying the key industry influencers. The data thus presented is comprehensive, reliable, and the result of extensive research, both primary and secondary.

INFORMATION SOURCES

Primary sources

  • Manufacturers and suppliers
  • Channel partners
  • Industry experts
  • Strategic decision makers

Secondary sources

  • Industry journals and periodicals
  • Government data
  • Financial reports of key industry players
  • Historical data
  • Press releases

DATA ANALYSIS

Data Synthesis

  • Collation of data
  • Estimation of key figures
  • Analysis of derived insights

Data Validation

  • Triangulation with data models
  • Reference against proprietary databases
  • Corroboration with industry experts

REPORT WRITING

Qualitative

  • Market drivers
  • Market challenges
  • Market trends
  • Five forces analysis

Quantitative

  • Market size and forecast
  • Market segmentation
  • Geographical insights
  • Competitive landscape

Interested in this report?

Get your sample now to see our research methodology and insights!

Download Now

Frequently Asked Questions

Smart Lighting market growth will increase by USD 139361.2 million during 2026-2030.

The Smart Lighting market is expected to grow at a CAGR of 18.8% during 2026-2030.

Smart Lighting market is segmented by Component (Software, Hardware, Services) Product (BMS, HVAC, Lighting control, Security and access control, Others) Connectivity (Wireless, Wired)

Acuity Brands Inc., ams OSRAM AG, Cree Lighting, Current Lighting Solutions LLC, Digital Lumens Inc., Eaton Corp. Plc, Govee, Hubbell Inc., Legrand SA, Leviton Manufacturing Co. Inc., LIFX, Lutron Electronics Co. Inc., Nanoleaf Canada Ltd., RAB Lighting Inc., Samsung Electronics Co. Ltd., Shengdi Smart Technology Co. Ltd, Signify NV, TP Link Corp. Ltd., YEELIGHT, Zumtobel Group AG are a few of the key vendors in the Smart Lighting market.

North America will register the highest growth rate of 31.2% among the other regions. Therefore, the Smart Lighting market in North America is expected to garner significant business opportunities for the vendors during the forecast period.

US, Canada, Mexico, Germany, UK, France, Italy, Spain, The Netherlands, China, India, Japan, South Korea, Australia, Indonesia, Brazil, Argentina, Chile, UAE, Saudi Arabia, South Africa, Egypt, Nigeria

  • Increasing emphasis on energy conservation and stringent governmental regulations is the driving factor this market.

The Smart Lighting market vendors should focus on grabbing business opportunities from the Component segment as it accounted for the largest market share in the base year.
RIA - Research AI Assistant
Ask RIA