Hot Smoking Salmon Market Size 2025-2029
The hot smoking salmon market size is forecast to increase by USD 1.36 billion, at a CAGR of 5.1% between 2024 and 2029.
- The market is witnessing significant growth due to the increasing consumer preference for ready-to-eat (RTE) foods and minimally processed items. This trend is driven by the desire for convenience and the growing demand for clean-label products. However, the high price point of hot smoking salmon poses a significant challenge for market growth. Consumers seek affordable alternatives, and companies must find ways to reduce production costs without compromising quality. To capitalize on market opportunities, businesses must focus on innovation and product differentiation. Developing value-added products, such as flavored or smoked salmon varieties, can help attract price-sensitive consumers. Additionally, exploring sustainable production methods and supply chain optimization can help mitigate the cost challenge.
- In summary, the market is experiencing robust growth due to consumer preferences for RTE and clean-label products. However, the high price point remains a significant challenge, necessitating innovation, value-addition, and cost reduction strategies. Companies that effectively address these challenges can capitalize on the market's potential and maintain a competitive edge.
What will be the Size of the Hot Smoking Salmon Market during the forecast period?

Explore in-depth regional segment analysis with market size data - historical 2019-2023 and forecasts 2025-2029 - in the full report.
Request Free Sample
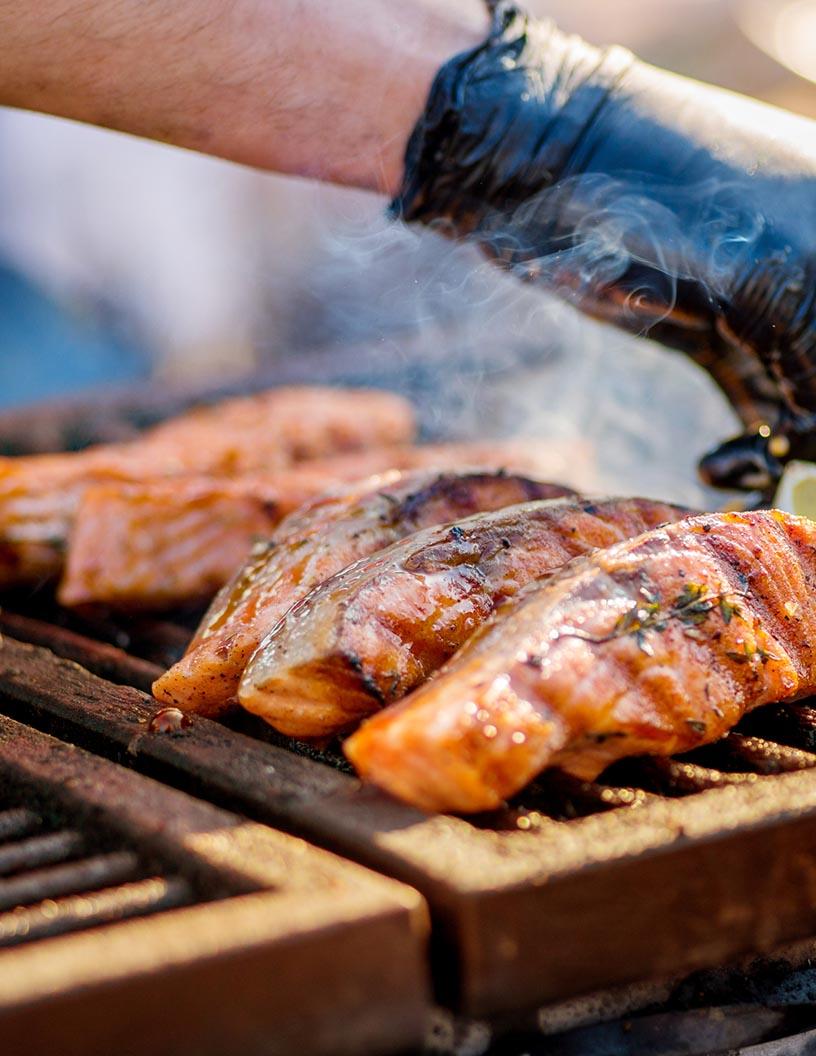
The market continues to evolve, driven by consumer preferences for flavorful, preservative-free smoked salmon. Omega-3 fatty acids, a key health benefit, fuel demand across various sectors. The supply chain adapts to meet consumer demands, with innovative smoking techniques such as cold smoking and organic production gaining traction. Chum salmon, once considered a by-product, is now embraced for its unique flavor profile. Salmon canapés and smoked salmon pate are popular value-added products, while salmon fillets and steaks remain staples. Fish processing advances with the integration of technology, including temperature control systems and refrigeration. Traceability systems ensure transparency and food safety, addressing consumer concerns.
Sustainability certifications and farming practices influence pricing strategies. Dietary trends favor wild-caught salmon, yet farmed salmon's affordability and consistent supply make it a viable option. Smoking techniques vary, from traditional methods using wood chips to modern smoking ovens. Salmon sushi and salmon burgers expand the market's reach. Product development focuses on catering to diverse consumer preferences, such as low-sodium and gluten-free options. The seafood market's dynamics continue to unfold, with ongoing innovation and adaptation shaping the future of hot smoking salmon.
How is this Hot Smoking Salmon Industry segmented?
The hot smoking salmon industry research report provides comprehensive data (region-wise segment analysis), with forecasts and estimates in "USD million" for the period 2025-2029, as well as historical data from 2019-2023 for the following segments.
- Distribution Channel
- End-user
- Packaging
- Vacuum packaging
- Canned packaging
- Type
- Hot Smoked Salmon Fillets
- Hot Smoked Salmon Portions
- Hot Smoked Salmon Sides
- Hot Smoked Salmon Flakes
- Species
- Atlantic Salmon
- Pacific Salmon (Coho, Sockeye, Chinook)
- Rainbow Trout (often smoked like salmon)
- Flavor/Seasoning
- Natural/Traditional
- Peppered
- Teriyaki
- Maple
- Herbed
- Geography
- North America
- Europe
- Middle East and Africa
- APAC
- South America
- Rest of World (ROW)
By Distribution Channel Insights
The offline segment is estimated to witness significant growth during the forecast period.
In the market, retail sales dominate the distribution landscape, with products sold through various retail formats including hypermarkets, supermarkets, convenience stores, clubhouse stores, and department stores. However, the shift to online shopping has led to a decline in revenue generation in the offline distribution channel. To counteract this trend, companies are expanding their presence in local and regional markets and implementing better pricing strategies and more comprehensive assortments. Atlantic salmon remains a popular choice due to its health benefits and desirable flavor profiles, with consumer preferences leaning towards wild-caught and sustainably certified options. Smoking ovens are used to preserve salmon through hot smoking techniques, enhancing its flavor and extending its shelf life.
Other salmon varieties, such as pink, coho, king, sockeye, and chum, are also gaining traction in the market. Product development focuses on value-added items like smoked salmon pate, salmon burgers, and salmon sushi, as well as organic and traceability-certified offerings. Seafood processing equipment and refrigeration systems are essential for maintaining food safety and temperature control throughout the supply chain. Dietary trends favoring omega-3 fatty acids and the increasing popularity of salmon caviar further boost market growth. The market dynamics are influenced by factors such as consumer demographics, supply chain efficiency, and food safety standards. Companies prioritize quality assurance and sensory analysis to ensure consistent product quality and meet evolving consumer preferences.

Request Free Sample
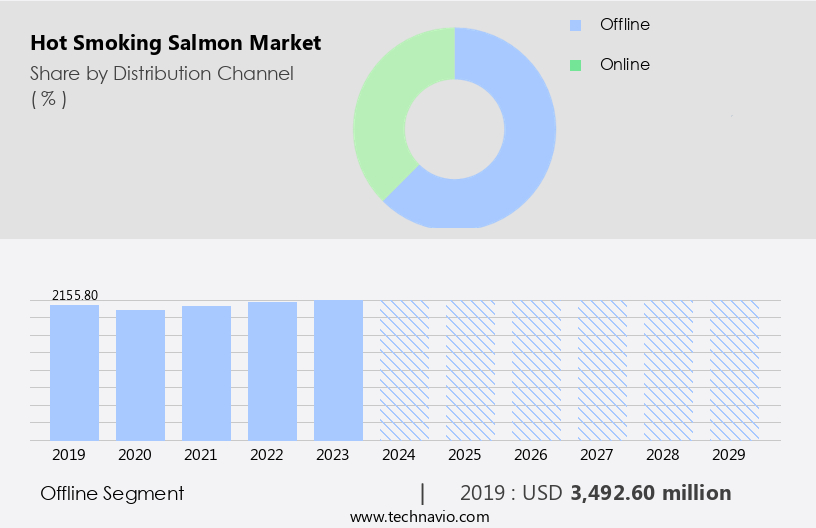
The Offline segment was valued at USD 3.49 billion in 2019 and showed a gradual increase during the forecast period.
Regional Analysis
Europe is estimated to contribute 42% to the growth of the global market during the forecast period.Technavio's analysts have elaborately explained the regional trends and drivers that shape the market during the forecast period.

Request Free Sample
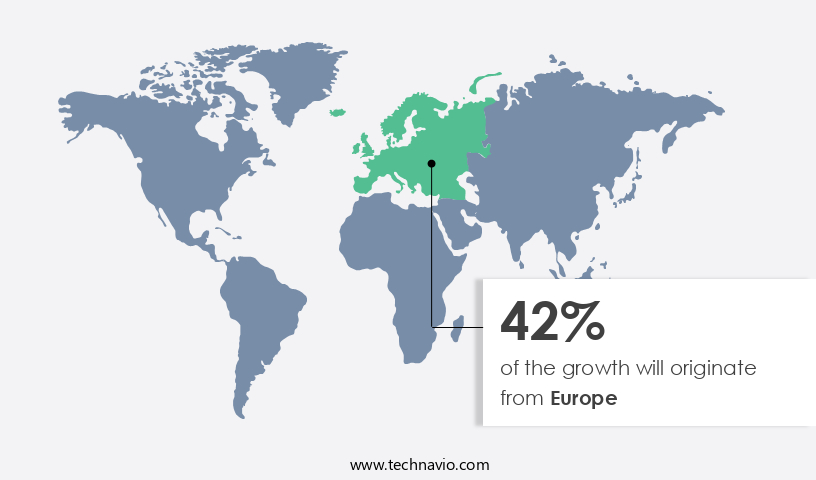
The European market is experiencing growth due to increasing imports and the rising demand for processed fish products. Self-sufficiency in fish and seafood production within Europe, coupled with the importation of salmon from countries like Norway, Germany, the Netherlands, Poland, Nigeria, Ghana, and Cameroon, is driving market expansion. Consumers in major markets such as the UK, France, Germany, Italy, and Spain prefer smoked salmon, making it the most popular category. Other smoked fish like mackerel and trout also hold significant market share. Health-conscious consumers are drawn to the health benefits of omega-3 fatty acids found in salmon, contributing to its popularity.
Sustainability certifications and quality assurance are essential factors for both producers and consumers. Product development, including value-added items like smoked salmon pate, salmon burgers, and salmon sushi, is a key trend. Temperature control and preservation methods are crucial for maintaining the freshness and flavor profiles of hot smoking salmon. The seafood market in Europe is subject to stringent food safety standards, and retail sales are influenced by pricing strategies. The supply chain for hot smoking salmon is intricate, involving fish processing, traceability systems, and refrigeration systems to ensure optimal shelf life for various salmon varieties, including Atlantic, coho, pink, king, sockeye, and chum salmon.
Market Dynamics
The Global Hot Smoking Salmon Market is experiencing robust growth, driven by increasing consumer demand for convenient and healthy seafood options. Hot smoked salmon, particularly hot smoked salmon fillets, are a popular choice, readily available as ready-to-eat hot smoked salmon in vacuum-packed hot smoked salmon formats. The market is segmented across retail sales and food service , with the online distribution channel showing significant expansion. Both farmed hot smoked salmon and wild-caught hot smoked salmon contribute to the supply, often enhanced with diverse flavored hot smoked salmon varieties. The Asia Pacific hot smoking salmon market is a key growth region. Hot smoking ovens and adherence to stringent food safety (smoked salmon) standards are crucial for hot smoked salmon manufacturers focusing on sustainable salmon products. This dynamic reflects evolving global hot smoking salmon market trends, emphasizing gourmet food options for healthy snacking within the broader smoked seafood industry.
Our researchers analyzed the data with 2024 as the base year, along with the key drivers, trends, and challenges. A holistic analysis of drivers will help companies refine their marketing strategies to gain a competitive advantage.
What are the key market drivers leading to the rise in the adoption of Hot Smoking Salmon Industry?
- The increasing demand for ready-to-eat (RTE) foods serves as the primary market driver.
- Hot smoking salmon has gained popularity in the food industry due to its convenience and preservation benefits. With consumers' increasing preference for ready-to-eat (RTE) meals and busy lifestyles, the demand for hot smoking salmon is on the rise. Companies focus on product development, utilizing advanced refrigeration systems and packaging materials to ensure temperature control and maintain the quality of the product. Sustainability certifications, such as those related to salmon farming, are also essential for businesses to meet the growing consumer demand for eco-friendly practices. Hot smoking salmon offers a longer shelf life compared to traditionally cooked meats, making it an attractive option for consumers.
- Additionally, the versatility of hot smoking salmon allows for various flavors and recipes, catering to diverse taste preferences. The convenience of handling and preparation further adds to the product's appeal. Companies prioritize the implementation of stringent production processes and adherence to food safety regulations to ensure the highest standard of product quality. Hot smoking salmon's growing popularity in salmon sushi and other culinary applications highlights its relevance in the food industry. By catering to the demand for convenience, flavor, and sustainability, hot smoking salmon companies are poised to meet the evolving needs of consumers.
What are the market trends shaping the Hot Smoking Salmon Industry?
- The trend in the market is shifting towards minimally processed and clean-label products due to growing consumer demand for transparency and health-conscious options. These products, which are free from artificial additives and preservatives, are increasingly preferred by consumers seeking natural and authentic food choices.
- The market is witnessing a trend towards minimally processed and clean-label products, as consumers prioritize healthier, more natural food options. Minimally processed salmon products contain few artificial additives, preservatives, and processing stages, while clean-label products offer transparency in ingredient sourcing and clear, understandable ingredient lists. This shift is particularly noticeable in the seafood industry, including hot smoking salmon. Manufacturers are adapting to these consumer preferences by using high-quality, natural components and avoiding unnecessary additions. For instance, hot smoking salmon products made with just fish, salt, and natural wood smoke are gaining popularity. Food safety standards are a crucial consideration in the production of hot smoking salmon.
- Pricing strategies vary depending on the source of the salmon, whether wild-caught or farmed, and the specific processing techniques used. Sensory analysis plays a significant role in ensuring the quality and consistency of hot smoking salmon products. Overall, the market is evolving to meet the demands of health-conscious consumers for natural, minimally processed, and transparent seafood options.
What challenges does the Hot Smoking Salmon Industry face during its growth?
- The escalating cost of producing high-quality hot-smoked salmon poses a significant challenge to the industry's growth trajectory.
- Hot smoking salmon is a popular and prized delicacy in the food industry due to its rich flavor and health benefits. The market for hot smoking salmon is driven by the high demand for this fish, which is rich in omega-3 fatty acids. However, the supply chain faces challenges due to the difficulty of obtaining wild salmon, which is preferred for its superior taste and flavor profiles. The process of hot smoking salmon involves various techniques, including cold smoking and smoking salmon fillets or steaks. Fishing for wild salmon is more challenging than farm-raised salmon, and the taste and flavor of wild salmon are influenced by its natural habitat and hormonal changes in the ocean.
- The supply rate of wild salmon is lower than the demand, leading to increased prices. Fish processing companies prioritize traceability systems to ensure the authenticity and quality of the salmon. Organic salmon is also gaining popularity in the market due to consumer preferences for sustainable and eco-friendly practices. Salmon canapés are a popular application of hot smoking salmon, and they are often served at formal events and gatherings. Overall, the market is dynamic and requires a robust supply chain to meet the high demand for this nutritious and flavorful fish.
Exclusive Customer Landscape
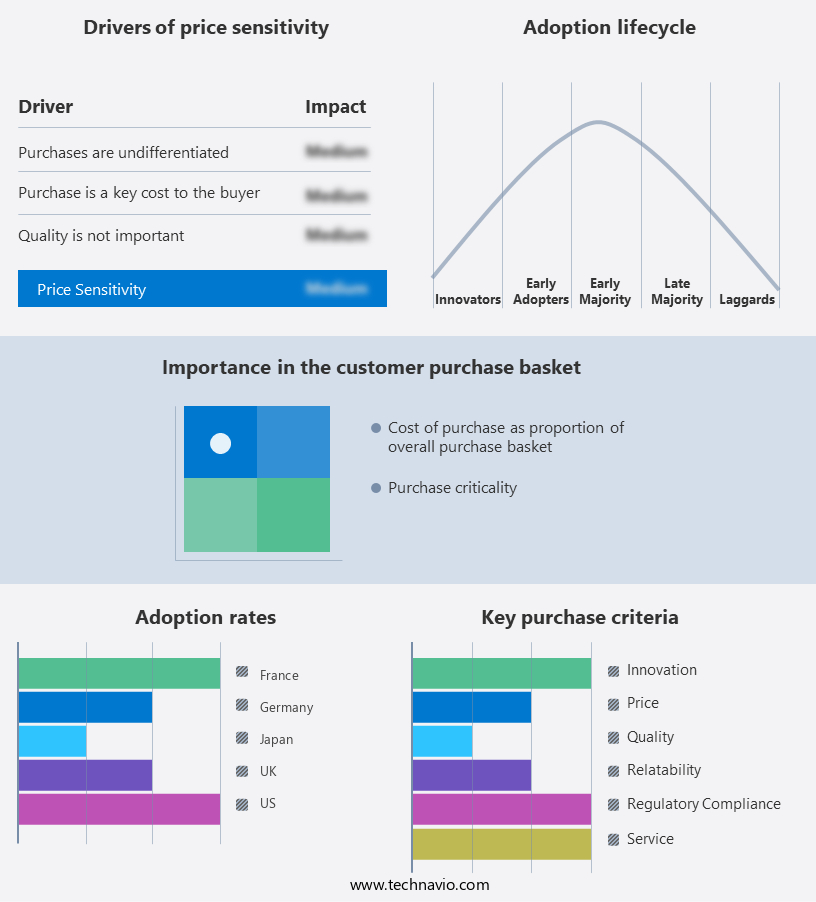
The hot smoking salmon market forecasting report includes the adoption lifecycle of the market, covering from the innovator's stage to the laggard's stage. It focuses on adoption rates in different regions based on penetration. Furthermore, the hot smoking salmon market report also includes key purchase criteria and drivers of price sensitivity to help companies evaluate and develop their market growth analysis strategies.

Customer Landscape
Key Companies & Market Insights
Companies are implementing various strategies, such as strategic alliances, hot smoking salmon market forecast, partnerships, mergers and acquisitions, geographical expansion, and product/service launches, to enhance their presence in the industry.
Acme Smoked Fish Holding Corp. - This company specializes in artisanal hot-smoked salmon products, including the Smoked Salmon Candy (3 oz.), Kippered Salmon, Baked Salmon Portion (4 oz.), Honey Maple Smoked Salmon, and Peppered Hot Smoked Salmon (4 oz.). Each item showcases the rich, smoky flavor and tender texture of premium salmon.
The industry research and growth report includes detailed analyses of the competitive landscape of the market and information about key companies, including:
- Acme Smoked Fish Holding Corp.
- Austevoll Seafood ASA
- BannerSmokedFish
- Bumble Bee Foods LLC
- Grieg Seafood ASA
- LABEYRIE FINE FOODS
- Leroy Seafood Group ASA
- Maisadour
- Mitsubishi Corp.
- Mowi ASA
- SalMar ASA
- SeaBear Smokehouse
- South Wind America
- St. James Smokehouse
- Suempol Sp.zo .o
- Tassal Group Ltd.
- The Santa Barbara Smokehouse
- Trident Seafoods Corp.
- Ubago Group Mare SL
Qualitative and quantitative analysis of companies has been conducted to help clients understand the wider business environment as well as the strengths and weaknesses of key industry players. Data is qualitatively analyzed to categorize companies as pure play, category-focused, industry-focused, and diversified; it is quantitatively analyzed to categorize companies as dominant, leading, strong, tentative, and weak.
Recent Development and News in Hot Smoking Salmon Market
- In January 2024, Nordic Salmon AS, a leading Norwegian hot smoked salmon producer, announced the launch of its new product line, "Nordic Select," which includes organic and sustainably sourced hot smoked salmon, targeting the growing demand for healthier and eco-friendly food options (Nordic Salmon AS press release).
- In March 2024, Mitsubishi Corporation, a global trading and investment company, and Salmon Innovation AS, a Norwegian salmon processing and technology firm, signed a strategic partnership to develop and commercialize innovative salmon processing technologies, aiming to increase efficiency and reduce environmental impact (Mitsubishi Corporation press release).
- In May 2024, Leroy Seafood Group, a major seafood company based in Norway, acquired a 40% stake in a new hot smoked salmon production facility in Poland, expanding its European presence and increasing its production capacity by 15,000 tons annually (Leroy Seafood Group press release).
- In February 2025, the European Commission approved the use of the term "organic" for farmed salmon produced in Europe, opening the door for hot smoked salmon producers to label their products as organic, providing a significant marketing advantage in the increasingly competitive market (European Commission press release).
Research Analyst Overview
- In the hot smoked salmon market, seasonal demand and premium pricing remain key drivers. Fish feed and disease prevention are essential aspects of sustainable aquaculture practices, ensuring a consistent supply and high-quality product. Cooking methods vary, with wholesale distribution channels catering to diverse retail channels, from supermarkets to specialty stores. Food waste reduction is a priority, with smoked salmon recipes and inventory management strategies employed to minimize losses. Carbon footprint and environmental impact are growing concerns, leading to increased focus on eco-friendly production and distribution networks. Food safety protocols, brand loyalty, and competitive advantage are crucial elements of marketing campaigns, with nutritional information and consumer insights shaping new product development.
- Sustainable practices, product differentiation, and aquaculture technology are industry standards, with product lifecycle management and new product launches driving innovation. Pricing elasticity, risk management, online sales, and social media marketing are essential components of effective business strategies. Consumer health concerns, salt content, moisture content, and food allergies require strict quality control processes and parasite control measures. Industry regulations and e-commerce platforms facilitate logistics management and distribution efficiency.
Dive into Technavio's robust research methodology, blending expert interviews, extensive data synthesis, and validated models for unparalleled Hot Smoking Salmon Market insights. See full methodology.
Market Scope
|
Report Coverage
|
Details
|
Page number
|
214
|
Base year
|
2024
|
Historic period
|
2019-2023 |
Forecast period
|
2025-2029
|
Growth momentum & CAGR
|
Accelerate at a CAGR of 5.1%
|
Market growth 2025-2029
|
USD 1361.8 million
|
Market structure
|
Fragmented
|
YoY growth 2024-2025(%)
|
4.7
|
Key countries
|
US, Canada, Germany, UK, Italy, France, China, India, Japan, Brazil, Egypt, UAE, Oman, Argentina, KSA, UAE, Brazil, and Rest of World (ROW)
|
Competitive landscape
|
Leading Companies, Market Positioning of Companies, Competitive Strategies, and Industry Risks
|
Request Free Sample
What are the Key Data Covered in this Hot Smoking Salmon Market Research and Growth Report?
- CAGR of the Hot Smoking Salmon industry during the forecast period
- Detailed information on factors that will drive the growth and forecasting between 2025 and 2029
- Precise estimation of the size of the market and its contribution of the industry in focus to the parent market
- Accurate predictions about upcoming growth and trends and changes in consumer behaviour
- Growth of the market across Europe, North America, APAC, South America, and Middle East and Africa
- Thorough analysis of the market's competitive landscape and detailed information about companies
- Comprehensive analysis of factors that will challenge the hot smoking salmon market growth of industry companies
We can help! Our analysts can customize this hot smoking salmon market research report to meet your requirements.
Get in touch
1 Executive Summary
- 1.1 Market overview
- Executive Summary - Chart on Market Overview
- Executive Summary - Data Table on Market Overview
- Executive Summary - Chart on Global Market Characteristics
- Executive Summary - Chart on Market by Geography
- Executive Summary - Chart on Market Segmentation by Distribution Channel
- Executive Summary - Chart on Market Segmentation by End-user
- Executive Summary - Chart on Market Segmentation by Packaging
- Executive Summary - Chart on Incremental Growth
- Executive Summary - Data Table on Incremental Growth
- Executive Summary - Chart on Company Market Positioning
2 Technavio Analysis
- 2.1 Analysis of price sensitivity, lifecycle, customer purchase basket, adoption rates, and purchase criteria
- Analysis of price sensitivity, lifecycle, customer purchase basket, adoption rates, and purchase criteria
- 2.2 Criticality of inputs and Factors of differentiation
- Overview on criticality of inputs and factors of differentiation
- 2.3 Factors of disruption
- Overview on factors of disruption
- 2.4 Impact of drivers and challenges
- Impact of drivers and challenges in 2024 and 2029
3 Market Landscape
- 3.1 Market ecosystem
- Parent Market
- Data Table on - Parent Market
- 3.2 Market characteristics
- Market characteristics analysis
4 Market Sizing
- 4.1 Market definition
- Offerings of companies included in the market definition
- 4.2 Market segment analysis
- 4.4 Market outlook: Forecast for 2024-2029
- Chart on Global - Market size and forecast 2024-2029 ($ million)
- Data Table on Global - Market size and forecast 2024-2029 ($ million)
- Chart on Global Market: Year-over-year growth 2024-2029 (%)
- Data Table on Global Market: Year-over-year growth 2024-2029 (%)
5 Historic Market Size
- 5.1 Global Hot Smoking Salmon Market 2019 - 2023
- Historic Market Size - Data Table on Global Hot Smoking Salmon Market 2019 - 2023 ($ million)
- 5.2 Distribution Channel segment analysis 2019 - 2023
- Historic Market Size - Distribution Channel Segment 2019 - 2023 ($ million)
- 5.3 End-user segment analysis 2019 - 2023
- Historic Market Size - End-user Segment 2019 - 2023 ($ million)
- 5.4 Packaging segment analysis 2019 - 2023
- Historic Market Size - Packaging Segment 2019 - 2023 ($ million)
- 5.5 Geography segment analysis 2019 - 2023
- Historic Market Size - Geography Segment 2019 - 2023 ($ million)
- 5.6 Country segment analysis 2019 - 2023
- Historic Market Size - Country Segment 2019 - 2023 ($ million)
6 Qualitative Analysis
- 6.1 Impact of AI on Global Hot Smoking Salmon Market
7 Five Forces Analysis
- 7.1 Five forces summary
- Five forces analysis - Comparison between 2024 and 2029
- 7.2 Bargaining power of buyers
- Bargaining power of buyers - Impact of key factors 2024 and 2029
- 7.3 Bargaining power of suppliers
- Bargaining power of suppliers - Impact of key factors in 2024 and 2029
- 7.4 Threat of new entrants
- Threat of new entrants - Impact of key factors in 2024 and 2029
- 7.5 Threat of substitutes
- Threat of substitutes - Impact of key factors in 2024 and 2029
- 7.6 Threat of rivalry
- Threat of rivalry - Impact of key factors in 2024 and 2029
- 7.7 Market condition
- Chart on Market condition - Five forces 2024 and 2029
8 Market Segmentation by Distribution Channel
- 8.1 Market segments
- Chart on Distribution Channel - Market share (2024-2029) (%)
- Data Table on Distribution Channel - Market share (2024-2029) (%)
- 8.2 Comparison by Distribution Channel
- Chart on Comparison by Distribution Channel
- Data Table on Comparison by Distribution Channel
- 8.3 Offline - Market size and forecast (2024-2029)
- Chart on Offline - Market size and forecast (2024-2029) ($ million)
- Data Table on Offline - Market size and forecast (2024-2029) ($ million)
- Chart on Offline - Year-over-year growth (2024-2029) (%)
- Data Table on Offline - Year-over-year growth (2024-2029) (%)
- 8.4 Online - Market size and forecast (2024-2029)
- Chart on Online - Market size and forecast (2024-2029) ($ million)
- Data Table on Online - Market size and forecast (2024-2029) ($ million)
- Chart on Online - Year-over-year growth (2024-2029) (%)
- Data Table on Online - Year-over-year growth (2024-2029) (%)
- 8.5 Market opportunity by Distribution Channel
- Market opportunity by Distribution Channel ($ million)
- Data Table on Market opportunity by Distribution Channel ($ million)
9 Market Segmentation by End-user
- 9.1 Market segments
- Chart on End-user - Market share (2024-2029) (%)
- Data Table on End-user - Market share (2024-2029) (%)
- 9.2 Comparison by End-user
- Chart on Comparison by End-user
- Data Table on Comparison by End-user
- 9.3 Food services - Market size and forecast (2024-2029)
- Chart on Food services - Market size and forecast (2024-2029) ($ million)
- Data Table on Food services - Market size and forecast (2024-2029) ($ million)
- Chart on Food services - Year-over-year growth (2024-2029) (%)
- Data Table on Food services - Year-over-year growth (2024-2029) (%)
- 9.4 Retail - Market size and forecast (2024-2029)
- Chart on Retail - Market size and forecast (2024-2029) ($ million)
- Data Table on Retail - Market size and forecast (2024-2029) ($ million)
- Chart on Retail - Year-over-year growth (2024-2029) (%)
- Data Table on Retail - Year-over-year growth (2024-2029) (%)
- 9.5 Market opportunity by End-user
- Market opportunity by End-user ($ million)
- Data Table on Market opportunity by End-user ($ million)
10 Market Segmentation by Packaging
- 10.1 Market segments
- Chart on Packaging - Market share (2024-2029) (%)
- Data Table on Packaging - Market share (2024-2029) (%)
- 10.2 Comparison by Packaging
- Chart on Comparison by Packaging
- Data Table on Comparison by Packaging
- 10.3 Vacuum packaging - Market size and forecast (2024-2029)
- Chart on Vacuum packaging - Market size and forecast (2024-2029) ($ million)
- Data Table on Vacuum packaging - Market size and forecast (2024-2029) ($ million)
- Chart on Vacuum packaging - Year-over-year growth (2024-2029) (%)
- Data Table on Vacuum packaging - Year-over-year growth (2024-2029) (%)
- 10.4 Canned packaging - Market size and forecast (2024-2029)
- Chart on Canned packaging - Market size and forecast (2024-2029) ($ million)
- Data Table on Canned packaging - Market size and forecast (2024-2029) ($ million)
- Chart on Canned packaging - Year-over-year growth (2024-2029) (%)
- Data Table on Canned packaging - Year-over-year growth (2024-2029) (%)
- 10.5 Market opportunity by Packaging
- Market opportunity by Packaging ($ million)
- Data Table on Market opportunity by Packaging ($ million)
11 Market Segmentation by Type
- 11.1 Market segments
- Chart on Type - Market share (2024-2029) (%)
- Data Table on Type - Market share (2024-2029) (%)
- 11.2 Comparison by Type
- Chart on Comparison by Type
- Data Table on Comparison by Type
- 11.3 Hot Smoked Salmon Fillets - Market size and forecast (2024-2029)
- Chart on Hot Smoked Salmon Fillets - Market size and forecast (2024-2029) ($ million)
- Data Table on Hot Smoked Salmon Fillets - Market size and forecast (2024-2029) ($ million)
- Chart on Hot Smoked Salmon Fillets - Year-over-year growth (2024-2029) (%)
- Data Table on Hot Smoked Salmon Fillets - Year-over-year growth (2024-2029) (%)
- 11.4 Hot Smoked Salmon Portions - Market size and forecast (2024-2029)
- Chart on Hot Smoked Salmon Portions - Market size and forecast (2024-2029) ($ million)
- Data Table on Hot Smoked Salmon Portions - Market size and forecast (2024-2029) ($ million)
- Chart on Hot Smoked Salmon Portions - Year-over-year growth (2024-2029) (%)
- Data Table on Hot Smoked Salmon Portions - Year-over-year growth (2024-2029) (%)
- 11.5 Hot Smoked Salmon Sides - Market size and forecast (2024-2029)
- Chart on Hot Smoked Salmon Sides - Market size and forecast (2024-2029) ($ million)
- Data Table on Hot Smoked Salmon Sides - Market size and forecast (2024-2029) ($ million)
- Chart on Hot Smoked Salmon Sides - Year-over-year growth (2024-2029) (%)
- Data Table on Hot Smoked Salmon Sides - Year-over-year growth (2024-2029) (%)
- 11.6 Hot Smoked Salmon Flakes - Market size and forecast (2024-2029)
- Chart on Hot Smoked Salmon Flakes - Market size and forecast (2024-2029) ($ million)
- Data Table on Hot Smoked Salmon Flakes - Market size and forecast (2024-2029) ($ million)
- Chart on Hot Smoked Salmon Flakes - Year-over-year growth (2024-2029) (%)
- Data Table on Hot Smoked Salmon Flakes - Year-over-year growth (2024-2029) (%)
- 11.7 Market opportunity by Type
- Market opportunity by Type ($ million)
- Data Table on Market opportunity by Type ($ million)
12 Market Segmentation by Species
- 12.1 Market segments
- Chart on Species - Market share (2024-2029) (%)
- Data Table on Species - Market share (2024-2029) (%)
- 12.2 Comparison by Species
- Chart on Comparison by Species
- Data Table on Comparison by Species
- 12.3 Atlantic Salmon - Market size and forecast (2024-2029)
- Chart on Atlantic Salmon - Market size and forecast (2024-2029) ($ million)
- Data Table on Atlantic Salmon - Market size and forecast (2024-2029) ($ million)
- Chart on Atlantic Salmon - Year-over-year growth (2024-2029) (%)
- Data Table on Atlantic Salmon - Year-over-year growth (2024-2029) (%)
- 12.4 Pacific Salmon (Coho, Sockeye, Chinook) - Market size and forecast (2024-2029)
- Chart on Pacific Salmon (Coho, Sockeye, Chinook) - Market size and forecast (2024-2029) ($ million)
- Data Table on Pacific Salmon (Coho, Sockeye, Chinook) - Market size and forecast (2024-2029) ($ million)
- Chart on Pacific Salmon (Coho, Sockeye, Chinook) - Year-over-year growth (2024-2029) (%)
- Data Table on Pacific Salmon (Coho, Sockeye, Chinook) - Year-over-year growth (2024-2029) (%)
- 12.5 Rainbow Trout (often smoked like salmon) - Market size and forecast (2024-2029)
- Chart on Rainbow Trout (often smoked like salmon) - Market size and forecast (2024-2029) ($ million)
- Data Table on Rainbow Trout (often smoked like salmon) - Market size and forecast (2024-2029) ($ million)
- Chart on Rainbow Trout (often smoked like salmon) - Year-over-year growth (2024-2029) (%)
- Data Table on Rainbow Trout (often smoked like salmon) - Year-over-year growth (2024-2029) (%)
- 12.6 Market opportunity by Species
- Market opportunity by Species ($ million)
- Data Table on Market opportunity by Species ($ million)
13 Market Segmentation by Flavor/Seasoning
- 13.1 Market segments
- Chart on Flavor/Seasoning - Market share (2024-2029) (%)
- Data Table on Flavor/Seasoning - Market share (2024-2029) (%)
- 13.2 Comparison by Flavor/Seasoning
- Chart on Comparison by Flavor/Seasoning
- Data Table on Comparison by Flavor/Seasoning
- 13.3 Natural/Traditional - Market size and forecast (2024-2029)
- Chart on Natural/Traditional - Market size and forecast (2024-2029) ($ million)
- Data Table on Natural/Traditional - Market size and forecast (2024-2029) ($ million)
- Chart on Natural/Traditional - Year-over-year growth (2024-2029) (%)
- Data Table on Natural/Traditional - Year-over-year growth (2024-2029) (%)
- 13.4 Peppered - Market size and forecast (2024-2029)
- Chart on Peppered - Market size and forecast (2024-2029) ($ million)
- Data Table on Peppered - Market size and forecast (2024-2029) ($ million)
- Chart on Peppered - Year-over-year growth (2024-2029) (%)
- Data Table on Peppered - Year-over-year growth (2024-2029) (%)
- 13.5 Teriyaki - Market size and forecast (2024-2029)
- Chart on Teriyaki - Market size and forecast (2024-2029) ($ million)
- Data Table on Teriyaki - Market size and forecast (2024-2029) ($ million)
- Chart on Teriyaki - Year-over-year growth (2024-2029) (%)
- Data Table on Teriyaki - Year-over-year growth (2024-2029) (%)
- 13.6 Maple - Market size and forecast (2024-2029)
- Chart on Maple - Market size and forecast (2024-2029) ($ million)
- Data Table on Maple - Market size and forecast (2024-2029) ($ million)
- Chart on Maple - Year-over-year growth (2024-2029) (%)
- Data Table on Maple - Year-over-year growth (2024-2029) (%)
- 13.7 Herbed - Market size and forecast (2024-2029)
- Chart on Herbed - Market size and forecast (2024-2029) ($ million)
- Data Table on Herbed - Market size and forecast (2024-2029) ($ million)
- Chart on Herbed - Year-over-year growth (2024-2029) (%)
- Data Table on Herbed - Year-over-year growth (2024-2029) (%)
- 13.8 Market opportunity by Flavor/Seasoning
- Market opportunity by Flavor/Seasoning ($ million)
- Data Table on Market opportunity by Flavor/Seasoning ($ million)
14 Customer Landscape
- 14.1 Customer landscape overview
- Analysis of price sensitivity, lifecycle, customer purchase basket, adoption rates, and purchase criteria
15 Geographic Landscape
- 15.1 Geographic segmentation
- Chart on Market share by geography 2024-2029 (%)
- Data Table on Market share by geography 2024-2029 (%)
- 15.2 Geographic comparison
- Chart on Geographic comparison
- Data Table on Geographic comparison
- 15.3 Europe - Market size and forecast 2024-2029
- Chart on Europe - Market size and forecast 2024-2029 ($ million)
- Data Table on Europe - Market size and forecast 2024-2029 ($ million)
- Chart on Europe - Year-over-year growth 2024-2029 (%)
- Data Table on Europe - Year-over-year growth 2024-2029 (%)
- 15.4 North America - Market size and forecast 2024-2029
- Chart on North America - Market size and forecast 2024-2029 ($ million)
- Data Table on North America - Market size and forecast 2024-2029 ($ million)
- Chart on North America - Year-over-year growth 2024-2029 (%)
- Data Table on North America - Year-over-year growth 2024-2029 (%)
- 15.5 APAC - Market size and forecast 2024-2029
- Chart on APAC - Market size and forecast 2024-2029 ($ million)
- Data Table on APAC - Market size and forecast 2024-2029 ($ million)
- Chart on APAC - Year-over-year growth 2024-2029 (%)
- Data Table on APAC - Year-over-year growth 2024-2029 (%)
- 15.6 South America - Market size and forecast 2024-2029
- Chart on South America - Market size and forecast 2024-2029 ($ million)
- Data Table on South America - Market size and forecast 2024-2029 ($ million)
- Chart on South America - Year-over-year growth 2024-2029 (%)
- Data Table on South America - Year-over-year growth 2024-2029 (%)
- 15.7 Middle East and Africa - Market size and forecast 2024-2029
- Chart on Middle East and Africa - Market size and forecast 2024-2029 ($ million)
- Data Table on Middle East and Africa - Market size and forecast 2024-2029 ($ million)
- Chart on Middle East and Africa - Year-over-year growth 2024-2029 (%)
- Data Table on Middle East and Africa - Year-over-year growth 2024-2029 (%)
- 15.8 US - Market size and forecast 2024-2029
- Chart on US - Market size and forecast 2024-2029 ($ million)
- Data Table on US - Market size and forecast 2024-2029 ($ million)
- Chart on US - Year-over-year growth 2024-2029 (%)
- Data Table on US - Year-over-year growth 2024-2029 (%)
- 15.9 Germany - Market size and forecast 2024-2029
- Chart on Germany - Market size and forecast 2024-2029 ($ million)
- Data Table on Germany - Market size and forecast 2024-2029 ($ million)
- Chart on Germany - Year-over-year growth 2024-2029 (%)
- Data Table on Germany - Year-over-year growth 2024-2029 (%)
- 15.10 France - Market size and forecast 2024-2029
- Chart on France - Market size and forecast 2024-2029 ($ million)
- Data Table on France - Market size and forecast 2024-2029 ($ million)
- Chart on France - Year-over-year growth 2024-2029 (%)
- Data Table on France - Year-over-year growth 2024-2029 (%)
- 15.11 China - Market size and forecast 2024-2029
- Chart on China - Market size and forecast 2024-2029 ($ million)
- Data Table on China - Market size and forecast 2024-2029 ($ million)
- Chart on China - Year-over-year growth 2024-2029 (%)
- Data Table on China - Year-over-year growth 2024-2029 (%)
- 15.12 UK - Market size and forecast 2024-2029
- Chart on UK - Market size and forecast 2024-2029 ($ million)
- Data Table on UK - Market size and forecast 2024-2029 ($ million)
- Chart on UK - Year-over-year growth 2024-2029 (%)
- Data Table on UK - Year-over-year growth 2024-2029 (%)
- 15.13 Canada - Market size and forecast 2024-2029
- Chart on Canada - Market size and forecast 2024-2029 ($ million)
- Data Table on Canada - Market size and forecast 2024-2029 ($ million)
- Chart on Canada - Year-over-year growth 2024-2029 (%)
- Data Table on Canada - Year-over-year growth 2024-2029 (%)
- 15.14 Japan - Market size and forecast 2024-2029
- Chart on Japan - Market size and forecast 2024-2029 ($ million)
- Data Table on Japan - Market size and forecast 2024-2029 ($ million)
- Chart on Japan - Year-over-year growth 2024-2029 (%)
- Data Table on Japan - Year-over-year growth 2024-2029 (%)
- 15.15 Italy - Market size and forecast 2024-2029
- Chart on Italy - Market size and forecast 2024-2029 ($ million)
- Data Table on Italy - Market size and forecast 2024-2029 ($ million)
- Chart on Italy - Year-over-year growth 2024-2029 (%)
- Data Table on Italy - Year-over-year growth 2024-2029 (%)
- 15.16 Mexico - Market size and forecast 2024-2029
- Chart on Mexico - Market size and forecast 2024-2029 ($ million)
- Data Table on Mexico - Market size and forecast 2024-2029 ($ million)
- Chart on Mexico - Year-over-year growth 2024-2029 (%)
- Data Table on Mexico - Year-over-year growth 2024-2029 (%)
- 15.17 South Korea - Market size and forecast 2024-2029
- Chart on South Korea - Market size and forecast 2024-2029 ($ million)
- Data Table on South Korea - Market size and forecast 2024-2029 ($ million)
- Chart on South Korea - Year-over-year growth 2024-2029 (%)
- Data Table on South Korea - Year-over-year growth 2024-2029 (%)
- 15.18 Market opportunity by geography
- Market opportunity by geography ($ million)
- Data Tables on Market opportunity by geography ($ million)
- 15.19 India - Market size and forecast (2024-2029)
- Chart on India - Market size and forecast (2024-2029) ($ million)
- Data Table on India - Market size and forecast (2024-2029) ($ million)
- Chart on India - Year-over-year growth (2024-2029) (%)
- Data Table on India - Year-over-year growth (2024-2029) (%)
- 15.20 Brazil - Market size and forecast (2024-2029)
- Chart on Brazil - Market size and forecast (2024-2029) ($ million)
- Data Table on Brazil - Market size and forecast (2024-2029) ($ million)
- Chart on Brazil - Year-over-year growth (2024-2029) (%)
- Data Table on Brazil - Year-over-year growth (2024-2029) (%)
- 15.21 Egypt - Market size and forecast (2024-2029)
- Chart on Egypt - Market size and forecast (2024-2029) ($ million)
- Data Table on Egypt - Market size and forecast (2024-2029) ($ million)
- Chart on Egypt - Year-over-year growth (2024-2029) (%)
- Data Table on Egypt - Year-over-year growth (2024-2029) (%)
- 15.22 UAE - Market size and forecast (2024-2029)
- Chart on UAE - Market size and forecast (2024-2029) ($ million)
- Data Table on UAE - Market size and forecast (2024-2029) ($ million)
- Chart on UAE - Year-over-year growth (2024-2029) (%)
- Data Table on UAE - Year-over-year growth (2024-2029) (%)
- 15.23 Oman - Market size and forecast (2024-2029)
- Chart on Oman - Market size and forecast (2024-2029) ($ million)
- Data Table on Oman - Market size and forecast (2024-2029) ($ million)
- Chart on Oman - Year-over-year growth (2024-2029) (%)
- Data Table on Oman - Year-over-year growth (2024-2029) (%)
- 15.24 Argentina - Market size and forecast (2024-2029)
- Chart on Argentina - Market size and forecast (2024-2029) ($ million)
- Data Table on Argentina - Market size and forecast (2024-2029) ($ million)
- Chart on Argentina - Year-over-year growth (2024-2029) (%)
- Data Table on Argentina - Year-over-year growth (2024-2029) (%)
- 15.25 KSA - Market size and forecast (2024-2029)
- Chart on KSA - Market size and forecast (2024-2029) ($ million)
- Data Table on KSA - Market size and forecast (2024-2029) ($ million)
- Chart on KSA - Year-over-year growth (2024-2029) (%)
- Data Table on KSA - Year-over-year growth (2024-2029) (%)
- 15.26 Rest of World (ROW) - Market size and forecast (2024-2029)
- Chart on Rest of World (ROW) - Market size and forecast (2024-2029) ($ million)
- Data Table on Rest of World (ROW) - Market size and forecast (2024-2029) ($ million)
- Chart on Rest of World (ROW) - Year-over-year growth (2024-2029) (%)
- Data Table on Rest of World (ROW) - Year-over-year growth (2024-2029) (%)
16 Drivers, Challenges, and Opportunity/Restraints
- 16.3 Impact of drivers and challenges
- Impact of drivers and challenges in 2024 and 2029
- 16.4 Market opportunities/restraints
17 Competitive Landscape
- 17.2 Competitive Landscape
- Overview on criticality of inputs and factors of differentiation
- 17.3 Landscape disruption
- Overview on factors of disruption
- 17.4 Industry risks
- Impact of key risks on business
18 Competitive Analysis
- 18.2 Company ranking index
- 18.3 Market positioning of companies
- Matrix on companies position and classification
- 18.4 Acme Smoked Fish Holding Corp.
- Acme Smoked Fish Holding Corp. - Overview
- Acme Smoked Fish Holding Corp. - Product / Service
- Acme Smoked Fish Holding Corp. - Key offerings
- SWOT
- 18.5 Austevoll Seafood ASA
- Austevoll Seafood ASA - Overview
- Austevoll Seafood ASA - Business segments
- Austevoll Seafood ASA - Key offerings
- Austevoll Seafood ASA - Segment focus
- SWOT
- 18.6 BannerSmokedFish
- BannerSmokedFish - Overview
- BannerSmokedFish - Product / Service
- BannerSmokedFish - Key offerings
- SWOT
- 18.7 Bumble Bee Foods LLC
- Bumble Bee Foods LLC - Overview
- Bumble Bee Foods LLC - Product / Service
- Bumble Bee Foods LLC - Key offerings
- SWOT
- 18.8 Grieg Seafood ASA
- Grieg Seafood ASA - Overview
- Grieg Seafood ASA - Business segments
- Grieg Seafood ASA - Key offerings
- Grieg Seafood ASA - Segment focus
- SWOT
- 18.9 LABEYRIE FINE FOODS
- LABEYRIE FINE FOODS - Overview
- LABEYRIE FINE FOODS - Product / Service
- LABEYRIE FINE FOODS - Key offerings
- SWOT
- 18.10 Leroy Seafood Group ASA
- Leroy Seafood Group ASA - Overview
- Leroy Seafood Group ASA - Product / Service
- Leroy Seafood Group ASA - Key offerings
- SWOT
- 18.11 Maisadour
- Maisadour - Overview
- Maisadour - Product / Service
- Maisadour - Key offerings
- SWOT
- 18.12 Mowi ASA
- Mowi ASA - Overview
- Mowi ASA - Business segments
- Mowi ASA - Key offerings
- Mowi ASA - Segment focus
- SWOT
- 18.13 SeaBear Smokehouse
- SeaBear Smokehouse - Overview
- SeaBear Smokehouse - Product / Service
- SeaBear Smokehouse - Key offerings
- SWOT
- 18.14 South Wind America
- South Wind America - Overview
- South Wind America - Product / Service
- South Wind America - Key offerings
- SWOT
- 18.15 Suempol Sp.zo .o
- Suempol Sp.zo .o - Overview
- Suempol Sp.zo .o - Product / Service
- Suempol Sp.zo .o - Key offerings
- SWOT
- 18.16 Tassal Group Ltd.
- Tassal Group Ltd. - Overview
- Tassal Group Ltd. - Product / Service
- Tassal Group Ltd. - Key offerings
- SWOT
- 18.17 Trident Seafoods Corp.
- Trident Seafoods Corp. - Overview
- Trident Seafoods Corp. - Product / Service
- Trident Seafoods Corp. - Key offerings
- SWOT
- 18.18 Ubago Group Mare SL
- Ubago Group Mare SL - Overview
- Ubago Group Mare SL - Product / Service
- Ubago Group Mare SL - Key offerings
- SWOT
19 Appendix
- 19.2 Inclusions and exclusions checklist
- Inclusions checklist
- Exclusions checklist
- 19.3 Currency conversion rates for US$
- Currency conversion rates for US$
- 19.4 Research methodology
- 19.7 Validation techniques employed for market sizing
- Validation techniques employed for market sizing
- 19.9 360 degree market analysis
- 360 degree market analysis
- 19.10 List of abbreviations