Food Preservatives Market Analysis, Size, and Forecast 2024-2028: North America (Canada and Mexico), Europe (France, Germany, and UK), Middle East and Africa (UAE), APAC (China, India, Indonesia, Japan, Malaysia, South Korea, and Thailand), South America (Brazil), and Rest of World (ROW)

Food Preservatives Market Analysis, Size, and Forecast 2024-2028:
North America (Canada and Mexico), Europe (France, Germany, and UK), Middle East and Africa (UAE), APAC (China, India, Indonesia, Japan, Malaysia, South Korea, and Thailand), South America (Brazil), and Rest of World (ROW)

Published: Jul 2024 159 Pages SKU: IRTNTR75683

Market Overview at a Glance

$529.1 B
Market Opportunity
3.2%
CAGR
3.06
YoY growth 2023-2024(%)

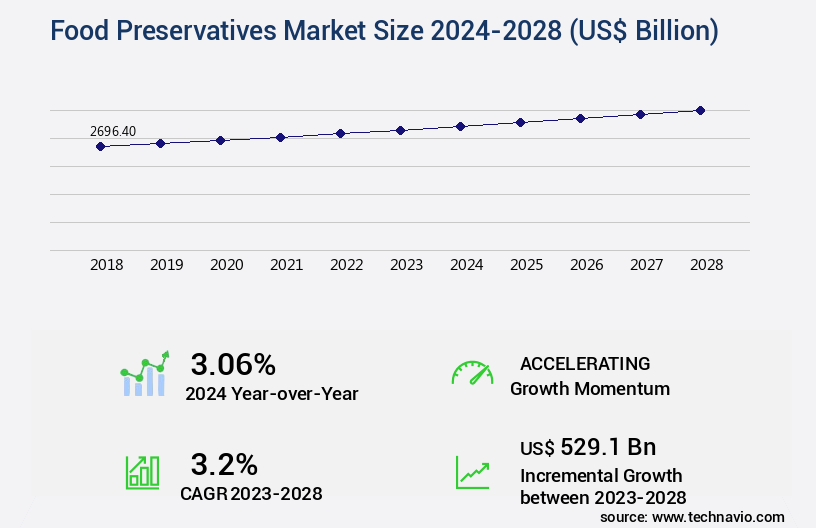
Food Preservatives Market Size 2024-2028

The food preservatives market size is valued to increase USD 529.1 billion, at a CAGR of 3.2% from 2023 to 2028. Rising demand for processed food will drive the food preservatives market.

Major Market Trends & Insights

  • APAC dominated the market and accounted for a 29% growth during the forecast period.
  • By Product Type - Synthetic segment was valued at USD 1501.90 billion in 2022
  • By Type - Anti-microbial segment accounted for the largest market revenue share in 2022

Market Size & Forecast

  • Market Opportunities: USD 34.66 billion
  • Market Future Opportunities: USD 529.10 billion
  • CAGR : 3.2%
  • APAC: Largest market in 2022

Market Summary

  • The market encompasses the production and distribution of substances used to extend the shelf life and enhance the safety of food products. This market is characterized by continuous evolution, driven by several key factors. The increasing demand for processed food and convenience items is a major driver, as these products often require preservatives to maintain their quality and extend their shelf life. At the same time, there is a rising trend toward organic and natural food products, which has led to increased scrutiny of synthetic preservatives and a growing demand for natural alternatives. Core technologies and applications, such as modified atmosphere packaging and natural preservatives, are at the forefront of innovation in this market.
  • Service types or product categories, including synthetic preservatives, natural preservatives, and preservative systems, are evolving to meet the changing demands of consumers and regulators. Stringent regulations for food preservatives, particularly in regions like Europe and North America, are shaping the market landscape and driving the adoption of natural and organic preservatives. 

What will be the Size of the Food Preservatives Market during the forecast period?

Food Preservatives Market Size

Get Key Insights on Market Forecast (PDF) Request Free Sample

How is the Food Preservatives Market Segmented and what are the key trends of market segmentation?

The food preservatives industry research report provides comprehensive data (region-wise segment analysis), with forecasts and estimates in "USD billion" for the period 2024-2028, as well as historical data from 2018-2022 for the following segments.

  • Product Type
    • Synthetic
    • Natural
  • Type
    • Anti-microbial
    • Antioxidant
    • Others
  • Application
    • Bakery
    • Meat and Poultry
    • Dairy
    • Beverages
    • Confectionery
  • Geography
    • North America
      • US
      • Canada
      • Mexico
    • Europe
      • France
      • Germany
      • UK
    • Middle East and Africa
      • UAE
    • APAC
      • China
      • India
      • Indonesia
      • Japan
      • Malaysia
      • South Korea
      • Thailand
    • South America
      • Brazil
    • Rest of World (ROW)

By Product Type Insights

The synthetic segment is estimated to witness significant growth during the forecast period.

Food preservatives are essential additives used in the food industry to inhibit microbial growth and prevent oxidation reactions. Synthetic preservatives, such as sodium benzoate and potassium sorbate, have long been employed due to their effectiveness in maintaining food quality, flavor, and taste. However, the increasing health consciousness among consumers has led to a growing preference for natural preservatives, including plant extracts, essential oils, and edible coatings. Sensory evaluation plays a crucial role in assessing the preservation efficacy of various preservation methods, such as hurdle technology, enzyme inhibition, and modified atmosphere packaging. Hurdle technology, which combines multiple preservation methods, has gained popularity due to its ability to provide effective microbial control.

Chitosan films, a natural preservative derived from chitin, have shown promise in extending shelf life and inhibiting fungal growth. Irradiation techniques and thermal processing are also used to ensure food safety and extend shelf life. Competitive inhibition, pH control, and bacteriocin production are other preservation methods that have gained traction in the industry. Shelf life extension is a key driver for the market, with the demand for long-lasting packaged and ready-to-eat (RTE) food continuing to grow. 

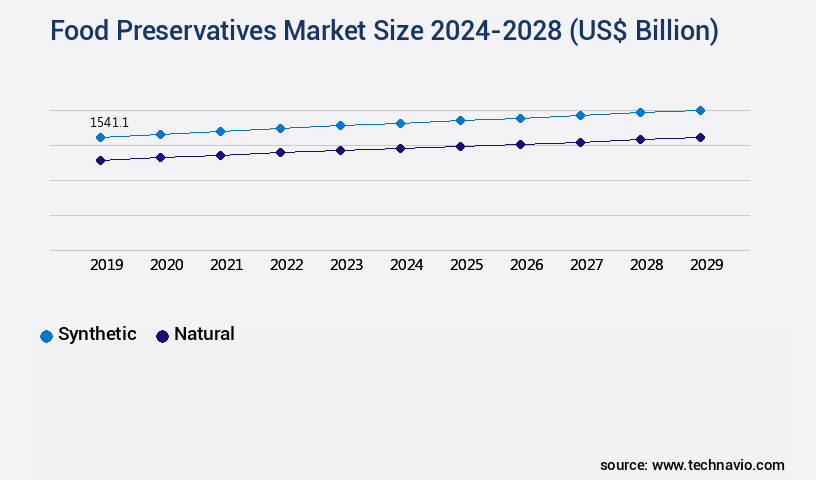
Meanwhile, the demand for natural preservatives is expected to increase by 5.2% per year, driven by consumer preferences for healthier food options. The market for synthetic preservatives, on the other hand, is anticipated to grow at a slower pace of 2.9% per year. Quality attributes, such as preservation efficacy, antioxidant activity, and microbial control, are critical factors influencing the choice of preservatives in the food industry. Lactic acid bacteria, sodium lactate, and acetic acid are commonly used preservatives that offer these benefits. Microbial inactivation and bacterial growth inhibition are essential functions of preservatives, ensuring food safety and maintaining product quality.

Food Preservatives Market Size

Request Free Sample

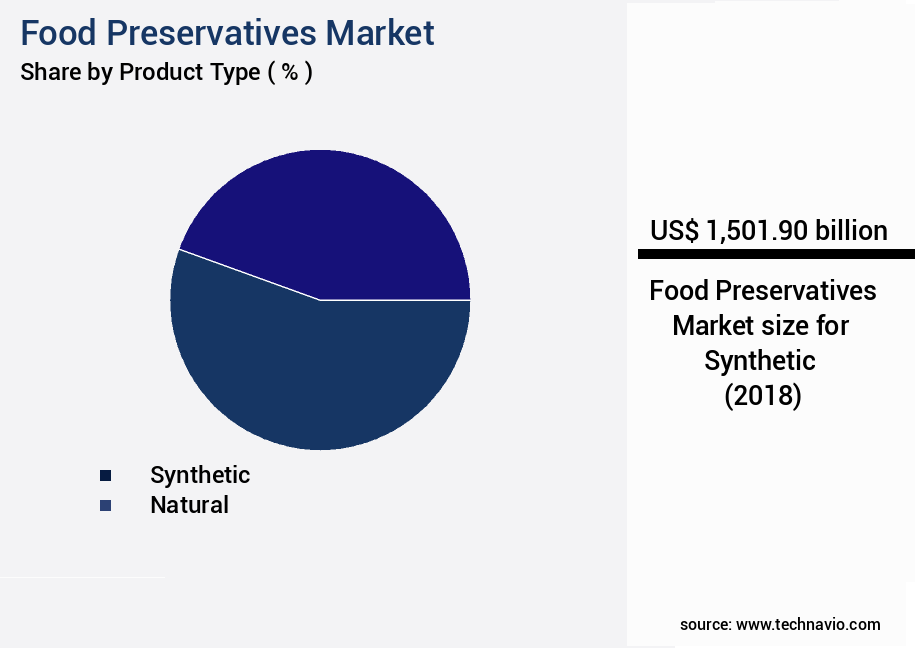
The Synthetic segment was valued at USD 1501.90 billion in 2018 and showed a gradual increase during the forecast period.

High-pressure processing and water activity control are emerging preservation technologies that offer potential for further growth in the market. The market is driven by the growing demand for long-lasting, high-quality food products. While synthetic preservatives continue to dominate the market, the demand for natural preservatives is on the rise due to consumer preferences for healthier food options. The market is expected to grow at a steady pace, with a focus on innovation and the development of new preservation technologies.

Food Preservatives Market Size

Request Free Sample

Regional Analysis

APAC is estimated to contribute 29% to the growth of the global market during the forecast period. Technavio's analysts have elaborately explained the regional trends and drivers that shape the market during the forecast period.

Food Preservatives Market Share by Geography

See How Food Preservatives Market Demand is Rising in APAC Request Free Sample

The North American market is experiencing consistent growth, driven by the increasing demand for food preservatives in various industries. Key products, including cheese, canned fruit juice, and margarine, are significant contributors to this market's expansion. The US dominates the market due to its robust food industry and the presence of major players like ADM and Cargill. Notable food chains, such as McDonald's, Starbucks Corp., KFC, Burger King, Pizza Hut, Domino, Dunkin Donuts LLC, and Taco Bell, further bolster the demand for food preservatives in the region. According to industry reports, the market is expected to witness significant growth, with the US accounting for a substantial market share.

Specifically, the market is projected to reach approximately 1.5 billion pounds by 2025, representing a steady increase from its current market size. Another study indicates that the market value is anticipated to surpass USD 3.5 billion by 2026. These figures underscore the market's potential and the continued importance of food preservatives in the North American food industry.

Market Dynamics

Our researchers analyzed the data with 2023 as the base year, along with the key drivers, trends, and challenges. A holistic analysis of drivers will help companies refine their marketing strategies to gain a competitive advantage.

The market is a dynamic and evolving industry that focuses on extending the shelf life and ensuring the safety of food products. The market is influenced by various factors, including the impact of packaging on food preservation, the effect of temperature on microbial growth, and consumer preferences for natural preservatives. Sodium benzoate and potassium sorbate are commonly used preservatives due to their efficacy in inhibiting microbial growth. Sodium benzoate functions by inhibiting the growth of yeasts and molds, while potassium sorbate exhibits antimicrobial properties against bacteria, yeasts, and molds. The preservation mechanism of these chemicals is essential in maintaining food quality and safety.

High-pressure processing and modified atmosphere packaging technology are emerging preservation methods that offer advantages over traditional preservation techniques. Hurdle technology, a combination of preservation methods, is gaining popularity due to its ability to provide enhanced food safety and extended shelf life. Consumer demand for natural preservatives has led to the exploration of alternative preservation methods, such as bacteriocin production and application, essential oils antimicrobial activity, chitosan films, edible coatings, plant extracts, and lactic acid bacteria antimicrobial action. These natural preservatives cater to the growing consumer preference for minimally processed and additive-free food products. The water activity and pH levels play a significant role in microbial growth, making them crucial factors in food preservation.

The food industry adheres to stringent chemical preservatives food safety regulations to ensure the safety and quality of food products. According to market intelligence, more than 60% of new product developments focus on natural preservatives, reflecting the growing consumer trend towards minimally processed and additive-free food products. This shift towards natural preservatives presents a significant opportunity for market participants to innovate and cater to evolving consumer preferences.

Food Preservatives Market Size

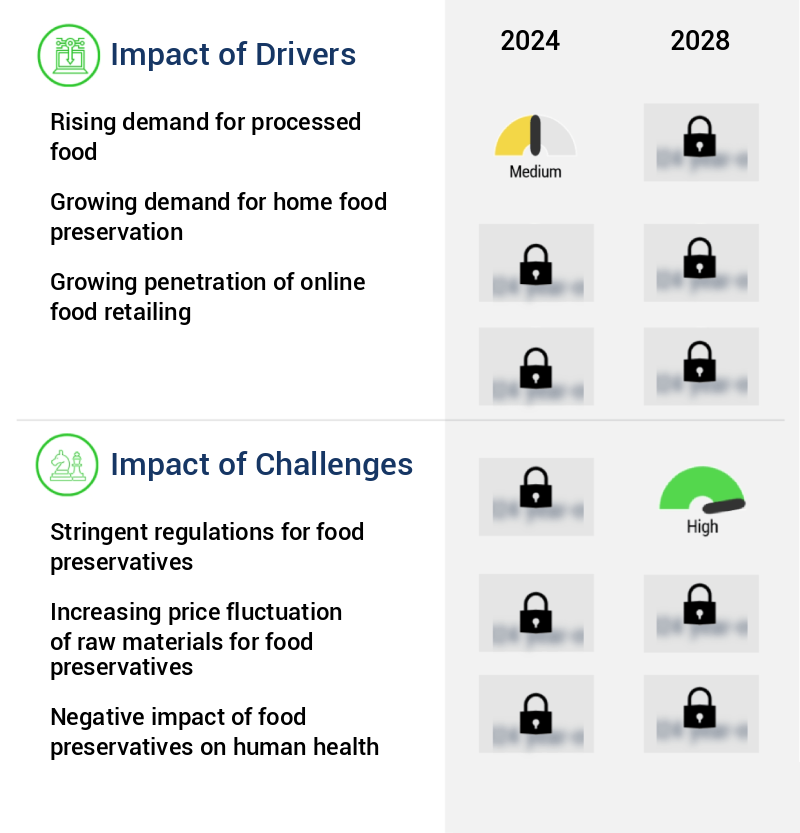
What are the key market drivers leading to the rise in the adoption of Food Preservatives Industry?

  • The surge in consumer preference for convenient and processed food items serves as the primary catalyst for market growth. 
  • The global market for food preservatives has experienced significant growth due to the increasing demand for packaged food products among consumers in both developed and developing countries. This trend can be attributed to improving economic conditions and rising disposable income levels, leading to a surge in the consumption of processed and packaged food items. Urbanization has also played a crucial role in shaping dietary habits, with the urbanized population showing a preference for convenient and long-lasting food solutions. As a result, the demand for frozen foods and packaged products has been on an upward trajectory for over a decade.
  • The expanding global middle class and the growing number of working women have further fueled the demand for processed foods, making the market a dynamic and evolving space. The market is a vital component of this industry, ensuring the longevity and safety of these products.

What are the market trends shaping the Food Preservatives Industry?

  • Consumer awareness is increasingly focusing on organic products as the latest market trend. Organic product consumption is gaining popularity.
  • The global market is witnessing a notable shift towards organic products, driven by increasing health consciousness and environmental concerns. Traditional, non-biodegradable items pose risks to both human health and the environment. In response, regulatory bodies and government agencies have enacted stringent regulations. This trend is influencing various industries, leading to a consumer preference for organic alternatives. Consequently, companies are transitioning their product lines to organic ingredients to cater to this growing demand and adhere to regulatory standards. The organic market's expansion is a significant development in the business landscape, reflecting a shift in consumer behavior and regulatory expectations.
  • This transition signifies a crucial step towards sustainable production and consumption patterns. Organizations must stay informed of this evolving market trend and adapt accordingly to remain competitive.

What challenges does the Food Preservatives Industry face during its growth?

  • The stringent regulations governing the use of food preservatives pose a significant challenge to the growth of the food industry. Adhering to these regulations adds complexity and cost to production processes, limiting the industry's ability to innovate and expand. Food companies must invest heavily in research and development to ensure their products meet the rigorous standards set by regulatory agencies, which can hinder their competitiveness in the market. 
  • In the market, regulatory compliance plays a crucial role in shaping industry dynamics. Food safety authorities in various regions set stringent standards for food preservative manufacturers. For instance, in the US, the Food and Drug Administration (FDA) enforces guidelines, while the European Food Safety Authority (EFSA) oversees regulations in the EU. Similarly, the Food Safety and Standards Authority of India (FSSAI) lays down certification parameters in India. These bodies ensure food preservatives meet safety standards, contributing to market growth.
  • According to a study, the market size was valued at USD 34.7 billion in 2020 and is projected to expand at a steady pace. This expansion is driven by increasing consumer awareness about food safety and the growing demand for convenience foods. Despite regulatory challenges, the market continues to evolve, with manufacturers focusing on developing innovative preservative solutions to cater to evolving consumer preferences.

Exclusive Customer Landscape

The food preservatives market forecasting report includes the adoption lifecycle of the market, covering from the innovator's stage to the laggard's stage. It focuses on adoption rates in different regions based on penetration. Furthermore, the food preservatives market report also includes key purchase criteria and drivers of price sensitivity to help companies evaluate and develop their market growth analysis strategies.

Food Preservatives Market Share by Geography

 Customer Landscape of Food Preservatives Industry

Competitive Landscape & Market Insights

Companies are implementing various strategies, such as strategic alliances, food preservatives market forecast, partnerships, mergers and acquisitions, geographical expansion, and product/service launches, to enhance their presence in the industry.

Archer Daniels Midland Co. - This company specializes in the production and supply of various food preservatives, including Citric Acid, Sodium Citrate, Potassium Citrate, and Citrisol. 

The industry research and growth report includes detailed analyses of the competitive landscape of the market and information about key companies, including:

  • Archer Daniels Midland Co.
  • Camlin Fine Sciences Ltd.
  • Cargill Inc.
  • Celanese Corp.
  • Chemical Corporation Inc.
  • Corbion nv
  • Foodchem International Corp.
  • Gadot Biochemical Industries Ltd.
  • Handary SA
  • Hawkins Watts Ltd.
  • Hemadri Chemicals
  • ITA 3 s.r.l.
  • Jungbunzlauer Suisse AG
  • Kalsec Inc.
  • Kemin Industries Inc.
  • Kerry Group Plc
  • Koninklijke DSM NV
  • RZBC Group Co. Ltd.
  • Tate and Lyle PLC
  • Yolimex Sdn Bhd

Qualitative and quantitative analysis of companies has been conducted to help clients understand the wider business environment as well as the strengths and weaknesses of key industry players. Data is qualitatively analyzed to categorize companies as pure play, category-focused, industry-focused, and diversified; it is quantitatively analyzed to categorize companies as dominant, leading, strong, tentative, and weak.

Recent Development and News in Food Preservatives Market

  • In January 2024, DuPont Nutrition & Biosciences, a leading food ingredients provider, launched a new line of natural preservatives, NatuGuard, in response to growing consumer demand for clean-label food products. (DuPont Nutrition & Biosciences Press Release)
  • In March 2024, Danisco A/S, a global leader in food ingredients, entered into a strategic partnership with Bio-Techne Corporation to expand its presence in the microbial control solutions market. This collaboration aimed to leverage Danisco's food preservatives expertise and Bio-Techne's advanced biotechnology capabilities. (Danisco A/S Press Release)
  • In May 2024, Kemin Industries, a leading provider of food and feed ingredients, announced the acquisition of Bio-Matech, a biotechnology company specializing in natural food preservatives. This acquisition was expected to significantly boost Kemin's product portfolio and strengthen its position in the market. (Kemin Industries Press Release)
  • In February 2025, the European Food Safety Authority (EFSA) approved the use of natamycin as a food preservative for a broader range of applications. This approval is expected to create new growth opportunities for companies offering natamycin-based food preservatives in Europe. (EFSA Press Release)

Dive into Technavio's robust research methodology, blending expert interviews, extensive data synthesis, and validated models for unparalleled Food Preservatives Market insights. See full methodology.

Market Scope

Report Coverage

Details

Page number

159

Base year

2023

Historic period

2018-2022

Forecast period

2024-2028

Growth momentum & CAGR

Accelerate at a CAGR of 3.2%

Market growth 2024-2028

USD 529.1 billion

Market structure

Fragmented

YoY growth 2023-2024(%)

3.06

Key countries

US, Malaysia, Indonesia, Germany, UK, South Korea, France, Canada, Brazil, Thailand, UAE, Mexico, China, Japan, and India

Competitive landscape

Leading Companies, Market Positioning of Companies, Competitive Strategies, and Industry Risks

Request Free Sample

Research Analyst Overview

  • The market is a dynamic and evolving industry, with ongoing research and innovation shaping its landscape. Natural preservatives, such as potassium sorbate, are increasingly gaining traction due to their sensory appeal and consumer preference for clean labels. Sensory evaluation plays a crucial role in assessing the efficacy of these preservatives, ensuring optimal food quality and safety. Hurdle technology, which combines multiple preservation methods like enzyme inhibition and modified atmosphere packaging, offers enhanced protection against spoilage microorganisms. Chitosan films and irradiation techniques are other emerging solutions, leveraging the properties of natural materials and advanced technologies, respectively, to extend shelf life.
  • Plant extracts and essential oils are also gaining popularity as natural alternatives to chemical preservatives. These natural preservatives exhibit fungal growth inhibition properties and contribute to the overall preservation efficacy. Packaging technology, such as pH control and edible coatings, further bolsters the preservation methods, ensuring microbial control and maintaining quality attributes. Competitive inhibition, achieved through the use of bacteriocins and nitrite curing, is another strategy employed in the market. Thermal processing and high-pressure processing are essential techniques for ensuring preservation efficacy, while lactic acid bacteria play a vital role in microbial inactivation and antioxidant activity.
  • Food safety regulations continue to evolve, driving the need for advanced preservation methods. Water activity control, a critical factor in food preservation, is a key focus area for researchers and manufacturers alike. By integrating various preservation methods and staying abreast of regulatory requirements, the market continues to adapt and innovate, ensuring the production of safe, high-quality food products. Sodium benzoate and acetic acid are commonly used chemical preservatives, contributing to bacterial growth inhibition and microbial control. However, the market is increasingly shifting towards natural alternatives, as consumer demand for clean label products continues to grow.
  • Overall, the market is a dynamic and evolving industry, driven by ongoing research, innovation, and regulatory requirements.

What are the Key Data Covered in this Food Preservatives Market Research and Growth Report?

  • What is the expected growth of the Food Preservatives Market between 2024 and 2028?

    • USD 529.1 billion, at a CAGR of 3.2%

  • What segmentation does the market report cover?

    • The report segmented by Product Type (Synthetic and Natural), Type (Anti-microbial, Antioxidant, and Others), Geography (North America, Europe, APAC, South America, and Middle East and Africa), and Application (Bakery, Meat and Poultry, Dairy, Beverages, and Confectionery)

  • Which regions are analyzed in the report?

    • North America, Europe, APAC, South America, and Middle East and Africa

  • What are the key growth drivers and market challenges?

    • Rising demand for processed food, Stringent regulations for food preservatives

  • Who are the major players in the Food Preservatives Market?

    • Key Companies Archer Daniels Midland Co., Camlin Fine Sciences Ltd., Cargill Inc., Celanese Corp., Chemical Corporation Inc., Corbion nv, Foodchem International Corp., Gadot Biochemical Industries Ltd., Handary SA, Hawkins Watts Ltd., Hemadri Chemicals, ITA 3 s.r.l., Jungbunzlauer Suisse AG, Kalsec Inc., Kemin Industries Inc., Kerry Group Plc, Koninklijke DSM NV, RZBC Group Co. Ltd., Tate and Lyle PLC, and Yolimex Sdn Bhd

Market Research Insights

  • The market encompasses a diverse range of ingredients and technologies employed to ensure product stability, microbial growth inhibition, and extended shelf life in the food industry. Two key areas of focus are ingredient interactions and packaging materials. According to industry estimates, The market was valued at USD 35 billion in 2020, with a projected growth rate of 4% annually. This growth is driven by increasing consumer demand for food safety, spoilage prevention, and foodborne pathogen control. Antimicrobial agents, such as sorbates and benzoates, are commonly used preservatives that inhibit microbial growth. For instance, sorbic acid, with a minimum inhibitory concentration of 0.1%, effectively inhibits the growth of yeast and molds.
  • In contrast, benzoic acid, at a minimum inhibitory concentration of 0.1%, primarily targets bacteria. The synergistic effects of combining these preservatives can lead to enhanced microbial load reduction and improved process optimization. However, preservation strategies face challenges such as sensory changes and contamination control. Novel preservation methods, like non-thermal processing and inhibition kinetics, are being explored to address these challenges and meet evolving consumer expectations for high-quality, shelf-stable products.

We can help! Our analysts can customize this food preservatives market research report to meet your requirements.

Get in touch

1 Executive Summary

  • 1.1 Market overview
    • Executive Summary - Chart on Market Overview
    • Executive Summary - Data Table on Market Overview
    • Executive Summary - Chart on Global Market Characteristics
    • Executive Summary - Chart on Market by Geography
    • Executive Summary - Chart on Market Segmentation by Product Type
    • Executive Summary - Chart on Market Segmentation by Type
    • Executive Summary - Chart on Incremental Growth
    • Executive Summary - Data Table on Incremental Growth
    • Executive Summary - Chart on Company Market Positioning

2 Market Landscape

  • 2.1 Market ecosystem
    • Parent Market
    • Data Table on - Parent Market
  • 2.2 Market characteristics
    • Market characteristics analysis
  • 2.3 Value chain analysis
    • Value Chain Analysis

3 Market Sizing

  • 3.1 Market definition
    • Offerings of companies included in the market definition
  • 3.2 Market segment analysis
    • Market segments
  • 3.3 Market size 2023
    • 3.4 Market outlook: Forecast for 2023-2028
      • Chart on Global - Market size and forecast 2023-2028 ($ billion)
      • Data Table on Global - Market size and forecast 2023-2028 ($ billion)
      • Chart on Global Market: Year-over-year growth 2023-2028 (%)
      • Data Table on Global Market: Year-over-year growth 2023-2028 (%)

    4 Historic Market Size

    • 4.1 Global Food Preservatives Market 2018 - 2022
      • Historic Market Size - Data Table on Global Food Preservatives Market 2018 - 2022 ($ billion)
    • 4.2 Product Type segment analysis 2018 - 2022
      • Historic Market Size - Product Type Segment 2018 - 2022 ($ billion)
    • 4.3 Type segment analysis 2018 - 2022
      • Historic Market Size - Type Segment 2018 - 2022 ($ billion)
    • 4.4 Geography segment analysis 2018 - 2022
      • Historic Market Size - Geography Segment 2018 - 2022 ($ billion)
    • 4.5 Country segment analysis 2018 - 2022
      • Historic Market Size - Country Segment 2018 - 2022 ($ billion)

    5 Five Forces Analysis

    • 5.1 Five forces summary
      • Five forces analysis - Comparison between 2023 and 2028
    • 5.2 Bargaining power of buyers
      • Bargaining power of buyers - Impact of key factors 2023 and 2028
    • 5.3 Bargaining power of suppliers
      • Bargaining power of suppliers - Impact of key factors in 2023 and 2028
    • 5.4 Threat of new entrants
      • Threat of new entrants - Impact of key factors in 2023 and 2028
    • 5.5 Threat of substitutes
      • Threat of substitutes - Impact of key factors in 2023 and 2028
    • 5.6 Threat of rivalry
      • Threat of rivalry - Impact of key factors in 2023 and 2028
    • 5.7 Market condition
      • Chart on Market condition - Five forces 2023 and 2028

    6 Market Segmentation by Product Type

    • 6.1 Market segments
      • Chart on Product Type - Market share (2023-2028) (%)
      • Data Table on Product Type - Market share (2023-2028) (%)
    • 6.2 Comparison by Product Type
      • Chart on Comparison by Product Type
      • Data Table on Comparison by Product Type
    • 6.3 Synthetic - Market size and forecast (2023-2028)
      • Chart on Synthetic - Market size and forecast (2023-2028) ($ billion)
      • Data Table on Synthetic - Market size and forecast (2023-2028) ($ billion)
      • Chart on Synthetic - Year-over-year growth (2023-2028) (%)
      • Data Table on Synthetic - Year-over-year growth (2023-2028) (%)
    • 6.4 Natural - Market size and forecast (2023-2028)
      • Chart on Natural - Market size and forecast (2023-2028) ($ billion)
      • Data Table on Natural - Market size and forecast (2023-2028) ($ billion)
      • Chart on Natural - Year-over-year growth (2023-2028) (%)
      • Data Table on Natural - Year-over-year growth (2023-2028) (%)
    • 6.5 Market opportunity by Product Type
      • Market opportunity by Product Type ($ billion)
      • Data Table on Market opportunity by Product Type ($ billion)

    7 Market Segmentation by Type

    • 7.1 Market segments
      • Chart on Type - Market share (2023-2028) (%)
      • Data Table on Type - Market share (2023-2028) (%)
    • 7.2 Comparison by Type
      • Chart on Comparison by Type
      • Data Table on Comparison by Type
    • 7.3 Anti-microbial - Market size and forecast (2023-2028)
      • Chart on Anti-microbial - Market size and forecast (2023-2028) ($ billion)
      • Data Table on Anti-microbial - Market size and forecast (2023-2028) ($ billion)
      • Chart on Anti-microbial - Year-over-year growth (2023-2028) (%)
      • Data Table on Anti-microbial - Year-over-year growth (2023-2028) (%)
    • 7.4 Antioxidant - Market size and forecast (2023-2028)
      • Chart on Antioxidant - Market size and forecast (2023-2028) ($ billion)
      • Data Table on Antioxidant - Market size and forecast (2023-2028) ($ billion)
      • Chart on Antioxidant - Year-over-year growth (2023-2028) (%)
      • Data Table on Antioxidant - Year-over-year growth (2023-2028) (%)
    • 7.5 Others - Market size and forecast (2023-2028)
      • Chart on Others - Market size and forecast (2023-2028) ($ billion)
      • Data Table on Others - Market size and forecast (2023-2028) ($ billion)
      • Chart on Others - Year-over-year growth (2023-2028) (%)
      • Data Table on Others - Year-over-year growth (2023-2028) (%)
    • 7.6 Market opportunity by Type
      • Market opportunity by Type ($ billion)
      • Data Table on Market opportunity by Type ($ billion)

    8 Market Segmentation by Application

    • 8.1 Market segments
      • Chart on Application - Market share (2023-2028) (%)
      • Data Table on Application - Market share (2023-2028) (%)
    • 8.2 Comparison by Application
      • Chart on Comparison by Application
      • Data Table on Comparison by Application
    • 8.3 Bakery - Market size and forecast (2023-2028)
      • Chart on Bakery - Market size and forecast (2023-2028) ($ billion)
      • Data Table on Bakery - Market size and forecast (2023-2028) ($ billion)
      • Chart on Bakery - Year-over-year growth (2023-2028) (%)
      • Data Table on Bakery - Year-over-year growth (2023-2028) (%)
    • 8.4 Meat and Poultry - Market size and forecast (2023-2028)
      • Chart on Meat and Poultry - Market size and forecast (2023-2028) ($ billion)
      • Data Table on Meat and Poultry - Market size and forecast (2023-2028) ($ billion)
      • Chart on Meat and Poultry - Year-over-year growth (2023-2028) (%)
      • Data Table on Meat and Poultry - Year-over-year growth (2023-2028) (%)
    • 8.5 Dairy - Market size and forecast (2023-2028)
      • Chart on Dairy - Market size and forecast (2023-2028) ($ billion)
      • Data Table on Dairy - Market size and forecast (2023-2028) ($ billion)
      • Chart on Dairy - Year-over-year growth (2023-2028) (%)
      • Data Table on Dairy - Year-over-year growth (2023-2028) (%)
    • 8.6 Beverages - Market size and forecast (2023-2028)
      • Chart on Beverages - Market size and forecast (2023-2028) ($ billion)
      • Data Table on Beverages - Market size and forecast (2023-2028) ($ billion)
      • Chart on Beverages - Year-over-year growth (2023-2028) (%)
      • Data Table on Beverages - Year-over-year growth (2023-2028) (%)
    • 8.7 Confectionery - Market size and forecast (2023-2028)
      • Chart on Confectionery - Market size and forecast (2023-2028) ($ billion)
      • Data Table on Confectionery - Market size and forecast (2023-2028) ($ billion)
      • Chart on Confectionery - Year-over-year growth (2023-2028) (%)
      • Data Table on Confectionery - Year-over-year growth (2023-2028) (%)
    • 8.8 Market opportunity by Application
      • Market opportunity by Application ($ billion)
      • Data Table on Market opportunity by Application ($ billion)

    9 Customer Landscape

    • 9.1 Customer landscape overview
      • Analysis of price sensitivity, lifecycle, customer purchase basket, adoption rates, and purchase criteria

    10 Geographic Landscape

    • 10.1 Geographic segmentation
      • Chart on Market share by geography 2023-2028 (%)
      • Data Table on Market share by geography 2023-2028 (%)
    • 10.2 Geographic comparison
      • Chart on Geographic comparison
      • Data Table on Geographic comparison
    • 10.3 North America - Market size and forecast 2023-2028
      • Chart on North America - Market size and forecast 2023-2028 ($ billion)
      • Data Table on North America - Market size and forecast 2023-2028 ($ billion)
      • Chart on North America - Year-over-year growth 2023-2028 (%)
      • Data Table on North America - Year-over-year growth 2023-2028 (%)
    • 10.4 Europe - Market size and forecast 2023-2028
      • Chart on Europe - Market size and forecast 2023-2028 ($ billion)
      • Data Table on Europe - Market size and forecast 2023-2028 ($ billion)
      • Chart on Europe - Year-over-year growth 2023-2028 (%)
      • Data Table on Europe - Year-over-year growth 2023-2028 (%)
    • 10.5 APAC - Market size and forecast 2023-2028
      • Chart on APAC - Market size and forecast 2023-2028 ($ billion)
      • Data Table on APAC - Market size and forecast 2023-2028 ($ billion)
      • Chart on APAC - Year-over-year growth 2023-2028 (%)
      • Data Table on APAC - Year-over-year growth 2023-2028 (%)
    • 10.6 South America - Market size and forecast 2023-2028
      • Chart on South America - Market size and forecast 2023-2028 ($ billion)
      • Data Table on South America - Market size and forecast 2023-2028 ($ billion)
      • Chart on South America - Year-over-year growth 2023-2028 (%)
      • Data Table on South America - Year-over-year growth 2023-2028 (%)
    • 10.7 Middle East and Africa - Market size and forecast 2023-2028
      • Chart on Middle East and Africa - Market size and forecast 2023-2028 ($ billion)
      • Data Table on Middle East and Africa - Market size and forecast 2023-2028 ($ billion)
      • Chart on Middle East and Africa - Year-over-year growth 2023-2028 (%)
      • Data Table on Middle East and Africa - Year-over-year growth 2023-2028 (%)
    • 10.8 US - Market size and forecast 2023-2028
      • Chart on US - Market size and forecast 2023-2028 ($ billion)
      • Data Table on US - Market size and forecast 2023-2028 ($ billion)
      • Chart on US - Year-over-year growth 2023-2028 (%)
      • Data Table on US - Year-over-year growth 2023-2028 (%)
    • 10.9 China - Market size and forecast 2023-2028
      • Chart on China - Market size and forecast 2023-2028 ($ billion)
      • Data Table on China - Market size and forecast 2023-2028 ($ billion)
      • Chart on China - Year-over-year growth 2023-2028 (%)
      • Data Table on China - Year-over-year growth 2023-2028 (%)
    • 10.10 Germany - Market size and forecast 2023-2028
      • Chart on Germany - Market size and forecast 2023-2028 ($ billion)
      • Data Table on Germany - Market size and forecast 2023-2028 ($ billion)
      • Chart on Germany - Year-over-year growth 2023-2028 (%)
      • Data Table on Germany - Year-over-year growth 2023-2028 (%)
    • 10.11 Canada - Market size and forecast 2023-2028
      • Chart on Canada - Market size and forecast 2023-2028 ($ billion)
      • Data Table on Canada - Market size and forecast 2023-2028 ($ billion)
      • Chart on Canada - Year-over-year growth 2023-2028 (%)
      • Data Table on Canada - Year-over-year growth 2023-2028 (%)
    • 10.12 UK - Market size and forecast 2023-2028
      • Chart on UK - Market size and forecast 2023-2028 ($ billion)
      • Data Table on UK - Market size and forecast 2023-2028 ($ billion)
      • Chart on UK - Year-over-year growth 2023-2028 (%)
      • Data Table on UK - Year-over-year growth 2023-2028 (%)
    • 10.13 Market opportunity by geography
      • Market opportunity by geography ($ billion)
      • Data Tables on Market opportunity by geography ($ billion)
    • 10.14 US - Market size and forecast (2023-2028)
      • Chart on US - Market size and forecast (2023-2028) ($ billion)
      • Data Table on US - Market size and forecast (2023-2028) ($ billion)
      • Chart on US - Year-over-year growth (2023-2028) (%)
      • Data Table on US - Year-over-year growth (2023-2028) (%)
    • 10.15 Malaysia - Market size and forecast (2023-2028)
      • Chart on Malaysia - Market size and forecast (2023-2028) ($ billion)
      • Data Table on Malaysia - Market size and forecast (2023-2028) ($ billion)
      • Chart on Malaysia - Year-over-year growth (2023-2028) (%)
      • Data Table on Malaysia - Year-over-year growth (2023-2028) (%)
    • 10.16 Indonesia - Market size and forecast (2023-2028)
      • Chart on Indonesia - Market size and forecast (2023-2028) ($ billion)
      • Data Table on Indonesia - Market size and forecast (2023-2028) ($ billion)
      • Chart on Indonesia - Year-over-year growth (2023-2028) (%)
      • Data Table on Indonesia - Year-over-year growth (2023-2028) (%)
    • 10.17 South Korea - Market size and forecast (2023-2028)
      • Chart on South Korea - Market size and forecast (2023-2028) ($ billion)
      • Data Table on South Korea - Market size and forecast (2023-2028) ($ billion)
      • Chart on South Korea - Year-over-year growth (2023-2028) (%)
      • Data Table on South Korea - Year-over-year growth (2023-2028) (%)
    • 10.18 France - Market size and forecast (2023-2028)
      • Chart on France - Market size and forecast (2023-2028) ($ billion)
      • Data Table on France - Market size and forecast (2023-2028) ($ billion)
      • Chart on France - Year-over-year growth (2023-2028) (%)
      • Data Table on France - Year-over-year growth (2023-2028) (%)
    • 10.19 Brazil - Market size and forecast (2023-2028)
      • Chart on Brazil - Market size and forecast (2023-2028) ($ billion)
      • Data Table on Brazil - Market size and forecast (2023-2028) ($ billion)
      • Chart on Brazil - Year-over-year growth (2023-2028) (%)
      • Data Table on Brazil - Year-over-year growth (2023-2028) (%)
    • 10.20 Thailand - Market size and forecast (2023-2028)
      • Chart on Thailand - Market size and forecast (2023-2028) ($ billion)
      • Data Table on Thailand - Market size and forecast (2023-2028) ($ billion)
      • Chart on Thailand - Year-over-year growth (2023-2028) (%)
      • Data Table on Thailand - Year-over-year growth (2023-2028) (%)
    • 10.21 UAE - Market size and forecast (2023-2028)
      • Chart on UAE - Market size and forecast (2023-2028) ($ billion)
      • Data Table on UAE - Market size and forecast (2023-2028) ($ billion)
      • Chart on UAE - Year-over-year growth (2023-2028) (%)
      • Data Table on UAE - Year-over-year growth (2023-2028) (%)
    • 10.22 Mexico - Market size and forecast (2023-2028)
      • Chart on Mexico - Market size and forecast (2023-2028) ($ billion)
      • Data Table on Mexico - Market size and forecast (2023-2028) ($ billion)
      • Chart on Mexico - Year-over-year growth (2023-2028) (%)
      • Data Table on Mexico - Year-over-year growth (2023-2028) (%)
    • 10.23 Japan - Market size and forecast (2023-2028)
      • Chart on Japan - Market size and forecast (2023-2028) ($ billion)
      • Data Table on Japan - Market size and forecast (2023-2028) ($ billion)
      • Chart on Japan - Year-over-year growth (2023-2028) (%)
      • Data Table on Japan - Year-over-year growth (2023-2028) (%)
    • 10.24 India - Market size and forecast (2023-2028)
      • Chart on India - Market size and forecast (2023-2028) ($ billion)
      • Data Table on India - Market size and forecast (2023-2028) ($ billion)
      • Chart on India - Year-over-year growth (2023-2028) (%)
      • Data Table on India - Year-over-year growth (2023-2028) (%)
    • 10.25 Rest of World (ROW) - Market size and forecast (2023-2028)
      • Chart on Rest of World (ROW) - Market size and forecast (2023-2028) ($ billion)
      • Data Table on Rest of World (ROW) - Market size and forecast (2023-2028) ($ billion)
      • Chart on Rest of World (ROW) - Year-over-year growth (2023-2028) (%)
      • Data Table on Rest of World (ROW) - Year-over-year growth (2023-2028) (%)

    11 Drivers, Challenges, and Opportunity/Restraints

    • 11.1 Market drivers
      • 11.2 Market challenges
        • 11.3 Impact of drivers and challenges
          • Impact of drivers and challenges in 2023 and 2028
        • 11.4 Market opportunities/restraints

          12 Competitive Landscape

          • 12.1 Overview
            • 12.2 Competitive Landscape
              • Overview on criticality of inputs and factors of differentiation
            • 12.3 Landscape disruption
              • Overview on factors of disruption
            • 12.4 Industry risks
              • Impact of key risks on business

            13 Competitive Analysis

            • 13.1 Companies profiled
              • Companies covered
            • 13.2 Market positioning of companies
              • Matrix on companies position and classification
            • 13.3 Archer Daniels Midland Co.
              • Archer Daniels Midland Co. - Overview
              • Archer Daniels Midland Co. - Business segments
              • Archer Daniels Midland Co. - Key news
              • Archer Daniels Midland Co. - Key offerings
              • Archer Daniels Midland Co. - Segment focus
            • 13.4 Cargill Inc.
              • Cargill Inc. - Overview
              • Cargill Inc. - Product / Service
              • Cargill Inc. - Key news
              • Cargill Inc. - Key offerings
            • 13.5 Celanese Corp.
              • Celanese Corp. - Overview
              • Celanese Corp. - Business segments
              • Celanese Corp. - Key news
              • Celanese Corp. - Key offerings
              • Celanese Corp. - Segment focus
            • 13.6 Chemical Corporation Inc.
              • Chemical Corporation Inc. - Overview
              • Chemical Corporation Inc. - Product / Service
              • Chemical Corporation Inc. - Key offerings
            • 13.7 Corbion nv
              • Corbion nv - Overview
              • Corbion nv - Business segments
              • Corbion nv - Key news
              • Corbion nv - Key offerings
              • Corbion nv - Segment focus
            • 13.8 Hawkins Watts Ltd.
              • Hawkins Watts Ltd. - Overview
              • Hawkins Watts Ltd. - Product / Service
              • Hawkins Watts Ltd. - Key offerings
            • 13.9 Hemadri Chemicals
              • Hemadri Chemicals - Overview
              • Hemadri Chemicals - Product / Service
              • Hemadri Chemicals - Key offerings
            • 13.10 ITA 3 s.r.l.
              • ITA 3 s.r.l. - Overview
              • ITA 3 s.r.l. - Product / Service
              • ITA 3 s.r.l. - Key offerings
            • 13.11 Kalsec Inc.
              • Kalsec Inc. - Overview
              • Kalsec Inc. - Product / Service
              • Kalsec Inc. - Key offerings
            • 13.12 Kemin Industries Inc.
              • Kemin Industries Inc. - Overview
              • Kemin Industries Inc. - Product / Service
              • Kemin Industries Inc. - Key news
              • Kemin Industries Inc. - Key offerings
            • 13.13 Kerry Group Plc
              • Kerry Group Plc - Overview
              • Kerry Group Plc - Business segments
              • Kerry Group Plc - Key news
              • Kerry Group Plc - Key offerings
              • Kerry Group Plc - Segment focus
            • 13.14 Koninklijke DSM NV
              • Koninklijke DSM NV - Overview
              • Koninklijke DSM NV - Business segments
              • Koninklijke DSM NV - Key news
              • Koninklijke DSM NV - Key offerings
              • Koninklijke DSM NV - Segment focus
            • 13.15 RZBC Group Co. Ltd.
              • RZBC Group Co. Ltd. - Overview
              • RZBC Group Co. Ltd. - Product / Service
              • RZBC Group Co. Ltd. - Key offerings
            • 13.16 Tate and Lyle PLC
              • Tate and Lyle PLC - Overview
              • Tate and Lyle PLC - Business segments
              • Tate and Lyle PLC - Key news
              • Tate and Lyle PLC - Key offerings
              • Tate and Lyle PLC - Segment focus
            • 13.17 Yolimex Sdn Bhd
              • Yolimex Sdn Bhd - Overview
              • Yolimex Sdn Bhd - Product / Service
              • Yolimex Sdn Bhd - Key offerings

            14 Appendix

            • 14.1 Scope of the report
              • 14.2 Inclusions and exclusions checklist
                • Inclusions checklist
                • Exclusions checklist
              • 14.3 Currency conversion rates for US$
                • Currency conversion rates for US$
              • 14.4 Research methodology
                • Research methodology
              • 14.5 Data procurement
                • Information sources
              • 14.6 Data validation
                • Data validation
              • 14.7 Validation techniques employed for market sizing
                • Validation techniques employed for market sizing
              • 14.8 Data synthesis
                • Data synthesis
              • 14.9 360 degree market analysis
                • 360 degree market analysis
              • 14.10 List of abbreviations
                • List of abbreviations

              Research Methodology

              Technavio presents a detailed picture of the market by way of study, synthesis, and summation of data from multiple sources. The analysts have presented the various facets of the market with a particular focus on identifying the key industry influencers. The data thus presented is comprehensive, reliable, and the result of extensive research, both primary and secondary.

              INFORMATION SOURCES

              Primary sources

              • Manufacturers and suppliers
              • Channel partners
              • Industry experts
              • Strategic decision makers

              Secondary sources

              • Industry journals and periodicals
              • Government data
              • Financial reports of key industry players
              • Historical data
              • Press releases

              DATA ANALYSIS

              Data Synthesis

              • Collation of data
              • Estimation of key figures
              • Analysis of derived insights

              Data Validation

              • Triangulation with data models
              • Reference against proprietary databases
              • Corroboration with industry experts

              REPORT WRITING

              Qualitative

              • Market drivers
              • Market challenges
              • Market trends
              • Five forces analysis

              Quantitative

              • Market size and forecast
              • Market segmentation
              • Geographical insights
              • Competitive landscape

              Interested in this report?

              Get your sample now to see our research methodology and insights!

              Download Now

              Frequently Asked Questions

              Food Preservatives market growth will increase by $ 529.1 bn during 2024-2028 .

              The Food Preservatives market is expected to grow at a CAGR of 3.2% during 2024-2028 .

              Food Preservatives market is segmented by Product Type( Synthetic, Natural) Type( Anti-microbial, Antioxidant, Others)

              Archer Daniels Midland Co., Camlin Fine Sciences Ltd., Cargill Inc., Celanese Corp., Chemical Corporation Inc., Corbion nv, Foodchem International Corp., Gadot Biochemical Industries Ltd., Handary SA, Hawkins Watts Ltd., Hemadri Chemicals, ITA 3 s.r.l., Jungbunzlauer Suisse AG, Kalsec Inc., Kemin Industries Inc., Kerry Group Plc, Koninklijke DSM NV, RZBC Group Co. Ltd., Tate and Lyle PLC, Yolimex Sdn Bhd are a few of the key vendors in the Food Preservatives market.

              APAC will register the highest growth rate of 29% among the other regions. Therefore, the Food Preservatives market in APAC is expected to garner significant business opportunities for the vendors during the forecast period.

              US, Malaysia, Indonesia, Germany, UK, South Korea, France, Canada, Brazil, Thailand, UAE, Mexico, China, Japan, India

              • Rising demand for processed foodA rise in the demand for packaged food products among consumers across developed and developing countries has propelled the demand for food preservatives. With improving economic conditions and increasing disposable income levels in developed and developing nations is the driving factor this market.
              • the global demand for packaged food and processed food has been increasing. In addition is the driving factor this market.
              • the demand for frozen foods and packaged products has been on the rise for the past decade. Urbanization has resulted in evolved dietary habits. The urbanized global population is inclined toward packaged food products and frozen food materials. An expanding global middle class and an increase in the number of working women contribute to the high demand for processed foods. A long shelf-life is a key marketing aspect for frozen foods. Frozen-food manufacturers employ innovative ways to improve the shelf lives of frozen food products. There is an increase in the use of preservatives in frozen food products. The aforementioned factors act as driving forces for the growth of the global food preservatives market during the forecast period. is the driving factor this market.

              The Food Preservatives market vendors should focus on grabbing business opportunities from the Synthetic segment as it accounted for the largest market share in the base year.