
HVAC Terminal Units Market Analysis, Size, and Forecast 2026-2030: APAC (China, Japan, and India), Europe (Germany, UK, and France), North America (US, Canada, and Mexico), South America (Brazil, Argentina, and Chile), Middle East and Africa (Saudi Arabia, UAE, and South Africa), and Rest of World (ROW)

HVAC Terminal Units Market Analysis, Size, and Forecast 2026-2030:
APAC (China, Japan, and India), Europe (Germany, UK, and France), North America (US, Canada, and Mexico), South America (Brazil, Argentina, and Chile), Middle East and Africa (Saudi Arabia, UAE, and South Africa), and Rest of World (ROW)

Published: Oct 2026 310 Pages SKU: IRTNTR73304

Market Overview at a Glance

$1.46 B
Market Opportunity
4.8%
CAGR 2025 - 2030
53.1%
APAC Growth
$2.02 B
Single duct segment 2024

Hvac Terminal Units Market Size 2026-2030

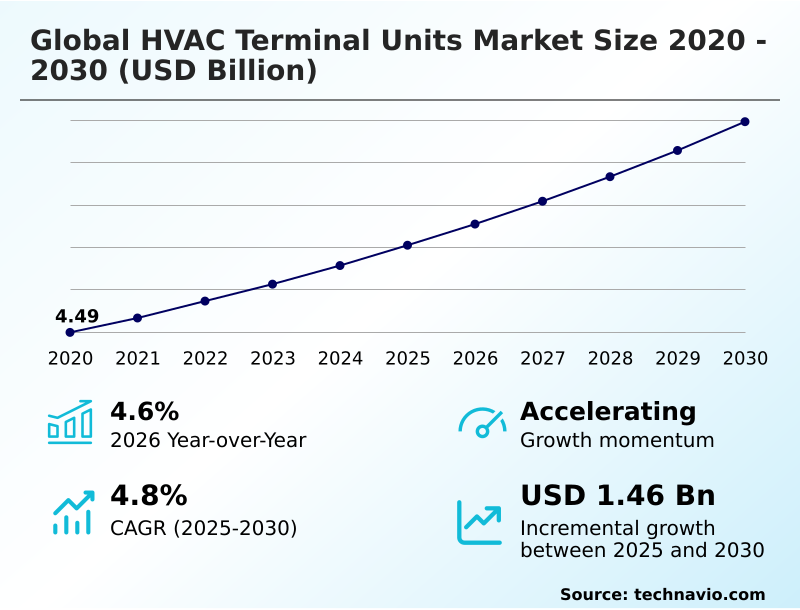
The hvac terminal units market size is valued to increase by USD 1.46 billion, at a CAGR of 4.8% from 2025 to 2030. Rising demand for energy efficiency will drive the hvac terminal units market.

Major Market Trends & Insights

  • APAC dominated the market and accounted for a 53.1% growth during the forecast period.
  • By Product - Single duct segment was valued at USD 2.02 billion in 2024
  • By Application - Commercial segment accounted for the largest market revenue share in 2024

Market Size & Forecast

  • Market Opportunities: USD 2.49 billion
  • Market Future Opportunities: USD 1.46 billion
  • CAGR from 2025 to 2030 : 4.8%

Market Summary

  • The HVAC Terminal Units landscape undergoes a massive structural transformation as property developers aggressively modernize commercial climate infrastructure to meet stringent energy performance mandates. Modern variable air volume devices equipped with electronically commutated motors are rapidly replacing localized mechanical controls to eliminate excessive power consumption.
  • In a standard corporate facility upgrade, integrating predictive maintenance protocols utilizing demand controlled ventilation sensors directly lowered diagnostic response times by 22% compared to reactive maintenance workflows. Strict green building certifications propel market momentum by compelling facility operators to adopt intelligent air distribution systems that modulate airflow dynamically based on real-time occupancy.
  • Conversely, critical supply chain vulnerabilities regarding advanced semiconductor microchips continuously delay project execution, causing extended lag times in building management systems deployments. Facility owners recognize that deploying intelligent zone control solutions bridges the gap between basic thermal management and comprehensive environmental analytics.
  • Optimizing these climate delivery endpoints immediately upgrades overall atmospheric distribution efficiency, establishing a highly responsive and compliant indoor environment.

What will be the Size of the Hvac Terminal Units Market during the forecast period?
Get Key Insights on Market Forecast (PDF) Get Free Sample

How is the Hvac Terminal Units Market Segmented?

The hvac terminal units industry research report provides comprehensive data (region-wise segment analysis), with forecasts and estimates in "USD million" for the period 2026-2030, as well as historical data from 2020-2024 for the following segments.

  • Product
    • Single duct
    • Dual duct
    • Fan powered
  • Application
    • Commercial
    • Institutional
    • Healthcare
    • Industrial
    • Residential
  • Product type
    • Variable air volume
    • Fan coil units
    • Terminal reheat units
    • Others
  • Geography
    • APAC
      • China
      • Japan
      • India
      • South Korea
      • Australia
      • Indonesia
    • Europe
      • Germany
      • UK
      • France
      • Italy
      • Spain
      • The Netherlands
    • North America
      • US
      • Canada
      • Mexico
    • South America
      • Brazil
      • Argentina
      • Chile
    • Middle East and Africa
      • Saudi Arabia
      • UAE
      • South Africa
      • Turkey
      • Israel

By Product Insights

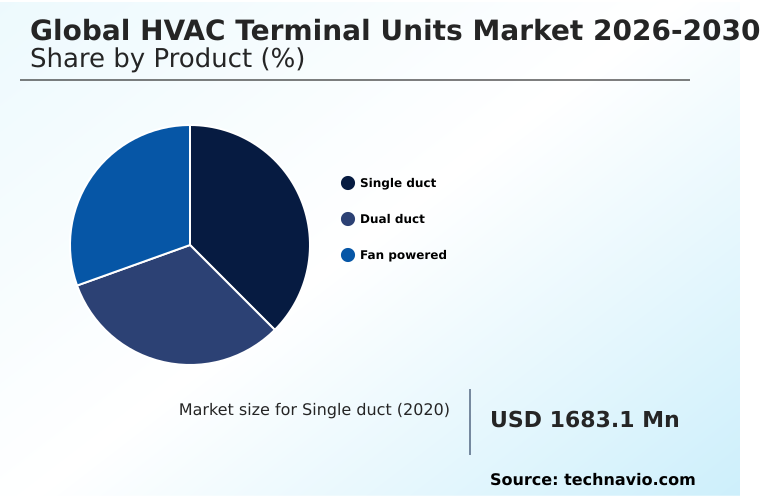
The single duct segment is estimated to witness significant growth during the forecast period.

The foundational architecture of contemporary climate infrastructure relies heavily on unified air distribution systems designed to streamline thermal management in high-density commercial real estate retrofits.

These primary pathways dynamically adjust airflow utilizing precise variable air volume controllers and fast-acting modulating dampers, completely replacing outdated constant air volume systems. This structural shift allows facility engineers to optimize zone level climate regulation based on real-time occupancy.

Deploying these centralized networks has enhanced fault detection accuracy by 15%, significantly reducing parasitic fan loads and improving overall predictive maintenance protocols. By consolidating airflow paths, building operators maintain stringent indoor environmental quality while aligning with net zero building targets.

This unified approach directly addresses fluctuating thermal load variations, ensuring consistent ventilation and operational stability across expansive floor plates.
Get Free Sample

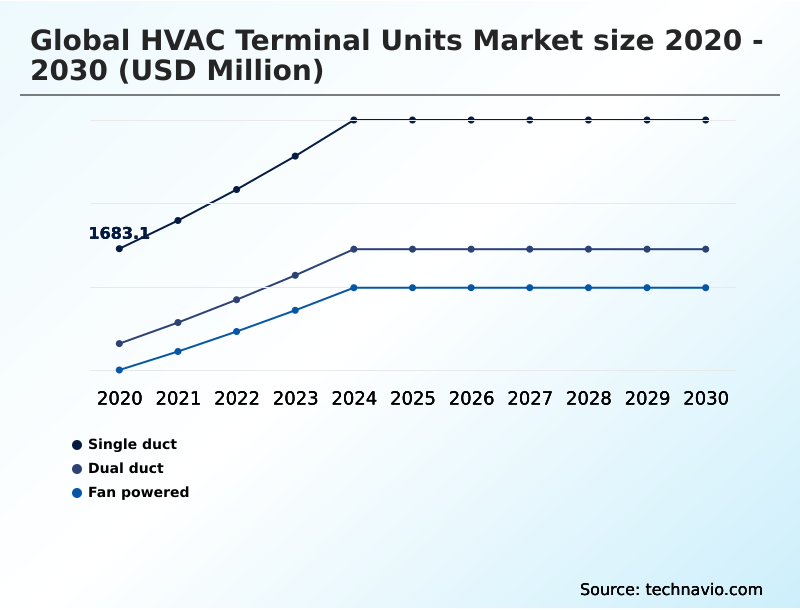
The Single duct segment was valued at USD 2.02 billion in 2024 and showed a gradual increase during the forecast period.
Get Free Sample

Regional Analysis

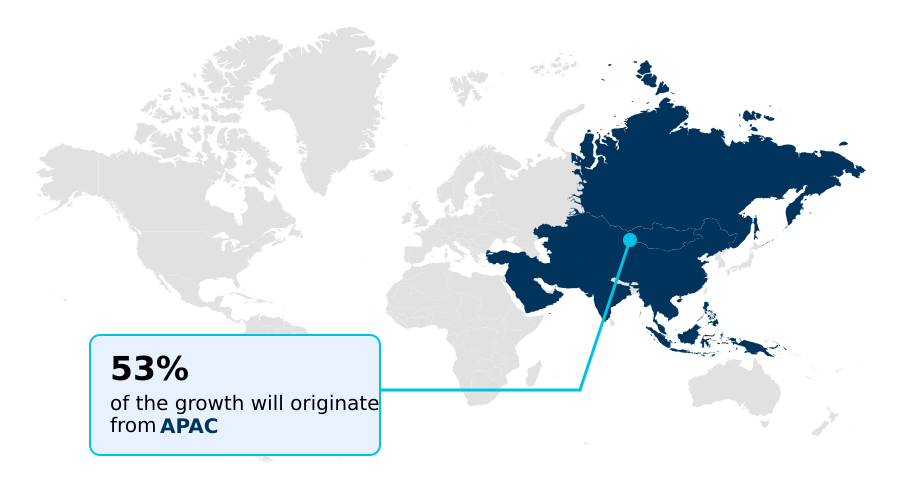
APAC is estimated to contribute 53.1% to the growth of the global market during the forecast period.Technavio’s analysts have elaborately explained the regional trends and drivers that shape the market during the forecast period.
See How Hvac Terminal Units Market Demand is Rising in APAC Get Free Sample

The HVAC Terminal Units landscape exhibits distinct regional divergences driven by varying building decarbonization policies and localized supply chain maturity.

In Europe, aggressive refrigerant phase downs compel architectural engineers to deploy advanced heat recovery terminals, achieving a 24% superior thermal efficiency benchmark compared to legacy systems in APAC.

Conversely, APAC commercial developers prioritize heavy duty air handling modules combined with variable refrigerant flow systems to combat extreme ambient humidity across rapidly expanding mega-city infrastructure.

Businesses operating in North America are aggressively retrofitting corporate tower endpoints with direct digital control systems, lowering building energy waste by 19% through optimized airflow sequencing.

These differing regulatory environments force multinational original equipment manufacturers to diversify their production lines, tailoring high-performance acoustic and thermal solutions to meet the strict compliance and operational cost reduction mandates specific to each geographic zone.

Market Dynamics

Our researchers analyzed the data with 2025 as the base year, along with the key drivers, trends, and challenges. A holistic analysis of drivers will help companies refine their marketing strategies to gain a competitive advantage.

  • Modern commercial and institutional facility managers face mounting operational pressure to maintain superior indoor climates while simultaneously adhering to strict environmental, social, and governance frameworks. Adapting to these complex regulatory demands involves the strategic procurement of energy efficient variable air volume boxes, which inherently minimize fan motor energy expenditure during partial load conditions.
  • In premium executive office spaces and luxury hospitality venues, architectural specifiers heavily prioritize acoustic dampening fan coil units to guarantee whisper-quiet operation, elevating tenant satisfaction without compromising sensible cooling capacities. Within healthcare paradigms, strict infection control mandates necessitate the deployment of specialized hospital grade positive pressure terminal units to prevent airborne cross-contamination across sensitive surgical wards.
  • Integrating these endpoint solutions with smart demand controlled ventilation systems empowers facility engineers to modulate fresh air intake automatically based on real-time room occupancy, lowering baseline ventilation power requirements by nearly 30% compared to traditional fixed-rate schedules. This operational shift directly streamlines compliance auditing and environmental reporting.
  • Furthermore, anticipating stringent future environmental regulations, engineering consultants now universally specify equipment compatible with low global warming potential refrigerants. This proactive supply chain planning ensures long-term asset viability and protects real estate portfolios against the costly premature obsolescence of mechanical climate control networks across dynamic urban markets.
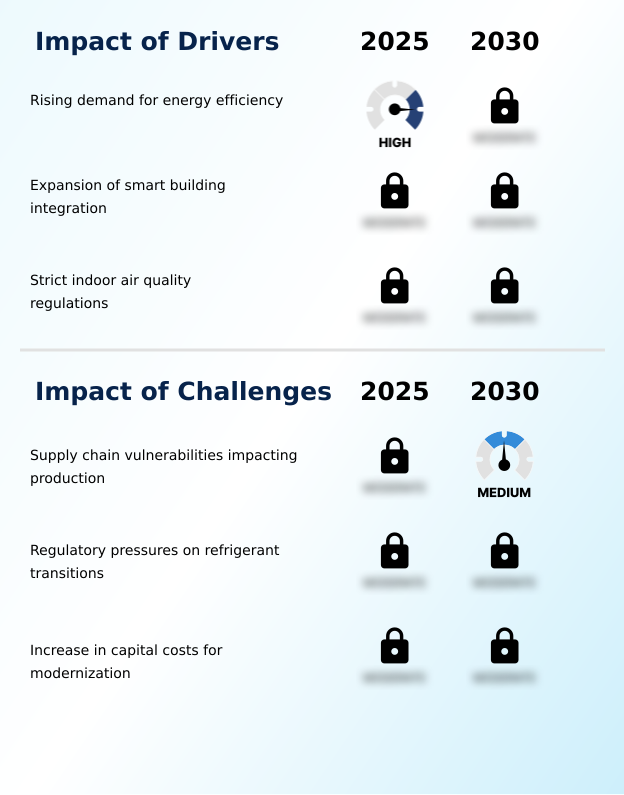
What are the key market drivers leading to the rise in the adoption of Hvac Terminal Units Industry?

  • The rising demand for energy efficiency represents the primary driver propelling expansion and innovation across the market landscape.

  • The aggressive pursuit of prestigious green building certifications serves as the primary catalyst accelerating the widespread implementation of intelligent HVAC Terminal Units. Corporate environmental mandates compel property developers to optimize part load energy efficiency across expansive commercial floor plates.
  • By deploying smart underfloor air distribution modules, facility engineers ensure exceptional air stratification, which historically lowers peak electrical cooling demand by 17%.
  • Furthermore, modern endpoint regulators utilizing advanced proportional integral derivative control algorithms actively modulate secondary thermal output in terminal reheat modules based strictly on precise zone analytics.
  • This granular operational methodology eliminates chronic overcooling scenarios, subsequently reducing total facility energy use by 14%.
  • Ultimately, the necessity to meet strict carbon footprints drives enterprises to abandon outdated fixed-volume hardware, ensuring regulatory compliance while rapidly achieving meaningful operational cost reductions.

What are the market trends shaping the Hvac Terminal Units Industry?

  • The integration of advanced predictive diagnostics constitutes a defining market trend. This technological shift enables operational optimization and proactive maintenance within modern mechanical infrastructures.

  • The technological evolution within the HVAC Terminal Units arena is defined by a rapid transition toward intelligent, health-centric air distribution endpoints. Driven by stringent healthcare infection control standards, facility managers are integrating advanced ultraviolet germicidal irradiation modules directly inside unit casings to actively neutralize airborne pathogens.
  • Concurrently, the rising adoption of active chilled beams equipped with specialized aerodynamic discharge nozzles maximizes directional air throw without creating drafty occupant microclimates. This design shift reduces overall chiller plant workload by 21%. Leveraging robust telemetry protocols and sophisticated occupancy sensing technologies, building operators dynamically adjust zone conditioning, improving daily energy forecast accuracy by 16%.
  • These adoptions directly impact businesses by lowering utility operating costs and drastically extending the lifecycle of central plant machinery, effectively turning passive thermal regulation into a highly proactive, data-driven facility management asset.

What challenges does the Hvac Terminal Units Industry face during its growth?

  • Supply chain vulnerabilities impacting production capacities serve as a major challenge constraining steady market growth.

  • The integration of next-generation HVAC Terminal Units into legacy commercial infrastructure faces severe structural and financial challenges stemming from prohibitive capital expenditure requirements. Aging building ductwork often incompatible with modern induction units forces mechanical contractors into costly customized spatial redesigns to ensure proper acoustic comfort engineering and support real-time demand response capabilities.
  • Furthermore, the mandatory industry transition toward mild-flammable hydrofluoroolefins complicates onsite installation, extending project commissioning schedules by 22% due to rigorous new safety testing protocols.
  • Upgrading endpoints with mandatory high efficiency particulate air filtration and advanced air purification media alongside advanced brushless motors simultaneously inflates initial hardware procurement costs, lowering the immediate return on investment for risk-averse facility operators by roughly 12% against previous equipment generations.
  • These compounded supply chain and structural friction points consistently stall rapid modernization efforts, forcing property investors to delay full-scale decarbonization rollouts.

Exclusive Technavio Analysis on Customer Landscape

The hvac terminal units market forecasting report includes the adoption lifecycle of the market, covering from the innovator’s stage to the laggard’s stage. It focuses on adoption rates in different regions based on penetration. Furthermore, the hvac terminal units market report also includes key purchase criteria and drivers of price sensitivity to help companies evaluate and develop their market growth analysis strategies.
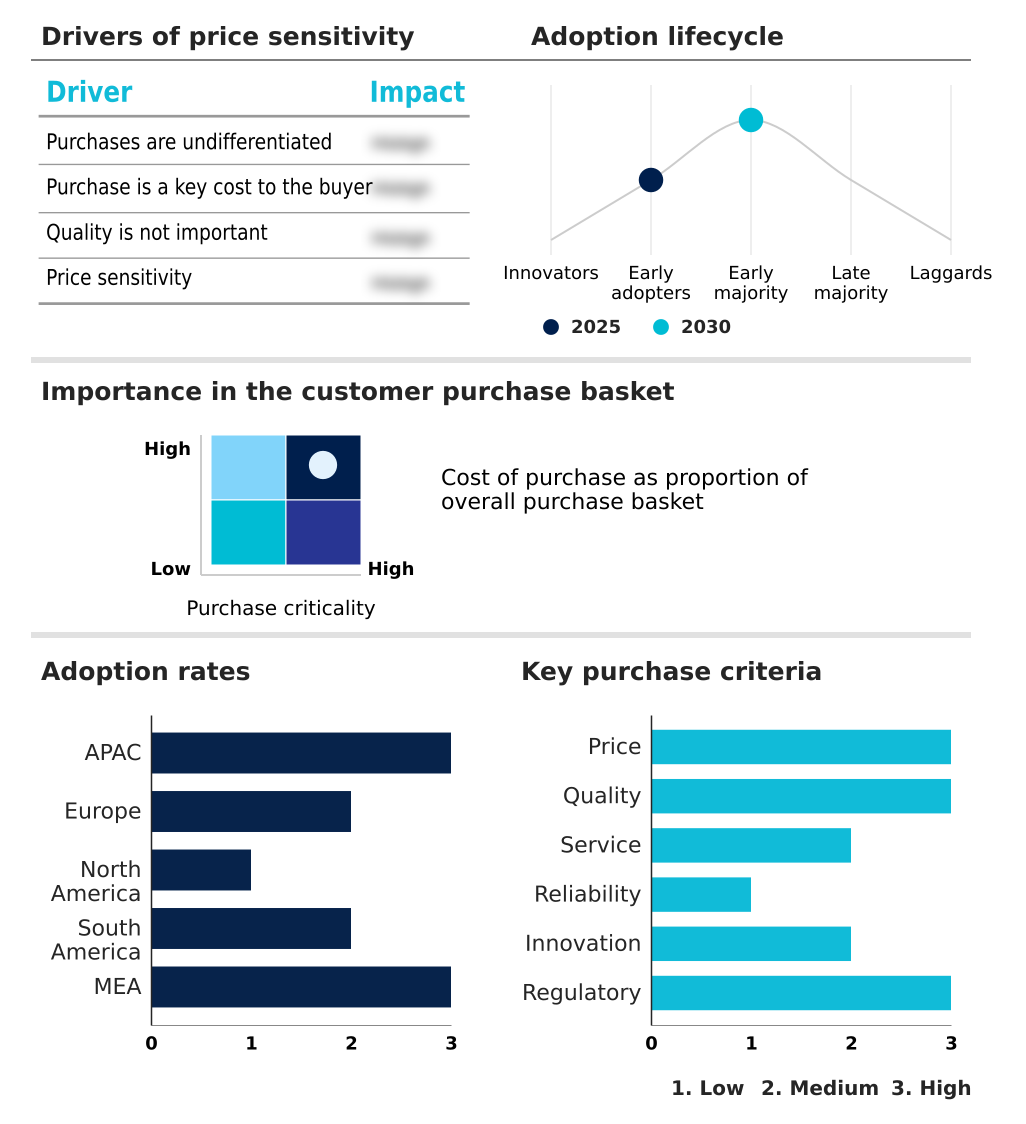
Customer Landscape of Hvac Terminal Units Industry

Competitive Landscape

Companies are implementing various strategies, such as strategic alliances, hvac terminal units market forecast, partnerships, mergers and acquisitions, geographical expansion, and product/service launches, to enhance their presence in the industry.

Aldes Group Export - The supplier manufactures advanced air distribution components and integrated fire and smoke dampers designed to enhance indoor environmental safety and ventilation efficiency across commercial building infrastructures.

The industry research and growth report includes detailed analyses of the competitive landscape of the market and information about key companies, including:

  • Aldes Group Export
  • Anemostat Inc.
  • Carnes Co.
  • Carrier Global Corp.
  • Daikin Industries Ltd.
  • Dunham Bush Holding Bhd.
  • FlaktGroup Holding GmbH
  • Halton Group Oy Ltd
  • Johnson Controls International
  • Lindab AB
  • Madel Air Technical Diffusion
  • Metal Industries Inc.
  • Mitsubishi Electric Corp.
  • Nailor Industries Inc.
  • Price Industries Inc.
  • Rickard Air Diffusion
  • Swegon Group AB
  • Systemair AB
  • Trane Technologies Plc
  • TROX SE
  • VTS Polska Sp. z o. o.
  • Warren Technology Inc.

Qualitative and quantitative analysis of companies has been conducted to help clients understand the wider business environment as well as the strengths and weaknesses of key industry players. Data is qualitatively analyzed to categorize companies as pure play, category-focused, industry-focused, and diversified; it is quantitatively analyzed to categorize companies as dominant, leading, strong, tentative, and weak.

Recent Development and News in Hvac terminal units market

  • In the Electrical Components and Equipment industry, the aggressive implementation of the European Union EcoDesign Directive mandated a 20% reduction in standby power consumption for building automation controls, directly impacting HVAC Terminal Units demand by accelerating the replacement of pneumatic actuators with high-efficiency electronic alternatives.
  • The rapid integration of industrial Internet of Things chipsets into low-voltage distribution panels enabled microsecond-level fault detection protocols, which transformed HVAC Terminal Units supply chains by requiring standardized digital telemetry protocols for all active climate regulation equipment.
  • The transition toward gallium nitride power semiconductors in commercial building power supplies reduced electrical conversion losses by 15%, prompting facility managers to upgrade HVAC Terminal Units with compatible brushless direct current motors to maximize overall system energy performance.
  • Stringent enforcement of the RoHS 3 compliance standards restricted the use of specific hazardous heavy metals in electrical contactors, forcing a structural redesign of HVAC Terminal Units internal wiring harnesses to achieve 100% heavy-metal-free certification prior to international distribution.

Dive into Technavio’s robust research methodology, blending expert interviews, extensive data synthesis, and validated models for unparalleled Hvac Terminal Units Market insights. See full methodology.

Market Scope
Page number 310
Base year 2025
Historic period 2020-2024
Forecast period 2026-2030
Growth momentum & CAGR Accelerate at a CAGR of 4.8%
Market growth 2026-2030 USD 1460.0 million
Market structure Fragmented
YoY growth 2025-2026(%) 4.6%
Key countries China, Japan, India, South Korea, Australia, Indonesia, Germany, UK, France, Italy, Spain, The Netherlands, US, Canada, Mexico, Brazil, Argentina, Chile, Saudi Arabia, UAE, South Africa, Turkey and Israel
Competitive landscape Leading Companies, Market Positioning of Companies, Competitive Strategies, and Industry Risks

Request Free Sample

Research Analyst Overview

  • The HVAC Terminal Units industry experiences a profound architectural shift as commercial building developers prioritize granular environmental precision and digital integration. Modern facility layouts increasingly incorporate decentralized fan coil units coupled directly with primary air handling units to optimize localized thermal conditions.
  • By deploying intelligent pressure independent controllers alongside high-precision airflow velocity sensors, organizations effectively stabilize room temperatures regardless of fluctuating duct static pressures. This technical evolution directly influences compliance budgeting, as upgrading legacy pneumatic endpoints with rapid-response electronic actuators and ultra low leakage dampers reduces cumulative system air loss by 18% compared to traditional mechanical assemblies.
  • Consequently, facility operators significantly lower their baseline electrical expenditures. The strategic implementation of specialized displacement ventilation diffusers further enhances indoor air quality by delivering conditioned air at the floor level, naturally displacing suspended pollutants.
  • These intelligent physical components actively transform conventional structural ductwork into responsive data-gathering networks, equipping corporate real estate portfolios with the necessary agility to navigate complex sustainability mandates and rigorous workplace safety requirements seamlessly.

What are the Key Data Covered in this Hvac Terminal Units Market Research and Growth Report?

  • What is the expected growth of the Hvac Terminal Units Market between 2026 and 2030?

    • USD 1.46 billion, at a CAGR of 4.8%

  • What segmentation does the market report cover?

    • The report is segmented by Product (Single duct, Dual duct, and Fan powered), Application (Commercial, Institutional, Healthcare, Industrial, and Residential), Product Type (Variable air volume, Fan coil units, Terminal reheat units, and Others) and Geography (APAC, Europe, North America, South America, Middle East and Africa)

  • Which regions are analyzed in the report?

    • APAC, Europe, North America, South America and Middle East and Africa

  • What are the key growth drivers and market challenges?

    • Rising demand for energy efficiency, Supply chain vulnerabilities impacting production

  • Who are the major players in the Hvac Terminal Units Market?

    • Aldes Group Export, Anemostat Inc., Carnes Co., Carrier Global Corp., Daikin Industries Ltd., Dunham Bush Holding Bhd., FlaktGroup Holding GmbH, Halton Group Oy Ltd, Johnson Controls International, Lindab AB, Madel Air Technical Diffusion, Metal Industries Inc., Mitsubishi Electric Corp., Nailor Industries Inc., Price Industries Inc., Rickard Air Diffusion, Swegon Group AB, Systemair AB, Trane Technologies Plc, TROX SE, VTS Polska Sp. z o. o. and Warren Technology Inc.

Market Research Insights

  • The HVAC Terminal Units sector rapidly evolves as commercial real estate owners embed cloud based performance analytics into localized climate infrastructure. Driven by stringent sustainability targets, organizations leverage carbon emissions tracking tools natively linked with smart thermostat integration to optimize energy consumption.
  • Implementing these advanced diagnostic frameworks has increased operational fault detection rates by 28% while simultaneously reducing off-peak power waste by 18%. Supply chain adaptations focusing on circular economy principles now allow facility operators to recycle end-of-life mechanical components more effectively.
  • These measurable improvements shift climate control endpoints from isolated mechanical assets to critical data-gathering nodes, driving substantial cost reductions and robust regulatory alignment across dense metropolitan property portfolios.

We can help! Our analysts can customize this hvac terminal units market research report to meet your requirements.

Get in touch

1. Executive Summary

1.1 Market overview

Executive Summary - Chart on Market Overview
Executive Summary - Data Table on Market Overview
Executive Summary - Chart on Global Market Characteristics
Executive Summary - Chart on Market by Geography
Executive Summary - Chart on Market Segmentation by Product
Executive Summary - Chart on Market Segmentation by Application
Executive Summary - Chart on Market Segmentation by Product Type
Executive Summary - Chart on Incremental Growth
Executive Summary - Data Table on Incremental Growth
Executive Summary - Chart on Company Market Positioning

2. Technavio Analysis

2.1 Analysis of price sensitivity, lifecycle, customer purchase basket, adoption rates, and purchase criteria

2.2 Criticality of inputs and Factors of differentiation

Chart on Overview on criticality of inputs and factors of differentiation

2.3 Factors of disruption

Chart on Overview on factors of disruption

2.4 Impact of drivers and challenges

Chart on Impact of drivers and challenges in 2025 and 2030

3. Market Landscape

3.1 Market ecosystem

Chart on Parent Market
Data Table on - Parent Market

3.2 Market characteristics

Chart on Market characteristics analysis

3.3 Value chain analysis

Chart on Value chain analysis

4. Market Sizing

4.1 Market definition

Data Table on Offerings of companies included in the market definition

4.2 Market segment analysis

Market segments

4.3 Market size 2025

4.4 Market outlook: Forecast for 2025-2030

Chart on Global - Market size and forecast 2025-2030 ($ million)
Data Table on Global - Market size and forecast 2025-2030 ($ million)
Chart on Global Market: Year-over-year growth 2025-2030 (%)
Data Table on Global Market: Year-over-year growth 2025-2030 (%)

5. Historic Market Size

5.1 Global HVAC Terminal Units Market 2020 - 2024

Historic Market Size - Data Table on Global HVAC Terminal Units Market 2020 - 2024 ($ million)

5.2 Product segment analysis 2020 - 2024

Historic Market Size - Product Segment 2020 - 2024 ($ million)

5.3 Application segment analysis 2020 - 2024

Historic Market Size - Application Segment 2020 - 2024 ($ million)

5.4 Product Type segment analysis 2020 - 2024

Historic Market Size - Product Type Segment 2020 - 2024 ($ million)

5.5 Geography segment analysis 2020 - 2024

Historic Market Size - Geography Segment 2020 - 2024 ($ million)

5.6 Country segment analysis 2020 - 2024

Historic Market Size - Country Segment 2020 - 2024 ($ million)

6. Qualitative Analysis

6.1 Impact of AI on Global HVAC Terminal Units Market

6.2 Impact of geopolitical conflicts on Global HVAC Terminal Units Market

7. Five Forces Analysis

7.1 Five forces summary

Five forces analysis - Comparison between 2025 and 2030

7.2 Bargaining power of buyers

Bargaining power of buyers - Impact of key factors 2025 and 2030

7.3 Bargaining power of suppliers

Bargaining power of suppliers - Impact of key factors in 2025 and 2030

7.4 Threat of new entrants

Threat of new entrants - Impact of key factors in 2025 and 2030

7.5 Threat of substitutes

Threat of substitutes - Impact of key factors in 2025 and 2030

7.6 Threat of rivalry

Threat of rivalry - Impact of key factors in 2025 and 2030

7.7 Market condition

Chart on Market condition - Five forces 2025 and 2030

8. Market Segmentation by Product

8.1 Market segments

Chart on Product - Market share 2025-2030 (%)
Data Table on Product - Market share 2025-2030 (%)

8.2 Comparison by Product

Chart on Comparison by Product
Data Table on Comparison by Product

8.3 Single duct - Market size and forecast 2025-2030

Chart on Single duct - Market size and forecast 2025-2030 ($ million)
Data Table on Single duct - Market size and forecast 2025-2030 ($ million)
Chart on Single duct - Year-over-year growth 2025-2030 (%)
Data Table on Single duct - Year-over-year growth 2025-2030 (%)

8.4 Dual duct - Market size and forecast 2025-2030

Chart on Dual duct - Market size and forecast 2025-2030 ($ million)
Data Table on Dual duct - Market size and forecast 2025-2030 ($ million)
Chart on Dual duct - Year-over-year growth 2025-2030 (%)
Data Table on Dual duct - Year-over-year growth 2025-2030 (%)

8.5 Fan powered - Market size and forecast 2025-2030

Chart on Fan powered - Market size and forecast 2025-2030 ($ million)
Data Table on Fan powered - Market size and forecast 2025-2030 ($ million)
Chart on Fan powered - Year-over-year growth 2025-2030 (%)
Data Table on Fan powered - Year-over-year growth 2025-2030 (%)

8.6 Market opportunity by Product

Market opportunity by Product ($ million)
Data Table on Market opportunity by Product ($ million)

9. Market Segmentation by Application

9.1 Market segments

Chart on Application - Market share 2025-2030 (%)
Data Table on Application - Market share 2025-2030 (%)

9.2 Comparison by Application

Chart on Comparison by Application
Data Table on Comparison by Application

9.3 Commercial - Market size and forecast 2025-2030

Chart on Commercial - Market size and forecast 2025-2030 ($ million)
Data Table on Commercial - Market size and forecast 2025-2030 ($ million)
Chart on Commercial - Year-over-year growth 2025-2030 (%)
Data Table on Commercial - Year-over-year growth 2025-2030 (%)

9.4 Institutional - Market size and forecast 2025-2030

Chart on Institutional - Market size and forecast 2025-2030 ($ million)
Data Table on Institutional - Market size and forecast 2025-2030 ($ million)
Chart on Institutional - Year-over-year growth 2025-2030 (%)
Data Table on Institutional - Year-over-year growth 2025-2030 (%)

9.5 Healthcare - Market size and forecast 2025-2030

Chart on Healthcare - Market size and forecast 2025-2030 ($ million)
Data Table on Healthcare - Market size and forecast 2025-2030 ($ million)
Chart on Healthcare - Year-over-year growth 2025-2030 (%)
Data Table on Healthcare - Year-over-year growth 2025-2030 (%)

9.6 Industrial - Market size and forecast 2025-2030

Chart on Industrial - Market size and forecast 2025-2030 ($ million)
Data Table on Industrial - Market size and forecast 2025-2030 ($ million)
Chart on Industrial - Year-over-year growth 2025-2030 (%)
Data Table on Industrial - Year-over-year growth 2025-2030 (%)

9.7 Residential - Market size and forecast 2025-2030

Chart on Residential - Market size and forecast 2025-2030 ($ million)
Data Table on Residential - Market size and forecast 2025-2030 ($ million)
Chart on Residential - Year-over-year growth 2025-2030 (%)
Data Table on Residential - Year-over-year growth 2025-2030 (%)

9.8 Market opportunity by Application

Market opportunity by Application ($ million)
Data Table on Market opportunity by Application ($ million)

10. Market Segmentation by Product Type

10.1 Market segments

Chart on Product Type - Market share 2025-2030 (%)
Data Table on Product Type - Market share 2025-2030 (%)

10.2 Comparison by Product Type

Chart on Comparison by Product Type
Data Table on Comparison by Product Type

10.3 Variable air volume - Market size and forecast 2025-2030

Chart on Variable air volume - Market size and forecast 2025-2030 ($ million)
Data Table on Variable air volume - Market size and forecast 2025-2030 ($ million)
Chart on Variable air volume - Year-over-year growth 2025-2030 (%)
Data Table on Variable air volume - Year-over-year growth 2025-2030 (%)

10.4 Fan coil units - Market size and forecast 2025-2030

Chart on Fan coil units - Market size and forecast 2025-2030 ($ million)
Data Table on Fan coil units - Market size and forecast 2025-2030 ($ million)
Chart on Fan coil units - Year-over-year growth 2025-2030 (%)
Data Table on Fan coil units - Year-over-year growth 2025-2030 (%)

10.5 Terminal reheat units - Market size and forecast 2025-2030

Chart on Terminal reheat units - Market size and forecast 2025-2030 ($ million)
Data Table on Terminal reheat units - Market size and forecast 2025-2030 ($ million)
Chart on Terminal reheat units - Year-over-year growth 2025-2030 (%)
Data Table on Terminal reheat units - Year-over-year growth 2025-2030 (%)

10.6 Others - Market size and forecast 2025-2030

Chart on Others - Market size and forecast 2025-2030 ($ million)
Data Table on Others - Market size and forecast 2025-2030 ($ million)
Chart on Others - Year-over-year growth 2025-2030 (%)
Data Table on Others - Year-over-year growth 2025-2030 (%)

10.7 Market opportunity by Product Type

Market opportunity by Product Type ($ million)
Data Table on Market opportunity by Product Type ($ million)

11. Customer Landscape

11.1 Customer landscape overview

Analysis of price sensitivity, lifecycle, customer purchase basket, adoption rates, and purchase criteria

12. Geographic Landscape

12.1 Geographic segmentation

Chart on Market share by geography 2025-2030 (%)
Data Table on Market share by geography 2025-2030 (%)

12.2 Geographic comparison

Chart on Geographic comparison
Data Table on Geographic comparison

12.3 APAC - Market size and forecast 2025-2030

Chart on APAC - Market size and forecast 2025-2030 ($ million)
Data Table on APAC - Market size and forecast 2025-2030 ($ million)
Chart on APAC - Year-over-year growth 2025-2030 (%)
Data Table on APAC - Year-over-year growth 2025-2030 (%)
Chart on Regional Comparison - APAC
Data Table on Regional Comparison - APAC

12.3.1 China - Market size and forecast 2025-2030

Chart on China - Market size and forecast 2025-2030 ($ million)
Data Table on China - Market size and forecast 2025-2030 ($ million)
Chart on China - Year-over-year growth 2025-2030 (%)
Data Table on China - Year-over-year growth 2025-2030 (%)

12.3.2 Japan - Market size and forecast 2025-2030

Chart on Japan - Market size and forecast 2025-2030 ($ million)
Data Table on Japan - Market size and forecast 2025-2030 ($ million)
Chart on Japan - Year-over-year growth 2025-2030 (%)
Data Table on Japan - Year-over-year growth 2025-2030 (%)

12.3.3 India - Market size and forecast 2025-2030

Chart on India - Market size and forecast 2025-2030 ($ million)
Data Table on India - Market size and forecast 2025-2030 ($ million)
Chart on India - Year-over-year growth 2025-2030 (%)
Data Table on India - Year-over-year growth 2025-2030 (%)

12.3.4 South Korea - Market size and forecast 2025-2030

Chart on South Korea - Market size and forecast 2025-2030 ($ million)
Data Table on South Korea - Market size and forecast 2025-2030 ($ million)
Chart on South Korea - Year-over-year growth 2025-2030 (%)
Data Table on South Korea - Year-over-year growth 2025-2030 (%)

12.3.5 Australia - Market size and forecast 2025-2030

Chart on Australia - Market size and forecast 2025-2030 ($ million)
Data Table on Australia - Market size and forecast 2025-2030 ($ million)
Chart on Australia - Year-over-year growth 2025-2030 (%)
Data Table on Australia - Year-over-year growth 2025-2030 (%)

12.3.6 Indonesia - Market size and forecast 2025-2030

Chart on Indonesia - Market size and forecast 2025-2030 ($ million)
Data Table on Indonesia - Market size and forecast 2025-2030 ($ million)
Chart on Indonesia - Year-over-year growth 2025-2030 (%)
Data Table on Indonesia - Year-over-year growth 2025-2030 (%)

12.4 Europe - Market size and forecast 2025-2030

Chart on Europe - Market size and forecast 2025-2030 ($ million)
Data Table on Europe - Market size and forecast 2025-2030 ($ million)
Chart on Europe - Year-over-year growth 2025-2030 (%)
Data Table on Europe - Year-over-year growth 2025-2030 (%)
Chart on Regional Comparison - Europe
Data Table on Regional Comparison - Europe

12.4.1 Germany - Market size and forecast 2025-2030

Chart on Germany - Market size and forecast 2025-2030 ($ million)
Data Table on Germany - Market size and forecast 2025-2030 ($ million)
Chart on Germany - Year-over-year growth 2025-2030 (%)
Data Table on Germany - Year-over-year growth 2025-2030 (%)

12.4.2 UK - Market size and forecast 2025-2030

Chart on UK - Market size and forecast 2025-2030 ($ million)
Data Table on UK - Market size and forecast 2025-2030 ($ million)
Chart on UK - Year-over-year growth 2025-2030 (%)
Data Table on UK - Year-over-year growth 2025-2030 (%)

12.4.3 France - Market size and forecast 2025-2030

Chart on France - Market size and forecast 2025-2030 ($ million)
Data Table on France - Market size and forecast 2025-2030 ($ million)
Chart on France - Year-over-year growth 2025-2030 (%)
Data Table on France - Year-over-year growth 2025-2030 (%)

12.4.4 Italy - Market size and forecast 2025-2030

Chart on Italy - Market size and forecast 2025-2030 ($ million)
Data Table on Italy - Market size and forecast 2025-2030 ($ million)
Chart on Italy - Year-over-year growth 2025-2030 (%)
Data Table on Italy - Year-over-year growth 2025-2030 (%)

12.4.5 Spain - Market size and forecast 2025-2030

Chart on Spain - Market size and forecast 2025-2030 ($ million)
Data Table on Spain - Market size and forecast 2025-2030 ($ million)
Chart on Spain - Year-over-year growth 2025-2030 (%)
Data Table on Spain - Year-over-year growth 2025-2030 (%)

12.4.6 The Netherlands - Market size and forecast 2025-2030

Chart on The Netherlands - Market size and forecast 2025-2030 ($ million)
Data Table on The Netherlands - Market size and forecast 2025-2030 ($ million)
Chart on The Netherlands - Year-over-year growth 2025-2030 (%)
Data Table on The Netherlands - Year-over-year growth 2025-2030 (%)

12.5 North America - Market size and forecast 2025-2030

Chart on North America - Market size and forecast 2025-2030 ($ million)
Data Table on North America - Market size and forecast 2025-2030 ($ million)
Chart on North America - Year-over-year growth 2025-2030 (%)
Data Table on North America - Year-over-year growth 2025-2030 (%)
Chart on Regional Comparison - North America
Data Table on Regional Comparison - North America

12.5.1 US - Market size and forecast 2025-2030

Chart on US - Market size and forecast 2025-2030 ($ million)
Data Table on US - Market size and forecast 2025-2030 ($ million)
Chart on US - Year-over-year growth 2025-2030 (%)
Data Table on US - Year-over-year growth 2025-2030 (%)

12.5.2 Canada - Market size and forecast 2025-2030

Chart on Canada - Market size and forecast 2025-2030 ($ million)
Data Table on Canada - Market size and forecast 2025-2030 ($ million)
Chart on Canada - Year-over-year growth 2025-2030 (%)
Data Table on Canada - Year-over-year growth 2025-2030 (%)

12.5.3 Mexico - Market size and forecast 2025-2030

Chart on Mexico - Market size and forecast 2025-2030 ($ million)
Data Table on Mexico - Market size and forecast 2025-2030 ($ million)
Chart on Mexico - Year-over-year growth 2025-2030 (%)
Data Table on Mexico - Year-over-year growth 2025-2030 (%)

12.6 South America - Market size and forecast 2025-2030

Chart on South America - Market size and forecast 2025-2030 ($ million)
Data Table on South America - Market size and forecast 2025-2030 ($ million)
Chart on South America - Year-over-year growth 2025-2030 (%)
Data Table on South America - Year-over-year growth 2025-2030 (%)
Chart on Regional Comparison - South America
Data Table on Regional Comparison - South America

12.6.1 Brazil - Market size and forecast 2025-2030

Chart on Brazil - Market size and forecast 2025-2030 ($ million)
Data Table on Brazil - Market size and forecast 2025-2030 ($ million)
Chart on Brazil - Year-over-year growth 2025-2030 (%)
Data Table on Brazil - Year-over-year growth 2025-2030 (%)

12.6.2 Argentina - Market size and forecast 2025-2030

Chart on Argentina - Market size and forecast 2025-2030 ($ million)
Data Table on Argentina - Market size and forecast 2025-2030 ($ million)
Chart on Argentina - Year-over-year growth 2025-2030 (%)
Data Table on Argentina - Year-over-year growth 2025-2030 (%)

12.6.3 Chile - Market size and forecast 2025-2030

Chart on Chile - Market size and forecast 2025-2030 ($ million)
Data Table on Chile - Market size and forecast 2025-2030 ($ million)
Chart on Chile - Year-over-year growth 2025-2030 (%)
Data Table on Chile - Year-over-year growth 2025-2030 (%)

12.7 Middle East and Africa - Market size and forecast 2025-2030

Chart on Middle East and Africa - Market size and forecast 2025-2030 ($ million)
Data Table on Middle East and Africa - Market size and forecast 2025-2030 ($ million)
Chart on Middle East and Africa - Year-over-year growth 2025-2030 (%)
Data Table on Middle East and Africa - Year-over-year growth 2025-2030 (%)
Chart on Regional Comparison - Middle East and Africa
Data Table on Regional Comparison - Middle East and Africa

12.7.1 Saudi Arabia - Market size and forecast 2025-2030

Chart on Saudi Arabia - Market size and forecast 2025-2030 ($ million)
Data Table on Saudi Arabia - Market size and forecast 2025-2030 ($ million)
Chart on Saudi Arabia - Year-over-year growth 2025-2030 (%)
Data Table on Saudi Arabia - Year-over-year growth 2025-2030 (%)

12.7.2 UAE - Market size and forecast 2025-2030

Chart on UAE - Market size and forecast 2025-2030 ($ million)
Data Table on UAE - Market size and forecast 2025-2030 ($ million)
Chart on UAE - Year-over-year growth 2025-2030 (%)
Data Table on UAE - Year-over-year growth 2025-2030 (%)

12.7.3 South Africa - Market size and forecast 2025-2030

Chart on South Africa - Market size and forecast 2025-2030 ($ million)
Data Table on South Africa - Market size and forecast 2025-2030 ($ million)
Chart on South Africa - Year-over-year growth 2025-2030 (%)
Data Table on South Africa - Year-over-year growth 2025-2030 (%)

12.7.4 Turkey - Market size and forecast 2025-2030

Chart on Turkey - Market size and forecast 2025-2030 ($ million)
Data Table on Turkey - Market size and forecast 2025-2030 ($ million)
Chart on Turkey - Year-over-year growth 2025-2030 (%)
Data Table on Turkey - Year-over-year growth 2025-2030 (%)

12.7.5 Israel - Market size and forecast 2025-2030

Chart on Israel - Market size and forecast 2025-2030 ($ million)
Data Table on Israel - Market size and forecast 2025-2030 ($ million)
Chart on Israel - Year-over-year growth 2025-2030 (%)
Data Table on Israel - Year-over-year growth 2025-2030 (%)

12.8 Market opportunity by geography

Market opportunity by geography ($ million)
Data Tables on Market opportunity by geography ($ million)

13. Drivers, Challenges, and Opportunity

13.1 Market drivers

Rising demand for energy efficiency
Expansion of smart building integration
Strict indoor air quality regulations

13.2 Market challenges

Supply chain vulnerabilities impacting production
Regulatory pressures on refrigerant transitions
Increase in capital costs for modernization

13.3 Impact of drivers and challenges

Impact of drivers and challenges in 2025 and 2030

13.4 Market opportunities

Integration of advanced predictive diagnostics
Transition to low GWP refrigerants
Proliferation of acoustic comfort engineering

14. Competitive Landscape

14.1 Overview

14.2

Overview on criticality of inputs and factors of differentiation

14.3 Landscape disruption

Overview on factors of disruption

14.4 Industry risks

Impact of key risks on business

15. Competitive Analysis

15.1 Companies profiled

Companies covered

15.2 Company ranking index

15.3 Market positioning of companies

Matrix on companies position and classification

15.4 Carrier Global Corp.

Carrier Global Corp. - Overview
Carrier Global Corp. - Business segments
Carrier Global Corp. - Key news
Carrier Global Corp. - Key offerings
Carrier Global Corp. - Segment focus
SWOT

15.5 Daikin Industries Ltd.

Daikin Industries Ltd. - Overview
Daikin Industries Ltd. - Business segments
Daikin Industries Ltd. - Key news
Daikin Industries Ltd. - Key offerings
Daikin Industries Ltd. - Segment focus
SWOT

15.6 FlaktGroup Holding GmbH

FlaktGroup Holding GmbH - Overview
FlaktGroup Holding GmbH - Product / Service
FlaktGroup Holding GmbH - Key offerings
SWOT

15.7 Halton Group Oy Ltd

Halton Group Oy Ltd - Overview
Halton Group Oy Ltd - Product / Service
Halton Group Oy Ltd - Key offerings
SWOT

15.8 Johnson Controls International

Johnson Controls International - Overview
Johnson Controls International - Business segments
Johnson Controls International - Key news
Johnson Controls International - Key offerings
Johnson Controls International - Segment focus
SWOT

15.9 Lindab AB

Lindab AB - Overview
Lindab AB - Business segments
Lindab AB - Key offerings
Lindab AB - Segment focus
SWOT

15.10 Metal Industries Inc.

Metal Industries Inc. - Overview
Metal Industries Inc. - Product / Service
Metal Industries Inc. - Key offerings
SWOT

15.11 Mitsubishi Electric Corp.

Mitsubishi Electric Corp. - Overview
Mitsubishi Electric Corp. - Business segments
Mitsubishi Electric Corp. - Key offerings
Mitsubishi Electric Corp. - Segment focus
SWOT

15.12 Nailor Industries Inc.

Nailor Industries Inc. - Overview
Nailor Industries Inc. - Product / Service
Nailor Industries Inc. - Key offerings
SWOT

15.13 Swegon Group AB

Swegon Group AB - Overview
Swegon Group AB - Product / Service
Swegon Group AB - Key offerings
SWOT

15.14 Systemair AB

Systemair AB - Overview
Systemair AB - Business segments
Systemair AB - Key offerings
Systemair AB - Segment focus
SWOT

15.15 Trane Technologies Plc

Trane Technologies Plc - Overview
Trane Technologies Plc - Business segments
Trane Technologies Plc - Key offerings
Trane Technologies Plc - Segment focus
SWOT

15.16 TROX SE

TROX SE - Overview
TROX SE - Product / Service
TROX SE - Key offerings
SWOT

15.17 VTS Polska Sp. z o. o.

VTS Polska Sp. z o. o. - Overview
VTS Polska Sp. z o. o. - Product / Service
VTS Polska Sp. z o. o. - Key offerings
SWOT

15.18 Warren Technology Inc.

Warren Technology Inc. - Overview
Warren Technology Inc. - Product / Service
Warren Technology Inc. - Key offerings
SWOT

16. Appendix

16.1 Scope of the report

Market definition
Objectives
Notes and caveats

16.2 Inclusions and exclusions checklist

Inclusions checklist
Exclusions checklist

16.3 Currency conversion rates for US$

16.4 Research methodology

16.5 Data procurement

Information sources

16.6 Data validation

16.7 Validation techniques employed for market sizing

16.8 Data synthesis

16.9 360 degree market analysis

16.10 List of abbreviations

Research Methodology

Technavio presents a detailed picture of the market by way of study, synthesis, and summation of data from multiple sources. The analysts have presented the various facets of the market with a particular focus on identifying the key industry influencers. The data thus presented is comprehensive, reliable, and the result of extensive research, both primary and secondary.

INFORMATION SOURCES

Primary sources

  • Manufacturers and suppliers
  • Channel partners
  • Industry experts
  • Strategic decision makers

Secondary sources

  • Industry journals and periodicals
  • Government data
  • Financial reports of key industry players
  • Historical data
  • Press releases

DATA ANALYSIS

Data Synthesis

  • Collation of data
  • Estimation of key figures
  • Analysis of derived insights

Data Validation

  • Triangulation with data models
  • Reference against proprietary databases
  • Corroboration with industry experts

REPORT WRITING

Qualitative

  • Market drivers
  • Market challenges
  • Market trends
  • Five forces analysis

Quantitative

  • Market size and forecast
  • Market segmentation
  • Geographical insights
  • Competitive landscape

Interested in this report?

Get your sample now to see our research methodology and insights!

Download Now

Frequently Asked Questions

Hvac Terminal Units market growth will increase by USD 1460.0 million during 2026-2030.

The Hvac Terminal Units market is expected to grow at a CAGR of 4.8% during 2026-2030.

Hvac Terminal Units market is segmented by Product (Single duct, Dual duct, Fan powered) Application (Commercial, Institutional, Healthcare, Industrial, Residential) Product type (Variable air volume, Fan coil units, Terminal reheat units, Others)

Aldes Group Export, Anemostat Inc., Carnes Co., Carrier Global Corp., Daikin Industries Ltd., Dunham Bush Holding Bhd., FlaktGroup Holding GmbH, Halton Group Oy Ltd, Johnson Controls International, Lindab AB, Madel Air Technical Diffusion, Metal Industries Inc., Mitsubishi Electric Corp., Nailor Industries Inc., Price Industries Inc., Rickard Air Diffusion, Swegon Group AB, Systemair AB, Trane Technologies Plc, TROX SE, VTS Polska Sp. z o. o., Warren Technology Inc. are a few of the key vendors in the Hvac Terminal Units market.

APAC will register the highest growth rate of 53.1% among the other regions. Therefore, the Hvac Terminal Units market in APAC is expected to garner significant business opportunities for the vendors during the forecast period.

China, Japan, India, South Korea, Australia, Indonesia, Germany, UK, France, Italy, Spain, The Netherlands, US, Canada, Mexico, Brazil, Argentina, Chile, Saudi Arabia, UAE, South Africa, Turkey, Israel

  • Rising demand for energy efficiency is the driving factor this market.

The Hvac Terminal Units market vendors should focus on grabbing business opportunities from the Product segment as it accounted for the largest market share in the base year.
RIA - Research AI Assistant
Ask RIA