Hydraulic Brakes Market Analysis, Size, and Forecast 2026-2030: APAC (China, India, and Japan), North America (US, Canada, and Mexico), Europe (Germany, France, and UK), South America (Brazil, Argentina, and Colombia), Middle East and Africa (South Africa, Saudi Arabia, and UAE), and Rest of World (ROW)

Hydraulic Brakes Market Analysis, Size, and Forecast 2026-2030:
APAC (China, India, and Japan), North America (US, Canada, and Mexico), Europe (Germany, France, and UK), South America (Brazil, Argentina, and Colombia), Middle East and Africa (South Africa, Saudi Arabia, and UAE), and Rest of World (ROW)

Published: Apr 2026 309 Pages SKU: IRTNTR81400

Market Overview at a Glance

$8.54 B
Market Opportunity
6.1%
CAGR 2025 - 2030
46.3%
APAC Growth
$14.40 B
Friction type segment 2024

Hydraulic Brakes Market Size 2026-2030

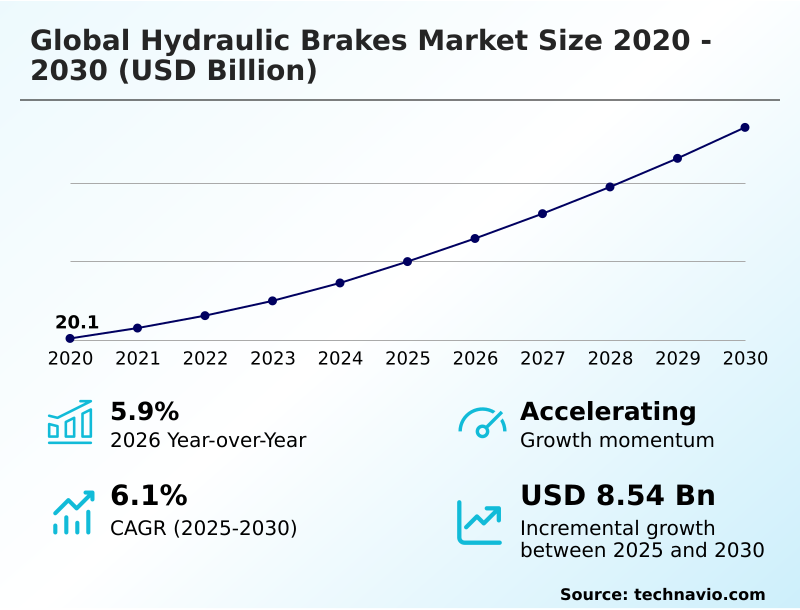
The hydraulic brakes market size is valued to increase by USD 8.54 billion, at a CAGR of 6.1% from 2025 to 2030. Stringent global safety regulations and mandatory braking standards will drive the hydraulic brakes market.

Major Market Trends & Insights

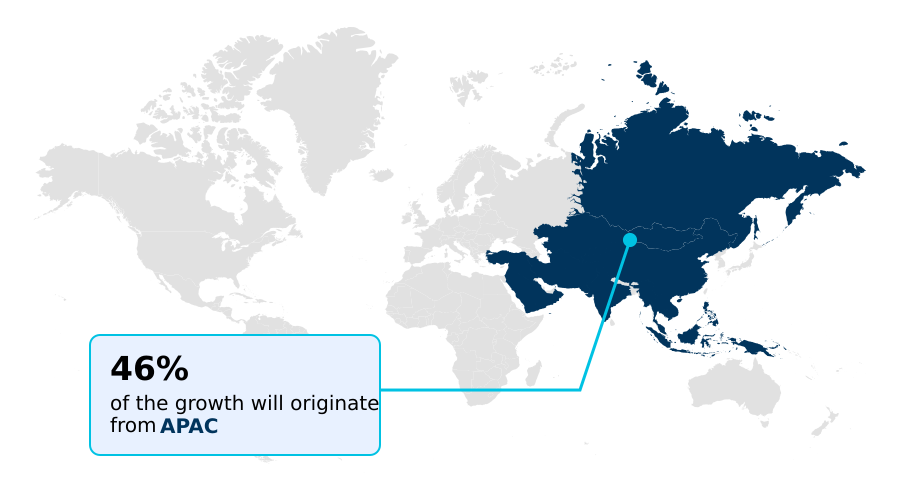
  • APAC dominated the market and accounted for a 46.3% growth during the forecast period.
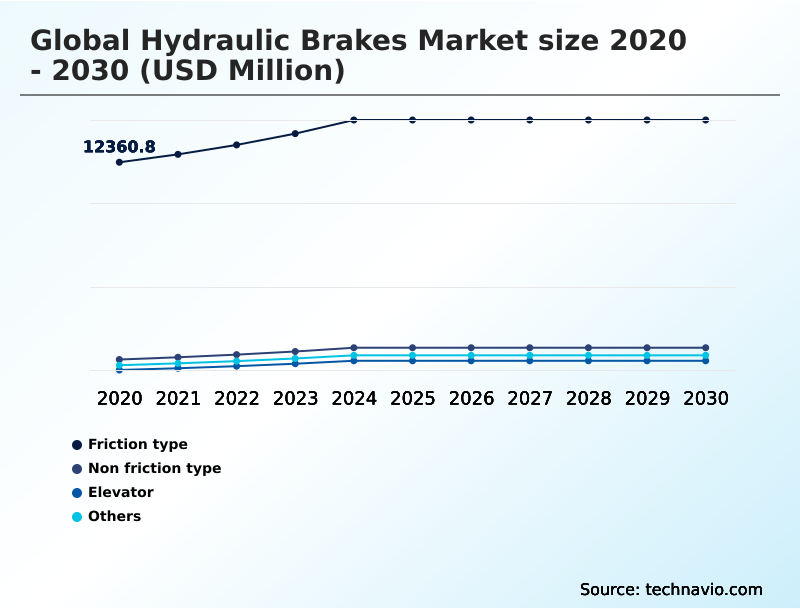
  • By Type - Friction type segment was valued at USD 14.40 billion in 2024
  • By Application - Automotive segment accounted for the largest market revenue share in 2024

Market Size & Forecast

  • Market Opportunities: USD 13.43 billion
  • Market Future Opportunities: USD 8.54 billion
  • CAGR from 2025 to 2030 : 6.1%

Market Summary

  • The hydraulic brakes market is defined by its foundational role in safety across automotive and industrial sectors, where the principles of fluid mechanics are leveraged to provide reliable stopping power. The core technology, operating on Pascal's law, uses pressurized fluid within a system comprising a master cylinder, calipers, and hydraulic actuators to convert kinetic energy into thermal energy.
  • Market dynamics are increasingly shaped by the push for enhanced vehicle safety, leading to the mandatory inclusion of anti-lock braking systems and electronic stability control. For instance, in heavy-duty logistics, fleet operators are prioritizing systems with high-boiling-point fluids to ensure consistent performance under heavy thermal loads, a critical factor for compliance and operational safety.
  • Simultaneously, the market is adapting to the rise of electric vehicles, where electro-hydraulic braking is essential for integrating regenerative capabilities while retaining a fail-safe mechanical system. This evolution presents both challenges and opportunities, as manufacturers balance traditional reliability with the demand for lightweight, electronically controlled components like composite plastics and high-strength aluminum alloys.

What will be the Size of the Hydraulic Brakes Market during the forecast period?

Get Key Insights on Market Forecast (PDF) Request Free Sample

How is the Hydraulic Brakes Market Segmented?

The hydraulic brakes industry research report provides comprehensive data (region-wise segment analysis), with forecasts and estimates in "USD million" for the period 2026-2030, as well as historical data from 2020-2024 for the following segments.

  • Type
    • Friction type
    • Non friction type
    • Elevator
    • Others
  • Application
    • Automotive
    • Industrial machinery
    • Construction equipment
    • Marine applications
  • End-user
    • OEMs
    • Aftermarket
    • Maintenance and repair services
  • Geography
    • APAC
      • China
      • India
      • Japan
    • North America
      • US
      • Canada
      • Mexico
    • Europe
      • Germany
      • France
      • UK
    • South America
      • Brazil
      • Argentina
      • Colombia
    • Middle East and Africa
      • South Africa
      • Saudi Arabia
      • UAE
    • Rest of World (ROW)

By Type Insights

The friction type segment is estimated to witness significant growth during the forecast period.

The global hydraulic brakes market is segmented by type, application, and geography, reflecting its diverse utility. The automotive sector, including OEM and aftermarket channels, represents a primary application, driven by the need for reliable braking force distribution.

In industrial machinery and construction equipment, systems are engineered for high-torque holding capacity. A key focus is on friction-based braking using specialized hydraulic fluid properties. Geographically, APAC leads due to its expansive manufacturing and infrastructure projects.

The transition towards lightweight materials for hydraulic calipers is a notable trend, improving efficiency across all segments.

This focus on material science demonstrates a market-wide push for performance optimization and durability, with firms reporting up to a 15% improvement in component lifespan through advanced alloys.

Request Free Sample

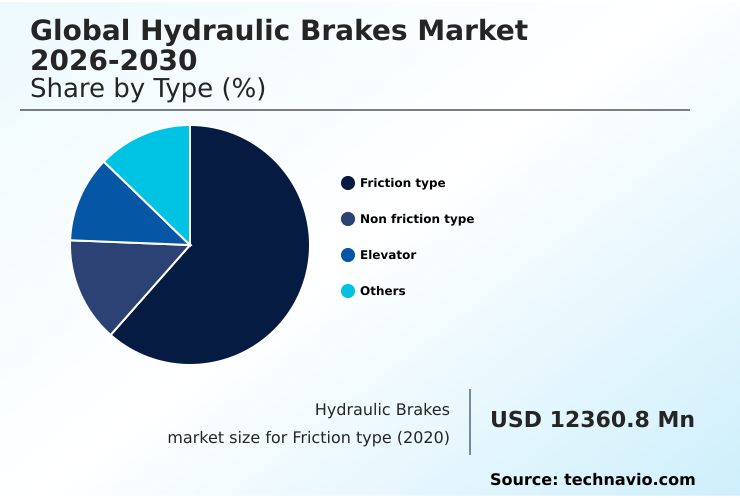
The Friction type segment was valued at USD 14.40 billion in 2024 and showed a gradual increase during the forecast period.

Request Free Sample

Regional Analysis

APAC is estimated to contribute 46.3% to the growth of the global market during the forecast period.Technavio’s analysts have elaborately explained the regional trends and drivers that shape the market during the forecast period.

See How Hydraulic Brakes Market Demand is Rising in APAC Request Free Sample

The geographic landscape of the market is led by APAC, which accounts for 46.3% of the market's incremental growth, driven by massive infrastructure development and a burgeoning automotive sector in countries like China and India.

This region's demand for high-pressure hydraulic braking systems is pronounced in heavy construction and industrial machinery. North America follows, with a market driven by stringent safety standards for commercial vehicles and a robust aerospace sector requiring high-performance hydraulic actuators.

Europe is a hub for innovation, particularly in electro-hydraulic braking and the development of eco-friendly hydraulic fluids to meet environmental regulations.

South America and the Middle East and Africa are growing markets, fueled by mining, agriculture, and large-scale construction projects requiring durable hydraulic technology.

Market Dynamics

Our researchers analyzed the data with 2025 as the base year, along with the key drivers, trends, and challenges. A holistic analysis of drivers will help companies refine their marketing strategies to gain a competitive advantage.

  • The evolution of the hydraulic brakes market is marked by key technological advancements aimed at enhancing safety, efficiency, and environmental compliance. A central focus is on electro-hydraulic braking system efficiency, which is critical for the performance of modern electric and autonomous vehicles. The design of high-pressure hydraulic actuators is being refined to deliver more precise control and faster response times.
  • Concurrently, there is a significant push for reducing non-exhaust brake emissions, leading to innovations in materials and system design. Research into copper-free friction material performance is driven by regulations aimed at minimizing environmental impact. Similarly, advancements in eco-friendly hydraulic fluids are becoming a priority for manufacturers seeking to offer sustainable solutions.
  • The development of hydraulic brake systems for electric vehicles involves integrating regenerative braking with traditional friction-based mechanisms to optimize energy recovery. For industrial settings, oil-shear industrial hydraulic brakes offer superior durability and thermal management in high-cycle applications. The trend towards lightweighting has spurred the use of advanced materials for hydraulic calipers, which helps improve overall vehicle dynamics.
  • Furthermore, effective thermal management in hydraulic brakes is crucial for preventing brake fade in high-performance and heavy-duty scenarios. Integrating digital controls with hydraulic systems presents ongoing challenges that drive innovation in software and hardware. The impact of raw material volatility on brake manufacturing costs remains a significant concern, influencing supply chain strategies.
  • Finally, the development of durable hydraulic brake hoses and advanced brake fluid for high-performance cars underscores the market's commitment to reliability and safety across all segments. As a result, the market's growth is more than double that of related mechanical component sectors.

What are the key market drivers leading to the rise in the adoption of Hydraulic Brakes Industry?

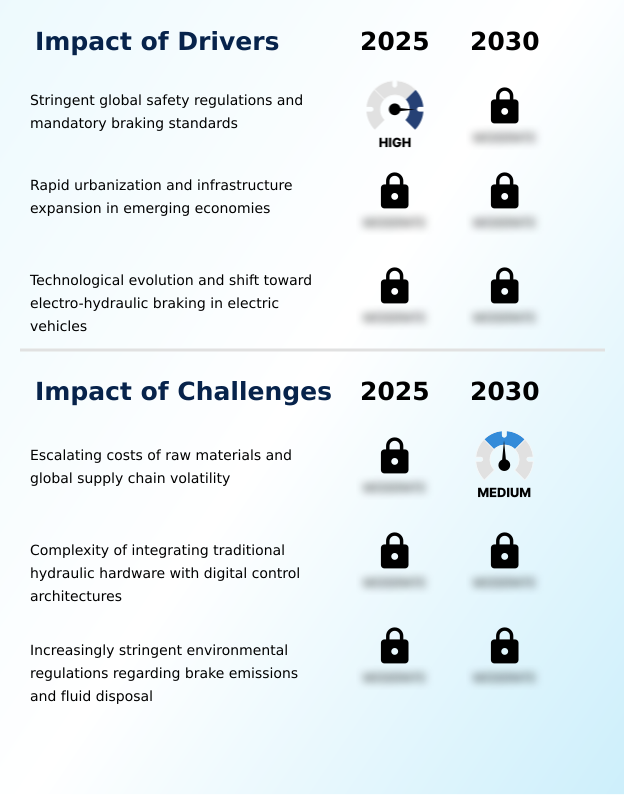
  • Stringent global safety regulations and mandatory braking standards are the key drivers for the global hydraulic brakes market.

  • Growth is primarily driven by stringent global safety regulations that mandate the use of advanced systems like anti-lock braking and electronic stability control, both of which rely on precise hydraulic pressure modulation.
  • The rapid urbanization and infrastructure expansion in emerging economies are fueling demand for heavy machinery, which exclusively uses high-pressure hydraulic braking systems for safety and control.
  • Furthermore, the technological shift toward electric vehicles is a critical driver, as these vehicles still require hydraulic brakes for high-intensity stopping and as a primary safety fallback.
  • The integration of electro-hydraulic systems in modern vehicles has improved emergency braking response times by over 25%, showcasing how traditional technology adapts to digital platforms.

What are the market trends shaping the Hydraulic Brakes Industry?

  • The market is trending toward the integration of electro-hydraulic braking with brake-by-wire systems. This shift is driven by the rise of electric vehicles and the need for advanced autonomous driving functionalities.

  • Market trends are centered on the fusion of electronics and fluid mechanics, with electro-hydraulic braking becoming a key enabler for electric and autonomous vehicles. This trend allows for sophisticated regenerative braking systems while retaining the proven reliability of hydraulic force.
  • The adoption of advanced lightweight materials, such as carbon ceramics and high-strength aluminum alloys, is critical for reducing unsprung mass, which has been shown to improve vehicle range by up to 5%. Another significant trend is the focus on sustainability, driving the development of eco-friendly hydraulic fluids and copper-free friction materials to comply with tightening environmental regulations.
  • Innovations in thermal management, including ventilated calipers, are also crucial for preventing brake fade in high-performance applications, enhancing safety and durability.

What challenges does the Hydraulic Brakes Industry face during its growth?

  • Escalating raw material costs and global supply chain volatility present a key challenge to the growth of the global hydraulic brakes market.

  • A primary challenge is the escalating cost and volatility of raw materials like high-grade aluminum and specialized steel alloys, which directly impact manufacturing costs and profit margins. Supply chain disruptions can cause significant production delays, as highlighted by incidents affecting the availability of critical components.
  • Another major challenge is the technical complexity of integrating traditional hydraulic hardware with digital control architectures, such as brake-by-wire systems. This requires cross-disciplinary expertise and extensive testing, increasing R&D costs by as much as 15% for new system development.
  • Additionally, increasingly stringent environmental regulations regarding brake emissions and fluid disposal compel manufacturers to invest heavily in developing sustainable but equally effective friction materials and biodegradable fluids.

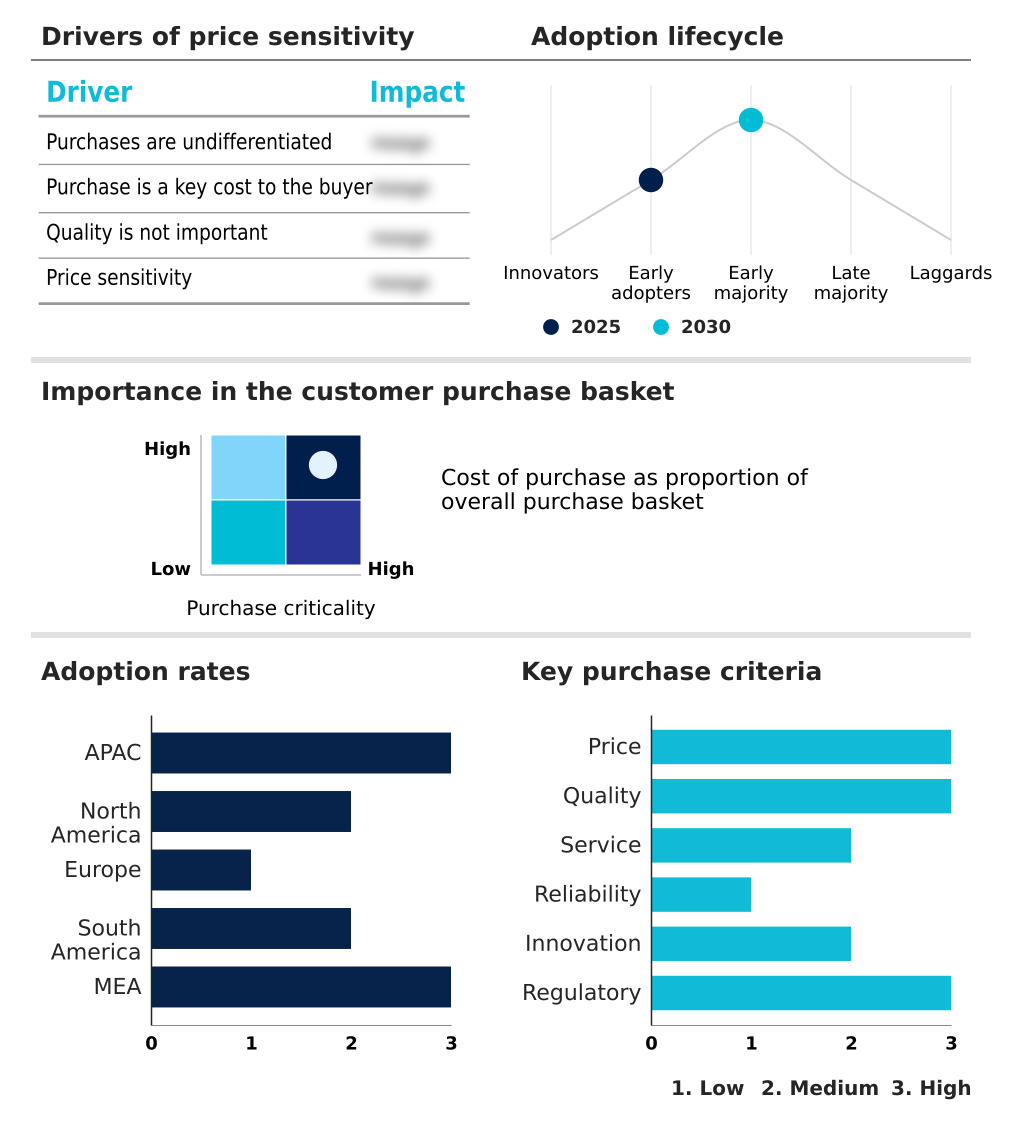
Exclusive Technavio Analysis on Customer Landscape

The hydraulic brakes market forecasting report includes the adoption lifecycle of the market, covering from the innovator’s stage to the laggard’s stage. It focuses on adoption rates in different regions based on penetration. Furthermore, the hydraulic brakes market report also includes key purchase criteria and drivers of price sensitivity to help companies evaluate and develop their market growth analysis strategies.

Customer Landscape of Hydraulic Brakes Industry

Competitive Landscape

Companies are implementing various strategies, such as strategic alliances, hydraulic brakes market forecast, partnerships, mergers and acquisitions, geographical expansion, and product/service launches, to enhance their presence in the industry.

AISIN Corp. - Suppliers deliver integrated hydraulic brake systems and components, including advanced friction materials and calipers, designed for OEM and aftermarket applications across multiple vehicle sectors.

The industry research and growth report includes detailed analyses of the competitive landscape of the market and information about key companies, including:

  • AISIN Corp.
  • Akebono Brake Industry Co.
  • AP Racing Ltd
  • Brembo SpA
  • Continental AG
  • Dana Inc.
  • Dorman Products Inc.
  • Haldex AB
  • Hitachi Astemo Ltd.
  • HL Mando Co. Ltd.
  • Knorr Bremse AG
  • Robert Bosch GmbH
  • Shimano Inc.
  • SRAM LLC
  • Valeo SA
  • Wabtec Corp.
  • Wilwood Engineering Inc.
  • ZF Friedrichshafen AG

Qualitative and quantitative analysis of companies has been conducted to help clients understand the wider business environment as well as the strengths and weaknesses of key industry players. Data is qualitatively analyzed to categorize companies as pure play, category-focused, industry-focused, and diversified; it is quantitatively analyzed to categorize companies as dominant, leading, strong, tentative, and weak.

Recent Development and News in Hydraulic brakes market

  • In May 2025, Continental AG finalized the integration of its high-pressure hydraulic actuator into a new Level 4 autonomous shuttle fleet operating in Singapore.
  • In August 2025, Brembo S.p.A. introduced its Greenance hydraulic kit for light commercial vehicles, which features a specialized coating on the discs and updated friction material to drastically reduce wear and particulate emissions.
  • In October 2025, General Motors announced the implementation of a refined electro-hydraulic braking architecture for its latest series of electric heavy-duty pickup trucks.
  • In June 2025, Tata Motors in India introduced a new series of medium-duty construction vehicles that feature an integrated hydraulic braking system with a revised fluid cooling architecture designed specifically for high-temperature tropical climates.

Dive into Technavio’s robust research methodology, blending expert interviews, extensive data synthesis, and validated models for unparalleled Hydraulic Brakes Market insights. See full methodology.

Market Scope
Page number 309
Base year 2025
Historic period 2020-2024
Forecast period 2026-2030
Growth momentum & CAGR Accelerate at a CAGR of 6.1%
Market growth 2026-2030 USD 8535.1 million
Market structure Fragmented
YoY growth 2025-2026(%) 5.9%
Key countries China, India, Japan, South Korea, Indonesia, Australia, US, Canada, Mexico, Germany, France, UK, Italy, Spain, The Netherlands, Brazil, Argentina, Colombia, South Africa, Saudi Arabia, UAE, Egypt and Nigeria
Competitive landscape Leading Companies, Market Positioning of Companies, Competitive Strategies, and Industry Risks

Request Free Sample

Research Analyst Overview

  • The hydraulic brakes market is undergoing a significant transformation, driven by the convergence of mechanical reliability and digital precision. Core components such as the master cylinder, wheel cylinders, and calipers are being re-engineered with high-strength aluminum alloys and composite plastics to reduce unsprung mass, a critical factor in electric vehicle efficiency.
  • The integration of electro-hydraulic braking and brake-by-wire systems, supported by advanced electronic sensors and control units, is becoming standard. These systems rely on high-pressure hydraulic fluid to provide the final stopping force, ensuring a reliable hydraulic fallback system.
  • For boardroom consideration, the shift towards sustainable components, such as copper-free friction materials and eco-friendly hydraulic fluids, is no longer optional but a strategic imperative driven by global regulations. The development of ventilated calipers and other thermal management solutions addresses the challenge of brake fade under heavy thermal loads from high-performance applications.
  • With firms reporting a 30% improvement in braking consistency, investment in these advanced hydraulic actuators and high-boiling-point fluids is critical for maintaining a competitive edge.

What are the Key Data Covered in this Hydraulic Brakes Market Research and Growth Report?

  • What is the expected growth of the Hydraulic Brakes Market between 2026 and 2030?

    • USD 8.54 billion, at a CAGR of 6.1%

  • What segmentation does the market report cover?

    • The report is segmented by Type (Friction type, Non friction type, Elevator, and Others), Application (Automotive, Industrial machinery, Construction equipment, and Marine applications), End-user (OEMs, Aftermarket, and Maintenance and repair services) and Geography (APAC, North America, Europe, South America, Middle East and Africa)

  • Which regions are analyzed in the report?

    • APAC, North America, Europe, South America and Middle East and Africa

  • What are the key growth drivers and market challenges?

    • Stringent global safety regulations and mandatory braking standards, Escalating costs of raw materials and global supply chain volatility

  • Who are the major players in the Hydraulic Brakes Market?

    • AISIN Corp., Akebono Brake Industry Co., AP Racing Ltd, Brembo SpA, Continental AG, Dana Inc., Dorman Products Inc., Haldex AB, Hitachi Astemo Ltd., HL Mando Co. Ltd., Knorr Bremse AG, Robert Bosch GmbH, Shimano Inc., SRAM LLC, Valeo SA, Wabtec Corp., Wilwood Engineering Inc. and ZF Friedrichshafen AG

Market Research Insights

  • The market's dynamics are shaped by a confluence of technological evolution and stringent regulatory pressures. The integration of electronic controls with traditional fluid power mechanics is central, enabling advanced safety features and accommodating electric vehicle architectures. This synergy allows for precise hydraulic pressure modulation and brake fade prevention.
  • As a result, systems that combine hydraulic system maintenance with digital diagnostics are gaining traction, with some integrated platforms reducing unsprung mass by 20%. Furthermore, the push for sustainability has led to advancements in eco-friendly hydraulic fluids and corrosion-resistant materials, extending component life by up to 30%.
  • The emphasis on force multiplication and reliable braking force distribution ensures that hydraulic technology remains critical, even as brake-by-wire systems become more prevalent.

We can help! Our analysts can customize this hydraulic brakes market research report to meet your requirements.

Get in touch

1. Executive Summary

1.1 Market overview

Executive Summary - Chart on Market Overview
Executive Summary - Data Table on Market Overview
Executive Summary - Chart on Global Market Characteristics
Executive Summary - Chart on Market by Geography
Executive Summary - Chart on Market Segmentation by Type
Executive Summary - Chart on Market Segmentation by Application
Executive Summary - Chart on Market Segmentation by End-user
Executive Summary - Chart on Incremental Growth
Executive Summary - Data Table on Incremental Growth
Executive Summary - Chart on Company Market Positioning

2. Technavio Analysis

2.1 Analysis of price sensitivity, lifecycle, customer purchase basket, adoption rates, and purchase criteria

2.2 Criticality of inputs and Factors of differentiation

Chart on Overview on criticality of inputs and factors of differentiation

2.3 Factors of disruption

Chart on Overview on factors of disruption

2.4 Impact of drivers and challenges

Chart on Impact of drivers and challenges in 2025 and 2030

3. Market Landscape

3.1 Market ecosystem

Chart on Parent Market
Data Table on - Parent Market

3.2 Market characteristics

Chart on Market characteristics analysis

3.3 Value chain analysis

Chart on Value chain analysis

4. Market Sizing

4.1 Market definition

Data Table on Offerings of companies included in the market definition

4.2 Market segment analysis

Market segments

4.3 Market size 2025

4.4 Market outlook: Forecast for 2025-2030

Chart on Global - Market size and forecast 2025-2030 ($ million)
Data Table on Global - Market size and forecast 2025-2030 ($ million)
Chart on Global Market: Year-over-year growth 2025-2030 (%)
Data Table on Global Market: Year-over-year growth 2025-2030 (%)

5. Historic Market Size

5.1 Global Hydraulic Brakes Market 2020 - 2024

Historic Market Size - Data Table on Global Hydraulic Brakes Market 2020 - 2024 ($ million)

5.2 Type segment analysis 2020 - 2024

Historic Market Size - Type Segment 2020 - 2024 ($ million)

5.3 Application segment analysis 2020 - 2024

Historic Market Size - Application Segment 2020 - 2024 ($ million)

5.4 End-user segment analysis 2020 - 2024

Historic Market Size - End-user Segment 2020 - 2024 ($ million)

5.5 Geography segment analysis 2020 - 2024

Historic Market Size - Geography Segment 2020 - 2024 ($ million)

5.6 Country segment analysis 2020 - 2024

Historic Market Size - Country Segment 2020 - 2024 ($ million)

6. Qualitative Analysis

6.1 The impact of AI on Global Hydraulic Brakes Market

6.2 Impact of geopolitical conflicts on Global Hydraulic Brakes Market

7. Five Forces Analysis

7.1 Five forces summary

Five forces analysis - Comparison between 2025 and 2030

7.2 Bargaining power of buyers

Bargaining power of buyers - Impact of key factors 2025 and 2030

7.3 Bargaining power of suppliers

Bargaining power of suppliers - Impact of key factors in 2025 and 2030

7.4 Threat of new entrants

Threat of new entrants - Impact of key factors in 2025 and 2030

7.5 Threat of substitutes

Threat of substitutes - Impact of key factors in 2025 and 2030

7.6 Threat of rivalry

Threat of rivalry - Impact of key factors in 2025 and 2030

7.7 Market condition

Chart on Market condition - Five forces 2025 and 2030

8. Market Segmentation by Type

8.1 Market segments

Chart on Type - Market share 2025-2030 (%)
Data Table on Type - Market share 2025-2030 (%)

8.2 Comparison by Type

Chart on Comparison by Type
Data Table on Comparison by Type

8.3 Friction type - Market size and forecast 2025-2030

Chart on Friction type - Market size and forecast 2025-2030 ($ million)
Data Table on Friction type - Market size and forecast 2025-2030 ($ million)
Chart on Friction type - Year-over-year growth 2025-2030 (%)
Data Table on Friction type - Year-over-year growth 2025-2030 (%)

8.4 Non friction type - Market size and forecast 2025-2030

Chart on Non friction type - Market size and forecast 2025-2030 ($ million)
Data Table on Non friction type - Market size and forecast 2025-2030 ($ million)
Chart on Non friction type - Year-over-year growth 2025-2030 (%)
Data Table on Non friction type - Year-over-year growth 2025-2030 (%)

8.5 Elevator - Market size and forecast 2025-2030

Chart on Elevator - Market size and forecast 2025-2030 ($ million)
Data Table on Elevator - Market size and forecast 2025-2030 ($ million)
Chart on Elevator - Year-over-year growth 2025-2030 (%)
Data Table on Elevator - Year-over-year growth 2025-2030 (%)

8.6 Others - Market size and forecast 2025-2030

Chart on Others - Market size and forecast 2025-2030 ($ million)
Data Table on Others - Market size and forecast 2025-2030 ($ million)
Chart on Others - Year-over-year growth 2025-2030 (%)
Data Table on Others - Year-over-year growth 2025-2030 (%)

8.7 Market opportunity by Type

Market opportunity by Type ($ million)
Data Table on Market opportunity by Type ($ million)

9. Market Segmentation by Application

9.1 Market segments

Chart on Application - Market share 2025-2030 (%)
Data Table on Application - Market share 2025-2030 (%)

9.2 Comparison by Application

Chart on Comparison by Application
Data Table on Comparison by Application

9.3 Automotive - Market size and forecast 2025-2030

Chart on Automotive - Market size and forecast 2025-2030 ($ million)
Data Table on Automotive - Market size and forecast 2025-2030 ($ million)
Chart on Automotive - Year-over-year growth 2025-2030 (%)
Data Table on Automotive - Year-over-year growth 2025-2030 (%)

9.4 Industrial machinery - Market size and forecast 2025-2030

Chart on Industrial machinery - Market size and forecast 2025-2030 ($ million)
Data Table on Industrial machinery - Market size and forecast 2025-2030 ($ million)
Chart on Industrial machinery - Year-over-year growth 2025-2030 (%)
Data Table on Industrial machinery - Year-over-year growth 2025-2030 (%)

9.5 Construction equipment - Market size and forecast 2025-2030

Chart on Construction equipment - Market size and forecast 2025-2030 ($ million)
Data Table on Construction equipment - Market size and forecast 2025-2030 ($ million)
Chart on Construction equipment - Year-over-year growth 2025-2030 (%)
Data Table on Construction equipment - Year-over-year growth 2025-2030 (%)

9.6 Marine applications - Market size and forecast 2025-2030

Chart on Marine applications - Market size and forecast 2025-2030 ($ million)
Data Table on Marine applications - Market size and forecast 2025-2030 ($ million)
Chart on Marine applications - Year-over-year growth 2025-2030 (%)
Data Table on Marine applications - Year-over-year growth 2025-2030 (%)

9.7 Market opportunity by Application

Market opportunity by Application ($ million)
Data Table on Market opportunity by Application ($ million)

10. Market Segmentation by End-user

10.1 Market segments

Chart on End-user - Market share 2025-2030 (%)
Data Table on End-user - Market share 2025-2030 (%)

10.2 Comparison by End-user

Chart on Comparison by End-user
Data Table on Comparison by End-user

10.3 OEMs - Market size and forecast 2025-2030

Chart on OEMs - Market size and forecast 2025-2030 ($ million)
Data Table on OEMs - Market size and forecast 2025-2030 ($ million)
Chart on OEMs - Year-over-year growth 2025-2030 (%)
Data Table on OEMs - Year-over-year growth 2025-2030 (%)

10.4 Aftermarket - Market size and forecast 2025-2030

Chart on Aftermarket - Market size and forecast 2025-2030 ($ million)
Data Table on Aftermarket - Market size and forecast 2025-2030 ($ million)
Chart on Aftermarket - Year-over-year growth 2025-2030 (%)
Data Table on Aftermarket - Year-over-year growth 2025-2030 (%)

10.5 Maintenance and repair services - Market size and forecast 2025-2030

Chart on Maintenance and repair services - Market size and forecast 2025-2030 ($ million)
Data Table on Maintenance and repair services - Market size and forecast 2025-2030 ($ million)
Chart on Maintenance and repair services - Year-over-year growth 2025-2030 (%)
Data Table on Maintenance and repair services - Year-over-year growth 2025-2030 (%)

10.6 Market opportunity by End-user

Market opportunity by End-user ($ million)
Data Table on Market opportunity by End-user ($ million)

11. Customer Landscape

11.1 Customer landscape overview

Analysis of price sensitivity, lifecycle, customer purchase basket, adoption rates, and purchase criteria

12. Geographic Landscape

12.1 Geographic segmentation

Chart on Market share by geography 2025-2030 (%)
Data Table on Market share by geography 2025-2030 (%)

12.2 Geographic comparison

Chart on Geographic comparison
Data Table on Geographic comparison

12.3 APAC - Market size and forecast 2025-2030

Chart on APAC - Market size and forecast 2025-2030 ($ million)
Data Table on APAC - Market size and forecast 2025-2030 ($ million)
Chart on APAC - Year-over-year growth 2025-2030 (%)
Data Table on APAC - Year-over-year growth 2025-2030 (%)
Chart on Regional Comparison - APAC
Data Table on Regional Comparison - APAC

12.3.1 China - Market size and forecast 2025-2030

Chart on China - Market size and forecast 2025-2030 ($ million)
Data Table on China - Market size and forecast 2025-2030 ($ million)
Chart on China - Year-over-year growth 2025-2030 (%)
Data Table on China - Year-over-year growth 2025-2030 (%)

12.3.2 India - Market size and forecast 2025-2030

Chart on India - Market size and forecast 2025-2030 ($ million)
Data Table on India - Market size and forecast 2025-2030 ($ million)
Chart on India - Year-over-year growth 2025-2030 (%)
Data Table on India - Year-over-year growth 2025-2030 (%)

12.3.3 Japan - Market size and forecast 2025-2030

Chart on Japan - Market size and forecast 2025-2030 ($ million)
Data Table on Japan - Market size and forecast 2025-2030 ($ million)
Chart on Japan - Year-over-year growth 2025-2030 (%)
Data Table on Japan - Year-over-year growth 2025-2030 (%)

12.3.4 South Korea - Market size and forecast 2025-2030

Chart on South Korea - Market size and forecast 2025-2030 ($ million)
Data Table on South Korea - Market size and forecast 2025-2030 ($ million)
Chart on South Korea - Year-over-year growth 2025-2030 (%)
Data Table on South Korea - Year-over-year growth 2025-2030 (%)

12.3.5 Indonesia - Market size and forecast 2025-2030

Chart on Indonesia - Market size and forecast 2025-2030 ($ million)
Data Table on Indonesia - Market size and forecast 2025-2030 ($ million)
Chart on Indonesia - Year-over-year growth 2025-2030 (%)
Data Table on Indonesia - Year-over-year growth 2025-2030 (%)

12.3.6 Australia - Market size and forecast 2025-2030

Chart on Australia - Market size and forecast 2025-2030 ($ million)
Data Table on Australia - Market size and forecast 2025-2030 ($ million)
Chart on Australia - Year-over-year growth 2025-2030 (%)
Data Table on Australia - Year-over-year growth 2025-2030 (%)

12.4 North America - Market size and forecast 2025-2030

Chart on North America - Market size and forecast 2025-2030 ($ million)
Data Table on North America - Market size and forecast 2025-2030 ($ million)
Chart on North America - Year-over-year growth 2025-2030 (%)
Data Table on North America - Year-over-year growth 2025-2030 (%)
Chart on Regional Comparison - North America
Data Table on Regional Comparison - North America

12.4.1 US - Market size and forecast 2025-2030

Chart on US - Market size and forecast 2025-2030 ($ million)
Data Table on US - Market size and forecast 2025-2030 ($ million)
Chart on US - Year-over-year growth 2025-2030 (%)
Data Table on US - Year-over-year growth 2025-2030 (%)

12.4.2 Canada - Market size and forecast 2025-2030

Chart on Canada - Market size and forecast 2025-2030 ($ million)
Data Table on Canada - Market size and forecast 2025-2030 ($ million)
Chart on Canada - Year-over-year growth 2025-2030 (%)
Data Table on Canada - Year-over-year growth 2025-2030 (%)

12.4.3 Mexico - Market size and forecast 2025-2030

Chart on Mexico - Market size and forecast 2025-2030 ($ million)
Data Table on Mexico - Market size and forecast 2025-2030 ($ million)
Chart on Mexico - Year-over-year growth 2025-2030 (%)
Data Table on Mexico - Year-over-year growth 2025-2030 (%)

12.5 Europe - Market size and forecast 2025-2030

Chart on Europe - Market size and forecast 2025-2030 ($ million)
Data Table on Europe - Market size and forecast 2025-2030 ($ million)
Chart on Europe - Year-over-year growth 2025-2030 (%)
Data Table on Europe - Year-over-year growth 2025-2030 (%)
Chart on Regional Comparison - Europe
Data Table on Regional Comparison - Europe

12.5.1 Germany - Market size and forecast 2025-2030

Chart on Germany - Market size and forecast 2025-2030 ($ million)
Data Table on Germany - Market size and forecast 2025-2030 ($ million)
Chart on Germany - Year-over-year growth 2025-2030 (%)
Data Table on Germany - Year-over-year growth 2025-2030 (%)

12.5.2 France - Market size and forecast 2025-2030

Chart on France - Market size and forecast 2025-2030 ($ million)
Data Table on France - Market size and forecast 2025-2030 ($ million)
Chart on France - Year-over-year growth 2025-2030 (%)
Data Table on France - Year-over-year growth 2025-2030 (%)

12.5.3 UK - Market size and forecast 2025-2030

Chart on UK - Market size and forecast 2025-2030 ($ million)
Data Table on UK - Market size and forecast 2025-2030 ($ million)
Chart on UK - Year-over-year growth 2025-2030 (%)
Data Table on UK - Year-over-year growth 2025-2030 (%)

12.5.4 Italy - Market size and forecast 2025-2030

Chart on Italy - Market size and forecast 2025-2030 ($ million)
Data Table on Italy - Market size and forecast 2025-2030 ($ million)
Chart on Italy - Year-over-year growth 2025-2030 (%)
Data Table on Italy - Year-over-year growth 2025-2030 (%)

12.5.5 Spain - Market size and forecast 2025-2030

Chart on Spain - Market size and forecast 2025-2030 ($ million)
Data Table on Spain - Market size and forecast 2025-2030 ($ million)
Chart on Spain - Year-over-year growth 2025-2030 (%)
Data Table on Spain - Year-over-year growth 2025-2030 (%)

12.5.6 The Netherlands - Market size and forecast 2025-2030

Chart on The Netherlands - Market size and forecast 2025-2030 ($ million)
Data Table on The Netherlands - Market size and forecast 2025-2030 ($ million)
Chart on The Netherlands - Year-over-year growth 2025-2030 (%)
Data Table on The Netherlands - Year-over-year growth 2025-2030 (%)

12.6 South America - Market size and forecast 2025-2030

Chart on South America - Market size and forecast 2025-2030 ($ million)
Data Table on South America - Market size and forecast 2025-2030 ($ million)
Chart on South America - Year-over-year growth 2025-2030 (%)
Data Table on South America - Year-over-year growth 2025-2030 (%)
Chart on Regional Comparison - South America
Data Table on Regional Comparison - South America

12.6.1 Brazil - Market size and forecast 2025-2030

Chart on Brazil - Market size and forecast 2025-2030 ($ million)
Data Table on Brazil - Market size and forecast 2025-2030 ($ million)
Chart on Brazil - Year-over-year growth 2025-2030 (%)
Data Table on Brazil - Year-over-year growth 2025-2030 (%)

12.6.2 Argentina - Market size and forecast 2025-2030

Chart on Argentina - Market size and forecast 2025-2030 ($ million)
Data Table on Argentina - Market size and forecast 2025-2030 ($ million)
Chart on Argentina - Year-over-year growth 2025-2030 (%)
Data Table on Argentina - Year-over-year growth 2025-2030 (%)

12.6.3 Colombia - Market size and forecast 2025-2030

Chart on Colombia - Market size and forecast 2025-2030 ($ million)
Data Table on Colombia - Market size and forecast 2025-2030 ($ million)
Chart on Colombia - Year-over-year growth 2025-2030 (%)
Data Table on Colombia - Year-over-year growth 2025-2030 (%)

12.7 Middle East and Africa - Market size and forecast 2025-2030

Chart on Middle East and Africa - Market size and forecast 2025-2030 ($ million)
Data Table on Middle East and Africa - Market size and forecast 2025-2030 ($ million)
Chart on Middle East and Africa - Year-over-year growth 2025-2030 (%)
Data Table on Middle East and Africa - Year-over-year growth 2025-2030 (%)
Chart on Regional Comparison - Middle East and Africa
Data Table on Regional Comparison - Middle East and Africa

12.7.1 South Africa - Market size and forecast 2025-2030

Chart on South Africa - Market size and forecast 2025-2030 ($ million)
Data Table on South Africa - Market size and forecast 2025-2030 ($ million)
Chart on South Africa - Year-over-year growth 2025-2030 (%)
Data Table on South Africa - Year-over-year growth 2025-2030 (%)

12.7.2 Saudi Arabia - Market size and forecast 2025-2030

Chart on Saudi Arabia - Market size and forecast 2025-2030 ($ million)
Data Table on Saudi Arabia - Market size and forecast 2025-2030 ($ million)
Chart on Saudi Arabia - Year-over-year growth 2025-2030 (%)
Data Table on Saudi Arabia - Year-over-year growth 2025-2030 (%)

12.7.3 UAE - Market size and forecast 2025-2030

Chart on UAE - Market size and forecast 2025-2030 ($ million)
Data Table on UAE - Market size and forecast 2025-2030 ($ million)
Chart on UAE - Year-over-year growth 2025-2030 (%)
Data Table on UAE - Year-over-year growth 2025-2030 (%)

12.7.4 Egypt - Market size and forecast 2025-2030

Chart on Egypt - Market size and forecast 2025-2030 ($ million)
Data Table on Egypt - Market size and forecast 2025-2030 ($ million)
Chart on Egypt - Year-over-year growth 2025-2030 (%)
Data Table on Egypt - Year-over-year growth 2025-2030 (%)

12.7.5 Nigeria - Market size and forecast 2025-2030

Chart on Nigeria - Market size and forecast 2025-2030 ($ million)
Data Table on Nigeria - Market size and forecast 2025-2030 ($ million)
Chart on Nigeria - Year-over-year growth 2025-2030 (%)
Data Table on Nigeria - Year-over-year growth 2025-2030 (%)

12.8 Market opportunity by geography

Market opportunity by geography ($ million)
Data Tables on Market opportunity by geography ($ million)

13. Drivers, Challenges, and Opportunity

13.1 Market drivers

Stringent global safety regulations and mandatory braking standards
Rapid urbanization and infrastructure expansion in emerging economies
Technological evolution and shift toward electro-hydraulic braking in electric vehicles

13.2 Market challenges

Escalating costs of raw materials and global supply chain volatility
Complexity of integrating traditional hydraulic hardware with digital control architectures
Increasingly stringent environmental regulations regarding brake emissions and fluid disposal

13.3 Impact of drivers and challenges

Impact of drivers and challenges in 2025 and 2030

13.4 Market opportunities

Integration of electro-hydraulic braking and brake-by-wire systems
Advancements in sustainable friction materials and eco-friendly hydraulic fluids
Adoption of advanced lightweight materials and enhanced thermal management solutions

14. Competitive Landscape

14.1 Overview

14.2

Overview on criticality of inputs and factors of differentiation

14.3 Landscape disruption

Overview on factors of disruption

14.4 Industry risks

Impact of key risks on business

15. Competitive Analysis

15.1 Companies profiled

Companies covered

15.2 Company ranking index

15.3 Market positioning of companies

Matrix on companies position and classification

15.4 AISIN Corp.

AISIN Corp. - Overview
AISIN Corp. - Business segments
AISIN Corp. - Key news
AISIN Corp. - Key offerings
AISIN Corp. - Segment focus
SWOT

15.5 Akebono Brake Industry Co.

Akebono Brake Industry Co. - Overview
Akebono Brake Industry Co. - Business segments
Akebono Brake Industry Co. - Key offerings
Akebono Brake Industry Co. - Segment focus
SWOT

15.6 AP Racing Ltd

AP Racing Ltd - Overview
AP Racing Ltd - Product / Service
AP Racing Ltd - Key offerings
SWOT

15.7 Brembo SpA

Brembo SpA - Overview
Brembo SpA - Business segments
Brembo SpA - Key news
Brembo SpA - Key offerings
Brembo SpA - Segment focus
SWOT

15.8 Continental AG

Continental AG - Overview
Continental AG - Business segments
Continental AG - Key news
Continental AG - Key offerings
Continental AG - Segment focus
SWOT

15.9 Dana Inc.

Dana Inc. - Overview
Dana Inc. - Business segments
Dana Inc. - Key news
Dana Inc. - Key offerings
Dana Inc. - Segment focus
SWOT

15.10 Dorman Products Inc.

Dorman Products Inc. - Overview
Dorman Products Inc. - Product / Service
Dorman Products Inc. - Key offerings
SWOT

15.11 Haldex AB

Haldex AB - Overview
Haldex AB - Product / Service
Haldex AB - Key offerings
SWOT

15.12 Hitachi Astemo Ltd.

Hitachi Astemo Ltd. - Overview
Hitachi Astemo Ltd. - Product / Service
Hitachi Astemo Ltd. - Key offerings
SWOT

15.13 HL Mando Co. Ltd.

HL Mando Co. Ltd. - Overview
HL Mando Co. Ltd. - Product / Service
HL Mando Co. Ltd. - Key offerings
SWOT

15.14 Knorr Bremse AG

Knorr Bremse AG - Overview
Knorr Bremse AG - Business segments
Knorr Bremse AG - Key offerings
Knorr Bremse AG - Segment focus
SWOT

15.15 Robert Bosch GmbH

Robert Bosch GmbH - Overview
Robert Bosch GmbH - Product / Service
Robert Bosch GmbH - Key offerings
SWOT

15.16 Shimano Inc.

Shimano Inc. - Overview
Shimano Inc. - Business segments
Shimano Inc. - Key offerings
Shimano Inc. - Segment focus
SWOT

15.17 SRAM LLC

SRAM LLC - Overview
SRAM LLC - Product / Service
SRAM LLC - Key offerings
SWOT

15.18 Valeo SA

Valeo SA - Overview
Valeo SA - Business segments
Valeo SA - Key offerings
Valeo SA - Segment focus
SWOT

16. Appendix

16.1 Scope of the report

Market definition
Objectives
Notes and caveats

16.2 Inclusions and exclusions checklist

Inclusions checklist
Exclusions checklist

16.3 Currency conversion rates for US$

16.4 Research methodology

16.5 Data procurement

Information sources

16.6 Data validation

16.7 Validation techniques employed for market sizing

16.8 Data synthesis

16.9 360 degree market analysis

16.10 List of abbreviations

Research Methodology

Technavio presents a detailed picture of the market by way of study, synthesis, and summation of data from multiple sources. The analysts have presented the various facets of the market with a particular focus on identifying the key industry influencers. The data thus presented is comprehensive, reliable, and the result of extensive research, both primary and secondary.

INFORMATION SOURCES

Primary sources

  • Manufacturers and suppliers
  • Channel partners
  • Industry experts
  • Strategic decision makers

Secondary sources

  • Industry journals and periodicals
  • Government data
  • Financial reports of key industry players
  • Historical data
  • Press releases

DATA ANALYSIS

Data Synthesis

  • Collation of data
  • Estimation of key figures
  • Analysis of derived insights

Data Validation

  • Triangulation with data models
  • Reference against proprietary databases
  • Corroboration with industry experts

REPORT WRITING

Qualitative

  • Market drivers
  • Market challenges
  • Market trends
  • Five forces analysis

Quantitative

  • Market size and forecast
  • Market segmentation
  • Geographical insights
  • Competitive landscape

Interested in this report?

Get your sample now to see our research methodology and insights!

Download Now

Frequently Asked Questions

Hydraulic Brakes market growth will increase by USD 8535.1 million during 2026-2030.

The Hydraulic Brakes market is expected to grow at a CAGR of 6.1% during 2026-2030.

Hydraulic Brakes market is segmented by Type (Friction type, Non friction type, Elevator, Others) Application (Automotive, Industrial machinery, Construction equipment, Marine applications) End-user (OEMs, Aftermarket, Maintenance and repair services)

AISIN Corp., Akebono Brake Industry Co., AP Racing Ltd, Brembo SpA, Continental AG, Dana Inc., Dorman Products Inc., Haldex AB, Hitachi Astemo Ltd., HL Mando Co. Ltd., Knorr Bremse AG, Robert Bosch GmbH, Shimano Inc., SRAM LLC, Valeo SA, Wabtec Corp., Wilwood Engineering Inc., ZF Friedrichshafen AG are a few of the key vendors in the Hydraulic Brakes market.

APAC will register the highest growth rate of 46.3% among the other regions. Therefore, the Hydraulic Brakes market in APAC is expected to garner significant business opportunities for the vendors during the forecast period.

China, India, Japan, South Korea, Indonesia, Australia, US, Canada, Mexico, Germany, France, UK, Italy, Spain, The Netherlands, Brazil, Argentina, Colombia, South Africa, Saudi Arabia, UAE, Egypt, Nigeria

  • Stringent global safety regulations and mandatory braking standards is the driving factor this market.

The Hydraulic Brakes market vendors should focus on grabbing business opportunities from the Type segment as it accounted for the largest market share in the base year.
RIA - Research AI Assistant
Ask RIA