Hyperscale Data Center Market Analysis, Size, and Forecast 2026-2030: North America (US, Canada, and Mexico), APAC (China, Japan, and India), Europe (UK, Germany, and France), South America (Brazil and Argentina), Middle East and Africa (Saudi Arabia, South Africa, and UAE), and Rest of World (ROW)

Hyperscale Data Center Market Analysis, Size, and Forecast 2026-2030:
North America (US, Canada, and Mexico), APAC (China, Japan, and India), Europe (UK, Germany, and France), South America (Brazil and Argentina), Middle East and Africa (Saudi Arabia, South Africa, and UAE), and Rest of World (ROW)

Published: Mar 2026 302 Pages SKU: IRTNTR43498

Market Overview at a Glance

$305.77 B
Market Opportunity
24.6%
CAGR 2025 - 2030
33%
North America Growth
$102.06 B
Critical infrastructure segment 2024

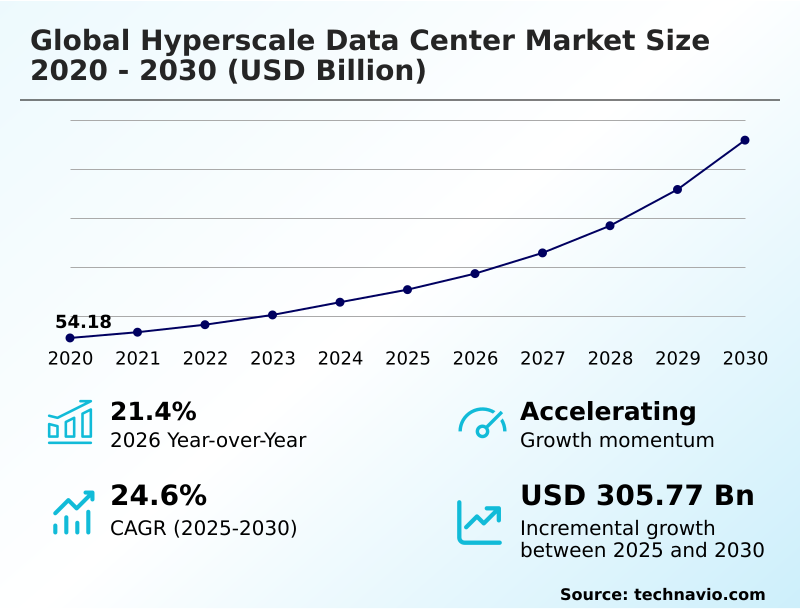
Hyperscale Data Center Market Size 2026-2030

The hyperscale data center market size is valued to increase by USD 305.77 billion, at a CAGR of 24.6% from 2025 to 2030. Exponential demand for generative AI workloads will drive the hyperscale data center market.

Major Market Trends & Insights

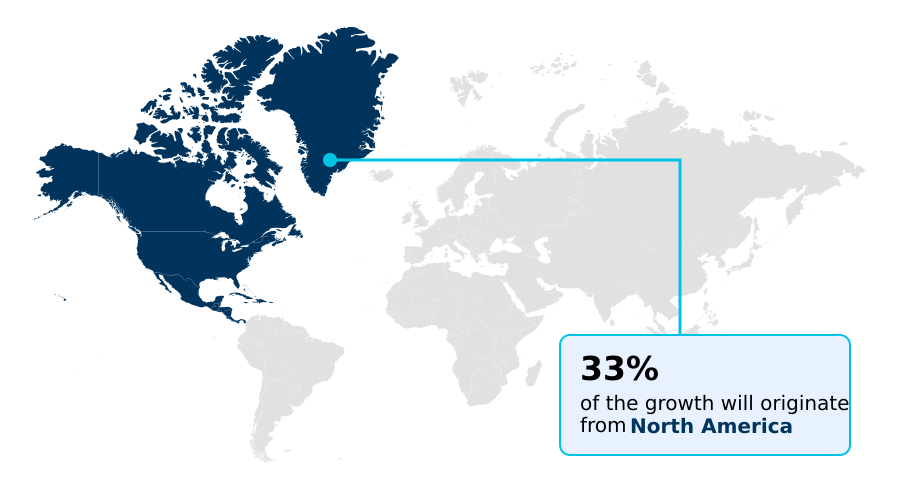
  • North America dominated the market and accounted for a 33% growth during the forecast period.
  • By Type - Critical infrastructure segment was valued at USD 102.06 billion in 2024
  • By End-user - BFSI segment accounted for the largest market revenue share in 2024

Market Size & Forecast

  • Market Opportunities: USD 404.61 billion
  • Market Future Opportunities: USD 305.77 billion
  • CAGR from 2025 to 2030 : 24.6%

Market Summary

  • The hyperscale data center market is undergoing a profound transformation, moving beyond traditional cloud services to become the engine of the AI revolution. This shift is driven by the need for high-performance computing clusters capable of training and deploying complex large language models.
  • A key dynamic is the growing enforcement of data residency laws, compelling operators to build sovereign cloud regions that comply with national regulations. For instance, a global logistics firm must now utilize localized hyperscale infrastructure to process real-time IoT data from its fleet, ensuring compliance while optimizing supply chain efficiency.
  • Simultaneously, sustainability has become a critical operational mandate, pushing the industry toward carbon-free energy sources and innovative designs like waste-heat recovery systems. These facilities are no longer just real estate assets; they are advanced, automated factories for computation, balancing immense power demands with environmental responsibility.
  • The convergence of these forces is reshaping site selection, facility design, and the very economics of digital infrastructure, making it a critical bottleneck and value driver in the modern economy.

What will be the Size of the Hyperscale Data Center Market during the forecast period?

Get Key Insights on Market Forecast (PDF) Request Free Sample

How is the Hyperscale Data Center Market Segmented?

The hyperscale data center industry research report provides comprehensive data (region-wise segment analysis), with forecasts and estimates in "USD million" for the period 2026-2030, as well as historical data from 2020-2024 for the following segments.
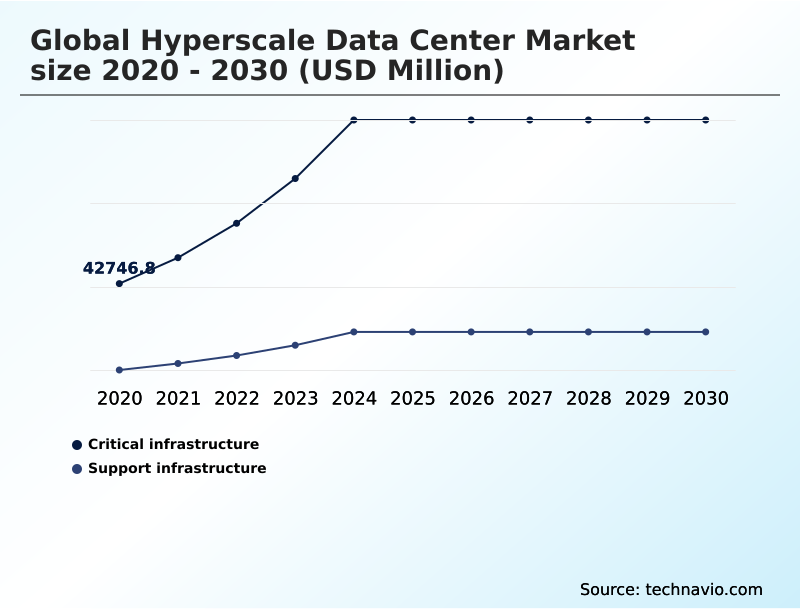
  • Type
    • Critical infrastructure
    • Support infrastructure
  • End-user
    • BFSI
    • Energy
    • IT
    • Others
  • Capacity
    • 10-50 MW
    • 50-100 MW
    • Above 100 MW
  • Geography
    • North America
      • US
      • Canada
      • Mexico
    • APAC
      • China
      • Japan
      • India
    • Europe
      • UK
      • Germany
      • France
    • South America
      • Brazil
      • Argentina
    • Middle East and Africa
      • Saudi Arabia
      • South Africa
      • UAE
    • Rest of World (ROW)

By Type Insights

The critical infrastructure segment is estimated to witness significant growth during the forecast period.

The critical infrastructure segment is fundamentally evolving, driven by the intense demands of AI workload optimization. Legacy server designs are being supplanted by rack-scale integrated systems that combine graphical processing units, specialized accelerators, and data processing units into cohesive clusters.

This architectural shift, essential for generative AI infrastructure and other mission-critical workloads, supports advanced networking fabrics like 800-gigabit ethernet, which is crucial for preventing data bottlenecks. The use of custom server rail kits facilitates the deployment of these high-density configurations.

These new architectures are delivering up to a 40% improvement in data throughput, enabling organizations to accelerate complex computations and gain a competitive edge. This transformation underscores a market-wide move toward specialized, high-performance hardware designed for the AI era.

Request Free Sample

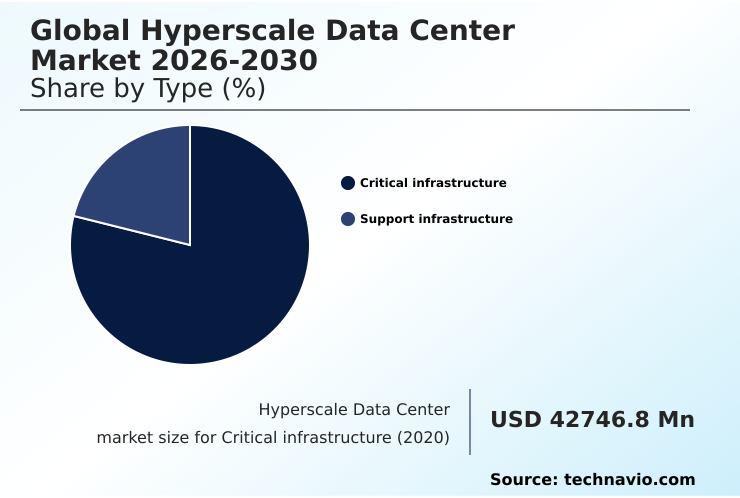
The Critical infrastructure segment was valued at USD 102.06 billion in 2024 and showed a gradual increase during the forecast period.

Request Free Sample

Regional Analysis

North America is estimated to contribute 33% to the growth of the global market during the forecast period.Technavio’s analysts have elaborately explained the regional trends and drivers that shape the market during the forecast period.

See How Hyperscale Data Center Market Demand is Rising in North America Request Free Sample

The geographic landscape of the hyperscale data center market is undergoing significant diversification, driven by power constraints in primary hubs and the strategic need for global connectivity nodes.

While North America continues to lead, contributing 33% of the incremental growth, APAC is a close second at 31.48%, fueled by rapid digital transformation.

This trend is compelling operators to pursue secondary market expansion into regions with available power and land.

The deployment of new subsea cable systems is also opening fresh corridors, supporting tier 2 market growth and enabling cloud-native architectures in previously underserved areas.

This decentralization addresses data localization mandates and improves low-latency delivery, which is essential for digital sovereignty requirements and the proliferation of edge integration. Strategic investments in these new regions are critical for building network resilience and tapping into high-growth economies.

Market Dynamics

Our researchers analyzed the data with 2025 as the base year, along with the key drivers, trends, and challenges. A holistic analysis of drivers will help companies refine their marketing strategies to gain a competitive advantage.

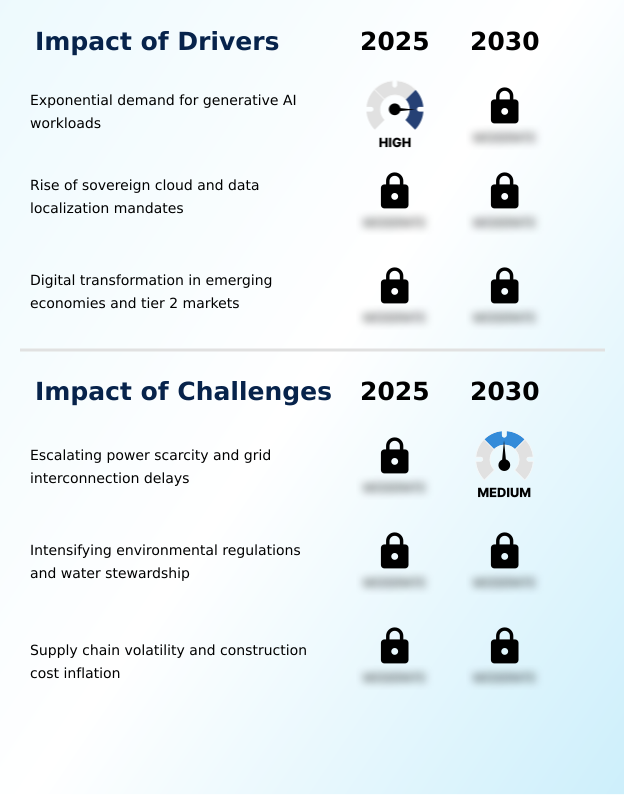
  • Analyzing the global hyperscale data center market 2026-2030 drivers reveals that the impact of generative AI on facility design is the foremost catalyst, compelling a complete re-evaluation of power and cooling.
  • The global hyperscale data center market 2026-2030 trends point toward sustainable energy in hyperscale data centers, with a notable rise in agreements for nuclear energy for AI data centers to ensure stable, carbon-free power. However, the global hyperscale data center market 2026-2030 challenges are significant, as power grid constraints on data center construction create multi-year delays.
  • The construction cost for AI-ready facilities is escalating, reflecting the complexity of integrating high-performance networking for AI clusters and advanced cooling. Examining direct-to-chip vs immersion cooling trade-offs has become standard, with facilities engineered for these technologies showing divergent operational expenditures; some achieve double-digit percentage point improvements in power usage effectiveness over legacy designs.
  • AI inference server high density requirements necessitate liquid cooling for high performance compute. Furthermore, data sovereignty impact on cloud architecture is driving investment in sovereign cloud security and compliance protocols and modular data centers for edge computing, especially to comply with data residency laws in the European Union.
  • This is fueling emerging markets hyperscale data center investment, where subsea cable impact on regional connectivity is unlocking new potential. Meanwhile, practices like waste heat reuse in urban data centers and the use of battery storage systems for grid stability are becoming crucial for obtaining operational licenses.

What are the key market drivers leading to the rise in the adoption of Hyperscale Data Center Industry?

  • The exponential demand for generative AI workloads serves as the primary engine propelling market expansion.

  • The market's primary driver is the insatiable demand for generative AI workloads, which is compelling a shift toward an AI factory design.
  • This requires facilities to support high-density power racks and advanced cooling, as generative AI infrastructure increases power density requirements by up to 10x compared to traditional workloads.
  • A second powerful driver is the rise of sovereign cloud and data localization mandates, which has spurred a 40% increase in regional data center construction to meet digital sovereignty requirements. This trend transforms data centers into critical national security infrastructure.
  • Lastly, rapid digital transformation in emerging economies is fueling secondary market expansion. The move to cloud-native architectures in these regions, combined with new subsea cable systems, is creating a self-reinforcing cycle of digital ecosystem growth.

What are the market trends shaping the Hyperscale Data Center Industry?

  • The proliferation of generative AI and high-density compute clusters is reshaping infrastructure requirements. This shift drives a fundamental redesign of facilities to accommodate unprecedented power and cooling demands.

  • Key trends are reshaping the global hyperscale data center market, led by the transition to sustainable energy and advanced thermal management. To meet carbon-neutrality goals, operators are implementing closed-loop liquid cooling systems and dry cooling technologies, with the adoption of liquid cooling services reducing water usage by over 90% in new builds.
  • This focus on environmental stewardship is coupled with the strategic decentralization of footprints to address digital sovereignty requirements. The construction of modular data center designs in new regions ensures compliance with data localization mandates and supports low-latency delivery. This approach has been shown to cut time-to-market for new capacity by up to 25%.
  • These shifts in AI factory design ensure that modern infrastructure is resilient, efficient, and aligned with both regulatory pressures and performance demands for generative AI infrastructure.

What challenges does the Hyperscale Data Center Industry face during its growth?

  • Escalating power scarcity and prolonged grid interconnection delays present the most significant challenge to market growth.

  • The most formidable challenge is escalating power scarcity, as grid interconnection delays have extended project timelines by an average of 18-24 months in primary markets. This forces operators to invest in on-site dispatchable generation or pursue behind-the-meter generation.
  • A second challenge is intensifying environmental regulation, with new IT equipment performance standards and mandates for water usage effectiveness complicating design and operations. This is particularly true in water-stressed regions, where closed-loop liquid cooling systems are becoming mandatory.
  • Finally, supply chain volatility and construction cost inflation remain persistent issues, with costs for AI-ready facilities running approximately 10% higher than traditional builds due to the demand for specialized components like high-density power distribution units and the scarcity of skilled labor.

Exclusive Technavio Analysis on Customer Landscape

The hyperscale data center market forecasting report includes the adoption lifecycle of the market, covering from the innovator’s stage to the laggard’s stage. It focuses on adoption rates in different regions based on penetration. Furthermore, the hyperscale data center market report also includes key purchase criteria and drivers of price sensitivity to help companies evaluate and develop their market growth analysis strategies.

Customer Landscape of Hyperscale Data Center Industry

Competitive Landscape

Companies are implementing various strategies, such as strategic alliances, hyperscale data center market forecast, partnerships, mergers and acquisitions, geographical expansion, and product/service launches, to enhance their presence in the industry.

Alibaba Cloud - Key offerings provide globally scaled infrastructure designed for massive compute, storage, big data, and AI workloads, enabling rapid and on-demand resource expansion for enterprises.

The industry research and growth report includes detailed analyses of the competitive landscape of the market and information about key companies, including:

  • Alibaba Cloud
  • Amazon.com Inc.
  • CoreSite Realty Corp.
  • CyrusOne LLC
  • Digital Realty Trust Inc.
  • Equinix Inc.
  • Google LLC
  • HCL Technologies Ltd.
  • IBM Corp.
  • KDDI Corp.
  • Meta Platforms Inc.
  • Microsoft Corp.
  • Nippon Telegraph and Corp.
  • OVH Groupe SA
  • Rackspace Technology Inc.
  • SAP SE
  • Scaleway SAS
  • Tata Communications Ltd.
  • Tencent Holdings Ltd.
  • Vantage Data Centers Management

Qualitative and quantitative analysis of companies has been conducted to help clients understand the wider business environment as well as the strengths and weaknesses of key industry players. Data is qualitatively analyzed to categorize companies as pure play, category-focused, industry-focused, and diversified; it is quantitatively analyzed to categorize companies as dominant, leading, strong, tentative, and weak.

Recent Development and News in Hyperscale data center market

  • In October 2024, Google signed a Master Plant Development Agreement with Kairos Power to purchase nuclear energy, securing a carbon-free power supply for its expanding AI data centers in the United States.
  • In May 2024, Google commenced construction on a $2 billion data center and cloud region in Selangor, Malaysia, to support surging regional demand for cloud and AI services.
  • In March 2025, Microsoft initiated a massive construction project in Ohio to build a dedicated cluster for advanced neural network training, signaling a shift toward specialized hyperscale sites.
  • In April 2025, Amazon Web Services entered a long-term agreement with a nuclear energy provider in Pennsylvania, securing a dedicated, carbon-free electricity supply for its East Coast operations.

Dive into Technavio’s robust research methodology, blending expert interviews, extensive data synthesis, and validated models for unparalleled Hyperscale Data Center Market insights. See full methodology.

Market Scope
Page number 302
Base year 2025
Historic period 2020-2024
Forecast period 2026-2030
Growth momentum & CAGR Accelerate at a CAGR of 24.6%
Market growth 2026-2030 USD 305772.2 million
Market structure Fragmented
YoY growth 2025-2026(%) 21.4%
Key countries US, Canada, Mexico, China, Japan, India, South Korea, Australia, Indonesia, UK, Germany, France, Italy, Spain, The Netherlands, Brazil, Argentina, Chile, Saudi Arabia, South Africa, UAE, Israel and Egypt
Competitive landscape Leading Companies, Market Positioning of Companies, Competitive Strategies, and Industry Risks

Request Free Sample

Research Analyst Overview

  • The hyperscale data center market is defined by a fundamental redesign of its physical layer to support next-generation computing. The industry is rapidly deploying high-performance computing clusters powered by graphical processing units and other specialized accelerators.
  • This transition necessitates a move to rack-scale integrated systems and high-density power racks, supported by advanced thermal management like direct-to-chip cooling, immersion cooling techniques, and rear-door heat exchangers. To meet sustainability goals, operators are integrating carbon-free energy sources, including small modular reactors and battery-energy storage systems, alongside waste-heat recovery systems.
  • The adoption of rack-scale integrated systems has enabled a 30% increase in compute density per square foot. Architectures are shifting to accommodate high-density power distribution units and coolant distribution units, often within a hybrid infrastructure model.
  • This evolution is driven by the need to create an AI factory design capable of handling immense computational loads while navigating grid interconnection delays and data residency laws through strategic behind-the-meter generation and sovereign cloud regions.

What are the Key Data Covered in this Hyperscale Data Center Market Research and Growth Report?

  • What is the expected growth of the Hyperscale Data Center Market between 2026 and 2030?

    • USD 305.77 billion, at a CAGR of 24.6%

  • What segmentation does the market report cover?

    • The report is segmented by Type (Critical infrastructure, and Support infrastructure), End-user (BFSI, Energy, IT, and Others), Capacity (10-50 MW, 50-100 MW, and Above 100 MW) and Geography (North America, APAC, Europe, South America, Middle East and Africa)

  • Which regions are analyzed in the report?

    • North America, APAC, Europe, South America and Middle East and Africa

  • What are the key growth drivers and market challenges?

    • Exponential demand for generative AI workloads, Escalating power scarcity and grid interconnection delays

  • Who are the major players in the Hyperscale Data Center Market?

    • Alibaba Cloud, Amazon.com Inc., CoreSite Realty Corp., CyrusOne LLC, Digital Realty Trust Inc., Equinix Inc., Google LLC, HCL Technologies Ltd., IBM Corp., KDDI Corp., Meta Platforms Inc., Microsoft Corp., Nippon Telegraph and Corp., OVH Groupe SA, Rackspace Technology Inc., SAP SE, Scaleway SAS, Tata Communications Ltd., Tencent Holdings Ltd. and Vantage Data Centers Management

Market Research Insights

  • The market is shaped by the convergence of digital sovereignty requirements and the push for infrastructure-as-a-service. A focus on environmental stewardship is driving carbon-neutral operations, with some operators reducing energy consumption by over 20%. As data localization mandates intensify, secondary market expansion and tier 2 market growth are accelerating.
  • This supports the deployment of cloud-native architectures and hybrid cloud architectures, with colocation service providers playing a key role in building out global connectivity nodes and interconnection hubs. To meet demands for public sector cloud adoption and the financial technology sector, operators prioritize low-latency delivery and network density.
  • These efforts facilitate digital ecosystem growth and support mission-critical workloads, with unified cloud management platforms enabling up to a 30% improvement in operational efficiency across diverse deployments.

We can help! Our analysts can customize this hyperscale data center market research report to meet your requirements.

Get in touch

1. Executive Summary

1.1 Market overview

Executive Summary - Chart on Market Overview
Executive Summary - Data Table on Market Overview
Executive Summary - Chart on Global Market Characteristics
Executive Summary - Chart on Market by Geography
Executive Summary - Chart on Market Segmentation by Type
Executive Summary - Chart on Market Segmentation by End-user
Executive Summary - Chart on Market Segmentation by Capacity
Executive Summary - Chart on Incremental Growth
Executive Summary - Data Table on Incremental Growth
Executive Summary - Chart on Company Market Positioning

2. Technavio Analysis

2.1 Analysis of price sensitivity, lifecycle, customer purchase basket, adoption rates, and purchase criteria

2.2 Criticality of inputs and Factors of differentiation

Chart on Overview on criticality of inputs and factors of differentiation

2.3 Factors of disruption

Chart on Overview on factors of disruption

2.4 Impact of drivers and challenges

Chart on Impact of drivers and challenges in 2025 and 2030

3. Market Landscape

3.1 Market ecosystem

Chart on Parent Market
Data Table on - Parent Market

3.2 Market characteristics

Chart on Market characteristics analysis

3.3 Value chain analysis

Chart on Value chain analysis

4. Market Sizing

4.1 Market definition

Data Table on Offerings of companies included in the market definition

4.2 Market segment analysis

Market segments

4.3 Market size 2025

4.4 Market outlook: Forecast for 2025-2030

Chart on Global - Market size and forecast 2025-2030 ($ million)
Data Table on Global - Market size and forecast 2025-2030 ($ million)
Chart on Global Market: Year-over-year growth 2025-2030 (%)
Data Table on Global Market: Year-over-year growth 2025-2030 (%)

5. Historic Market Size

5.1 Global Hyperscale Data Center Market 2020 - 2024

Historic Market Size - Data Table on Global Hyperscale Data Center Market 2020 - 2024 ($ million)

5.2 Type segment analysis 2020 - 2024

Historic Market Size - Type Segment 2020 - 2024 ($ million)

5.3 End-user segment analysis 2020 - 2024

Historic Market Size - End-user Segment 2020 - 2024 ($ million)

5.4 Capacity segment analysis 2020 - 2024

Historic Market Size - Capacity Segment 2020 - 2024 ($ million)

5.5 Geography segment analysis 2020 - 2024

Historic Market Size - Geography Segment 2020 - 2024 ($ million)

5.6 Country segment analysis 2020 - 2024

Historic Market Size - Country Segment 2020 - 2024 ($ million)

6. Qualitative Analysis

6.1 Impact of AI on Global Hyperscale Data Center Market

7. Five Forces Analysis

7.1 Five forces summary

Five forces analysis - Comparison between 2025 and 2030

7.2 Bargaining power of buyers

Bargaining power of buyers - Impact of key factors 2025 and 2030

7.3 Bargaining power of suppliers

Bargaining power of suppliers - Impact of key factors in 2025 and 2030

7.4 Threat of new entrants

Threat of new entrants - Impact of key factors in 2025 and 2030

7.5 Threat of substitutes

Threat of substitutes - Impact of key factors in 2025 and 2030

7.6 Threat of rivalry

Threat of rivalry - Impact of key factors in 2025 and 2030

7.7 Market condition

Chart on Market condition - Five forces 2025 and 2030

8. Market Segmentation by Type

8.1 Market segments

Chart on Type - Market share 2025-2030 (%)
Data Table on Type - Market share 2025-2030 (%)

8.2 Comparison by Type

Chart on Comparison by Type
Data Table on Comparison by Type

8.3 Critical infrastructure - Market size and forecast 2025-2030

Chart on Critical infrastructure - Market size and forecast 2025-2030 ($ million)
Data Table on Critical infrastructure - Market size and forecast 2025-2030 ($ million)
Chart on Critical infrastructure - Year-over-year growth 2025-2030 (%)
Data Table on Critical infrastructure - Year-over-year growth 2025-2030 (%)

8.4 Support infrastructure - Market size and forecast 2025-2030

Chart on Support infrastructure - Market size and forecast 2025-2030 ($ million)
Data Table on Support infrastructure - Market size and forecast 2025-2030 ($ million)
Chart on Support infrastructure - Year-over-year growth 2025-2030 (%)
Data Table on Support infrastructure - Year-over-year growth 2025-2030 (%)

8.5 Market opportunity by Type

Market opportunity by Type ($ million)
Data Table on Market opportunity by Type ($ million)

9. Market Segmentation by End-user

9.1 Market segments

Chart on End-user - Market share 2025-2030 (%)
Data Table on End-user - Market share 2025-2030 (%)

9.2 Comparison by End-user

Chart on Comparison by End-user
Data Table on Comparison by End-user

9.3 BFSI - Market size and forecast 2025-2030

Chart on BFSI - Market size and forecast 2025-2030 ($ million)
Data Table on BFSI - Market size and forecast 2025-2030 ($ million)
Chart on BFSI - Year-over-year growth 2025-2030 (%)
Data Table on BFSI - Year-over-year growth 2025-2030 (%)

9.4 Energy - Market size and forecast 2025-2030

Chart on Energy - Market size and forecast 2025-2030 ($ million)
Data Table on Energy - Market size and forecast 2025-2030 ($ million)
Chart on Energy - Year-over-year growth 2025-2030 (%)
Data Table on Energy - Year-over-year growth 2025-2030 (%)

9.5 IT - Market size and forecast 2025-2030

Chart on IT - Market size and forecast 2025-2030 ($ million)
Data Table on IT - Market size and forecast 2025-2030 ($ million)
Chart on IT - Year-over-year growth 2025-2030 (%)
Data Table on IT - Year-over-year growth 2025-2030 (%)

9.6 Others - Market size and forecast 2025-2030

Chart on Others - Market size and forecast 2025-2030 ($ million)
Data Table on Others - Market size and forecast 2025-2030 ($ million)
Chart on Others - Year-over-year growth 2025-2030 (%)
Data Table on Others - Year-over-year growth 2025-2030 (%)

9.7 Market opportunity by End-user

Market opportunity by End-user ($ million)
Data Table on Market opportunity by End-user ($ million)

10. Market Segmentation by Capacity

10.1 Market segments

Chart on Capacity - Market share 2025-2030 (%)
Data Table on Capacity - Market share 2025-2030 (%)

10.2 Comparison by Capacity

Chart on Comparison by Capacity
Data Table on Comparison by Capacity

10.3 10-50 MW - Market size and forecast 2025-2030

Chart on 10-50 MW - Market size and forecast 2025-2030 ($ million)
Data Table on 10-50 MW - Market size and forecast 2025-2030 ($ million)
Chart on 10-50 MW - Year-over-year growth 2025-2030 (%)
Data Table on 10-50 MW - Year-over-year growth 2025-2030 (%)

10.4 50-100 MW - Market size and forecast 2025-2030

Chart on 50-100 MW - Market size and forecast 2025-2030 ($ million)
Data Table on 50-100 MW - Market size and forecast 2025-2030 ($ million)
Chart on 50-100 MW - Year-over-year growth 2025-2030 (%)
Data Table on 50-100 MW - Year-over-year growth 2025-2030 (%)

10.5 Above 100 MW - Market size and forecast 2025-2030

Chart on Above 100 MW - Market size and forecast 2025-2030 ($ million)
Data Table on Above 100 MW - Market size and forecast 2025-2030 ($ million)
Chart on Above 100 MW - Year-over-year growth 2025-2030 (%)
Data Table on Above 100 MW - Year-over-year growth 2025-2030 (%)

10.6 Market opportunity by Capacity

Market opportunity by Capacity ($ million)
Data Table on Market opportunity by Capacity ($ million)

11. Customer Landscape

11.1 Customer landscape overview

Analysis of price sensitivity, lifecycle, customer purchase basket, adoption rates, and purchase criteria

12. Geographic Landscape

12.1 Geographic segmentation

Chart on Market share by geography 2025-2030 (%)
Data Table on Market share by geography 2025-2030 (%)

12.2 Geographic comparison

Chart on Geographic comparison
Data Table on Geographic comparison

12.3 North America - Market size and forecast 2025-2030

Chart on North America - Market size and forecast 2025-2030 ($ million)
Data Table on North America - Market size and forecast 2025-2030 ($ million)
Chart on North America - Year-over-year growth 2025-2030 (%)
Data Table on North America - Year-over-year growth 2025-2030 (%)
Chart on Regional Comparison - North America
Data Table on Regional Comparison - North America

12.3.1 US - Market size and forecast 2025-2030

Chart on US - Market size and forecast 2025-2030 ($ million)
Data Table on US - Market size and forecast 2025-2030 ($ million)
Chart on US - Year-over-year growth 2025-2030 (%)
Data Table on US - Year-over-year growth 2025-2030 (%)

12.3.2 Canada - Market size and forecast 2025-2030

Chart on Canada - Market size and forecast 2025-2030 ($ million)
Data Table on Canada - Market size and forecast 2025-2030 ($ million)
Chart on Canada - Year-over-year growth 2025-2030 (%)
Data Table on Canada - Year-over-year growth 2025-2030 (%)

12.3.3 Mexico - Market size and forecast 2025-2030

Chart on Mexico - Market size and forecast 2025-2030 ($ million)
Data Table on Mexico - Market size and forecast 2025-2030 ($ million)
Chart on Mexico - Year-over-year growth 2025-2030 (%)
Data Table on Mexico - Year-over-year growth 2025-2030 (%)

12.4 APAC - Market size and forecast 2025-2030

Chart on APAC - Market size and forecast 2025-2030 ($ million)
Data Table on APAC - Market size and forecast 2025-2030 ($ million)
Chart on APAC - Year-over-year growth 2025-2030 (%)
Data Table on APAC - Year-over-year growth 2025-2030 (%)
Chart on Regional Comparison - APAC
Data Table on Regional Comparison - APAC

12.4.1 China - Market size and forecast 2025-2030

Chart on China - Market size and forecast 2025-2030 ($ million)
Data Table on China - Market size and forecast 2025-2030 ($ million)
Chart on China - Year-over-year growth 2025-2030 (%)
Data Table on China - Year-over-year growth 2025-2030 (%)

12.4.2 Japan - Market size and forecast 2025-2030

Chart on Japan - Market size and forecast 2025-2030 ($ million)
Data Table on Japan - Market size and forecast 2025-2030 ($ million)
Chart on Japan - Year-over-year growth 2025-2030 (%)
Data Table on Japan - Year-over-year growth 2025-2030 (%)

12.4.3 India - Market size and forecast 2025-2030

Chart on India - Market size and forecast 2025-2030 ($ million)
Data Table on India - Market size and forecast 2025-2030 ($ million)
Chart on India - Year-over-year growth 2025-2030 (%)
Data Table on India - Year-over-year growth 2025-2030 (%)

12.4.4 South Korea - Market size and forecast 2025-2030

Chart on South Korea - Market size and forecast 2025-2030 ($ million)
Data Table on South Korea - Market size and forecast 2025-2030 ($ million)
Chart on South Korea - Year-over-year growth 2025-2030 (%)
Data Table on South Korea - Year-over-year growth 2025-2030 (%)

12.4.5 Australia - Market size and forecast 2025-2030

Chart on Australia - Market size and forecast 2025-2030 ($ million)
Data Table on Australia - Market size and forecast 2025-2030 ($ million)
Chart on Australia - Year-over-year growth 2025-2030 (%)
Data Table on Australia - Year-over-year growth 2025-2030 (%)

12.4.6 Indonesia - Market size and forecast 2025-2030

Chart on Indonesia - Market size and forecast 2025-2030 ($ million)
Data Table on Indonesia - Market size and forecast 2025-2030 ($ million)
Chart on Indonesia - Year-over-year growth 2025-2030 (%)
Data Table on Indonesia - Year-over-year growth 2025-2030 (%)

12.5 Europe - Market size and forecast 2025-2030

Chart on Europe - Market size and forecast 2025-2030 ($ million)
Data Table on Europe - Market size and forecast 2025-2030 ($ million)
Chart on Europe - Year-over-year growth 2025-2030 (%)
Data Table on Europe - Year-over-year growth 2025-2030 (%)
Chart on Regional Comparison - Europe
Data Table on Regional Comparison - Europe

12.5.1 UK - Market size and forecast 2025-2030

Chart on UK - Market size and forecast 2025-2030 ($ million)
Data Table on UK - Market size and forecast 2025-2030 ($ million)
Chart on UK - Year-over-year growth 2025-2030 (%)
Data Table on UK - Year-over-year growth 2025-2030 (%)

12.5.2 Germany - Market size and forecast 2025-2030

Chart on Germany - Market size and forecast 2025-2030 ($ million)
Data Table on Germany - Market size and forecast 2025-2030 ($ million)
Chart on Germany - Year-over-year growth 2025-2030 (%)
Data Table on Germany - Year-over-year growth 2025-2030 (%)

12.5.3 France - Market size and forecast 2025-2030

Chart on France - Market size and forecast 2025-2030 ($ million)
Data Table on France - Market size and forecast 2025-2030 ($ million)
Chart on France - Year-over-year growth 2025-2030 (%)
Data Table on France - Year-over-year growth 2025-2030 (%)

12.5.4 Italy - Market size and forecast 2025-2030

Chart on Italy - Market size and forecast 2025-2030 ($ million)
Data Table on Italy - Market size and forecast 2025-2030 ($ million)
Chart on Italy - Year-over-year growth 2025-2030 (%)
Data Table on Italy - Year-over-year growth 2025-2030 (%)

12.5.5 Spain - Market size and forecast 2025-2030

Chart on Spain - Market size and forecast 2025-2030 ($ million)
Data Table on Spain - Market size and forecast 2025-2030 ($ million)
Chart on Spain - Year-over-year growth 2025-2030 (%)
Data Table on Spain - Year-over-year growth 2025-2030 (%)

12.5.6 The Netherlands - Market size and forecast 2025-2030

Chart on The Netherlands - Market size and forecast 2025-2030 ($ million)
Data Table on The Netherlands - Market size and forecast 2025-2030 ($ million)
Chart on The Netherlands - Year-over-year growth 2025-2030 (%)
Data Table on The Netherlands - Year-over-year growth 2025-2030 (%)

12.6 South America - Market size and forecast 2025-2030

Chart on South America - Market size and forecast 2025-2030 ($ million)
Data Table on South America - Market size and forecast 2025-2030 ($ million)
Chart on South America - Year-over-year growth 2025-2030 (%)
Data Table on South America - Year-over-year growth 2025-2030 (%)
Chart on Regional Comparison - South America
Data Table on Regional Comparison - South America

12.6.1 Brazil - Market size and forecast 2025-2030

Chart on Brazil - Market size and forecast 2025-2030 ($ million)
Data Table on Brazil - Market size and forecast 2025-2030 ($ million)
Chart on Brazil - Year-over-year growth 2025-2030 (%)
Data Table on Brazil - Year-over-year growth 2025-2030 (%)

12.6.2 Argentina - Market size and forecast 2025-2030

Chart on Argentina - Market size and forecast 2025-2030 ($ million)
Data Table on Argentina - Market size and forecast 2025-2030 ($ million)
Chart on Argentina - Year-over-year growth 2025-2030 (%)
Data Table on Argentina - Year-over-year growth 2025-2030 (%)

12.6.3 Chile - Market size and forecast 2025-2030

Chart on Chile - Market size and forecast 2025-2030 ($ million)
Data Table on Chile - Market size and forecast 2025-2030 ($ million)
Chart on Chile - Year-over-year growth 2025-2030 (%)
Data Table on Chile - Year-over-year growth 2025-2030 (%)

12.7 Middle East and Africa - Market size and forecast 2025-2030

Chart on Middle East and Africa - Market size and forecast 2025-2030 ($ million)
Data Table on Middle East and Africa - Market size and forecast 2025-2030 ($ million)
Chart on Middle East and Africa - Year-over-year growth 2025-2030 (%)
Data Table on Middle East and Africa - Year-over-year growth 2025-2030 (%)
Chart on Regional Comparison - Middle East and Africa
Data Table on Regional Comparison - Middle East and Africa

12.7.1 Saudi Arabia - Market size and forecast 2025-2030

Chart on Saudi Arabia - Market size and forecast 2025-2030 ($ million)
Data Table on Saudi Arabia - Market size and forecast 2025-2030 ($ million)
Chart on Saudi Arabia - Year-over-year growth 2025-2030 (%)
Data Table on Saudi Arabia - Year-over-year growth 2025-2030 (%)

12.7.2 South Africa - Market size and forecast 2025-2030

Chart on South Africa - Market size and forecast 2025-2030 ($ million)
Data Table on South Africa - Market size and forecast 2025-2030 ($ million)
Chart on South Africa - Year-over-year growth 2025-2030 (%)
Data Table on South Africa - Year-over-year growth 2025-2030 (%)

12.7.3 UAE - Market size and forecast 2025-2030

Chart on UAE - Market size and forecast 2025-2030 ($ million)
Data Table on UAE - Market size and forecast 2025-2030 ($ million)
Chart on UAE - Year-over-year growth 2025-2030 (%)
Data Table on UAE - Year-over-year growth 2025-2030 (%)

12.7.4 Israel - Market size and forecast 2025-2030

Chart on Israel - Market size and forecast 2025-2030 ($ million)
Data Table on Israel - Market size and forecast 2025-2030 ($ million)
Chart on Israel - Year-over-year growth 2025-2030 (%)
Data Table on Israel - Year-over-year growth 2025-2030 (%)

12.7.5 Egypt - Market size and forecast 2025-2030

Chart on Egypt - Market size and forecast 2025-2030 ($ million)
Data Table on Egypt - Market size and forecast 2025-2030 ($ million)
Chart on Egypt - Year-over-year growth 2025-2030 (%)
Data Table on Egypt - Year-over-year growth 2025-2030 (%)

12.8 Market opportunity by geography

Market opportunity by geography ($ million)
Data Tables on Market opportunity by geography ($ million)

13. Drivers, Challenges, and Opportunity

13.1 Market drivers

Exponential demand for generative AI workloads
Rise of sovereign cloud and data localization mandates
Digital transformation in emerging economies and tier 2 markets

13.2 Market challenges

Escalating power scarcity and grid interconnection delays
Intensifying environmental regulations and water stewardship
Supply chain volatility and construction cost inflation

13.3 Impact of drivers and challenges

Impact of drivers and challenges in 2025 and 2030

13.4 Market opportunities

Proliferation of generative AI and high-density compute clusters
Transition toward sustainable energy infrastructure and liquid cooling adoption
Strategic decentralization and rise of sovereign cloud requirements

14. Competitive Landscape

14.1 Overview

14.2

Overview on criticality of inputs and factors of differentiation

14.3 Landscape disruption

Overview on factors of disruption

14.4 Industry risks

Impact of key risks on business

15. Competitive Analysis

15.1 Companies profiled

Companies covered

15.2 Company ranking index

15.3 Market positioning of companies

Matrix on companies position and classification

15.4 Alibaba Cloud

Alibaba Cloud - Overview
Alibaba Cloud - Product / Service
Alibaba Cloud - Key offerings
SWOT

15.5 Amazon.com Inc.

Amazon.com Inc. - Overview
Amazon.com Inc. - Business segments
Amazon.com Inc. - Key news
Amazon.com Inc. - Key offerings
Amazon.com Inc. - Segment focus
SWOT

15.6 Digital Realty Trust Inc.

Digital Realty Trust Inc. - Overview
Digital Realty Trust Inc. - Product / Service
Digital Realty Trust Inc. - Key news
Digital Realty Trust Inc. - Key offerings
SWOT

15.7 Google LLC

Google LLC - Overview
Google LLC - Product / Service
Google LLC - Key offerings
SWOT

15.8 HCL Technologies Ltd.

HCL Technologies Ltd. - Overview
HCL Technologies Ltd. - Business segments
HCL Technologies Ltd. - Key news
HCL Technologies Ltd. - Key offerings
HCL Technologies Ltd. - Segment focus
SWOT

15.9 IBM Corp.

IBM Corp. - Overview
IBM Corp. - Business segments
IBM Corp. - Key news
IBM Corp. - Key offerings
IBM Corp. - Segment focus
SWOT

15.10 KDDI Corp.

KDDI Corp. - Overview
KDDI Corp. - Business segments
KDDI Corp. - Key offerings
KDDI Corp. - Segment focus
SWOT

15.11 Meta Platforms Inc.

Meta Platforms Inc. - Overview
Meta Platforms Inc. - Business segments
Meta Platforms Inc. - Key offerings
Meta Platforms Inc. - Segment focus
SWOT

15.12 Microsoft Corp.

Microsoft Corp. - Overview
Microsoft Corp. - Business segments
Microsoft Corp. - Key news
Microsoft Corp. - Key offerings
Microsoft Corp. - Segment focus
SWOT

15.13 Nippon Telegraph and Corp.

Nippon Telegraph and Corp. - Overview
Nippon Telegraph and Corp. - Business segments
Nippon Telegraph and Corp. - Key news
Nippon Telegraph and Corp. - Key offerings
Nippon Telegraph and Corp. - Segment focus
SWOT

15.14 OVH Groupe SA

OVH Groupe SA - Overview
OVH Groupe SA - Business segments
OVH Groupe SA - Key news
OVH Groupe SA - Key offerings
OVH Groupe SA - Segment focus
SWOT

15.15 Rackspace Technology Inc.

Rackspace Technology Inc. - Overview
Rackspace Technology Inc. - Business segments
Rackspace Technology Inc. - Key news
Rackspace Technology Inc. - Key offerings
Rackspace Technology Inc. - Segment focus
SWOT

15.16 SAP SE

SAP SE - Overview
SAP SE - Business segments
SAP SE - Key news
SAP SE - Key offerings
SAP SE - Segment focus
SWOT

15.17 Scaleway SAS

Scaleway SAS - Overview
Scaleway SAS - Product / Service
Scaleway SAS - Key offerings
SWOT

15.18 Tencent Holdings Ltd.

Tencent Holdings Ltd. - Overview
Tencent Holdings Ltd. - Business segments
Tencent Holdings Ltd. - Key news
Tencent Holdings Ltd. - Key offerings
Tencent Holdings Ltd. - Segment focus
SWOT

16. Appendix

16.1 Scope of the report

Market definition
Objectives
Notes and caveats

16.2 Inclusions and exclusions checklist

Inclusions checklist
Exclusions checklist

16.3 Currency conversion rates for US$

16.4 Research methodology

16.5 Data procurement

Information sources

16.6 Data validation

16.7 Validation techniques employed for market sizing

16.8 Data synthesis

16.9 360 degree market analysis

16.10 List of abbreviations

Research Methodology

Technavio presents a detailed picture of the market by way of study, synthesis, and summation of data from multiple sources. The analysts have presented the various facets of the market with a particular focus on identifying the key industry influencers. The data thus presented is comprehensive, reliable, and the result of extensive research, both primary and secondary.

INFORMATION SOURCES

Primary sources

  • Manufacturers and suppliers
  • Channel partners
  • Industry experts
  • Strategic decision makers

Secondary sources

  • Industry journals and periodicals
  • Government data
  • Financial reports of key industry players
  • Historical data
  • Press releases

DATA ANALYSIS

Data Synthesis

  • Collation of data
  • Estimation of key figures
  • Analysis of derived insights

Data Validation

  • Triangulation with data models
  • Reference against proprietary databases
  • Corroboration with industry experts

REPORT WRITING

Qualitative

  • Market drivers
  • Market challenges
  • Market trends
  • Five forces analysis

Quantitative

  • Market size and forecast
  • Market segmentation
  • Geographical insights
  • Competitive landscape

Interested in this report?

Get your sample now to see our research methodology and insights!

Download Now

Frequently Asked Questions

Hyperscale Data Center market growth will increase by USD 305772.2 million during 2026-2030.

The Hyperscale Data Center market is expected to grow at a CAGR of 24.6% during 2026-2030.

Hyperscale Data Center market is segmented by Type (Critical infrastructure, Support infrastructure) End-user (BFSI, Energy, IT, Others) Capacity (10-50 MW, 50-100 MW, Above 100 MW)

Alibaba Cloud, Amazon.com Inc., CoreSite Realty Corp., CyrusOne LLC, Digital Realty Trust Inc., Equinix Inc., Google LLC, HCL Technologies Ltd., IBM Corp., KDDI Corp., Meta Platforms Inc., Microsoft Corp., Nippon Telegraph and Corp., OVH Groupe SA, Rackspace Technology Inc., SAP SE, Scaleway SAS, Tata Communications Ltd., Tencent Holdings Ltd., Vantage Data Centers Management are a few of the key vendors in the Hyperscale Data Center market.

North America will register the highest growth rate of 33% among the other regions. Therefore, the Hyperscale Data Center market in North America is expected to garner significant business opportunities for the vendors during the forecast period.

US, Canada, Mexico, China, Japan, India, South Korea, Australia, Indonesia, UK, Germany, France, Italy, Spain, The Netherlands, Brazil, Argentina, Chile, Saudi Arabia, South Africa, UAE, Israel, Egypt

  • Exponential demand for generative AI workloads is the driving factor this market.

The Hyperscale Data Center market vendors should focus on grabbing business opportunities from the Type segment as it accounted for the largest market share in the base year.