Hyperspectral Imaging Market Analysis, Size, and Forecast 2026-2030: North America (US, Canada, and Mexico), APAC (China, India, and Japan), Europe (Germany, UK, and France), South America (Brazil and Argentina), Middle East and Africa (Saudi Arabia, UAE, and South Africa), and Rest of World (ROW)

Hyperspectral Imaging Market Analysis, Size, and Forecast 2026-2030:
North America (US, Canada, and Mexico), APAC (China, India, and Japan), Europe (Germany, UK, and France), South America (Brazil and Argentina), Middle East and Africa (Saudi Arabia, UAE, and South Africa), and Rest of World (ROW)

Published: Dec 2025 289 Pages SKU: IRTNTR44344

Market Overview at a Glance

$1.10 B
Market Opportunity
13.3%
CAGR 2025 - 2030
34.6%
North America Growth
$296.5 Mn
Military and surveillance segment 2024

Hyperspectral Imaging Market Size 2026-2030

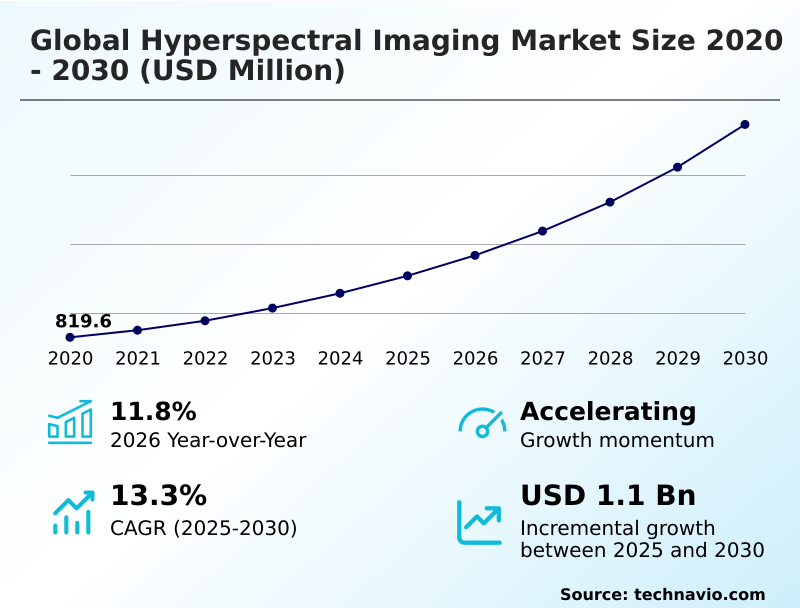
The hyperspectral imaging market size is valued to increase by USD 1.10 billion, at a CAGR of 13.3% from 2025 to 2030. Rising integration in night vision systems will drive the hyperspectral imaging market.

Major Market Trends & Insights

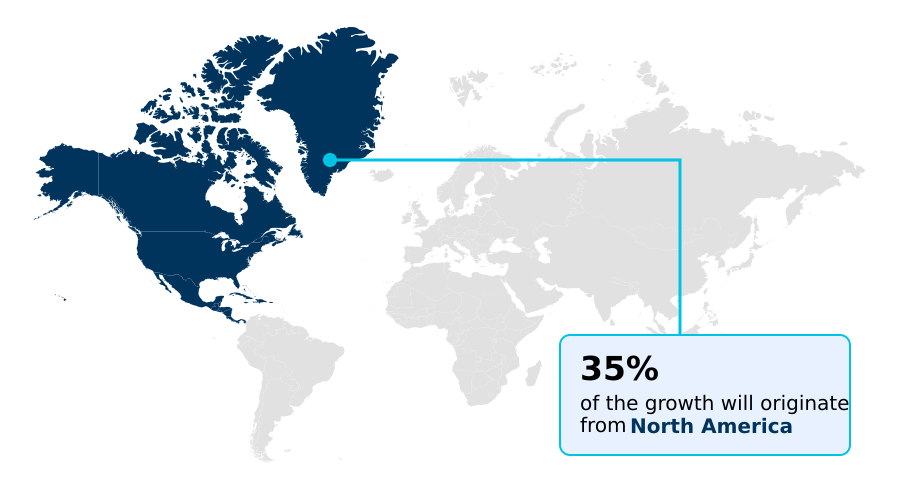
  • North America dominated the market and accounted for a 34.6% growth during the forecast period.
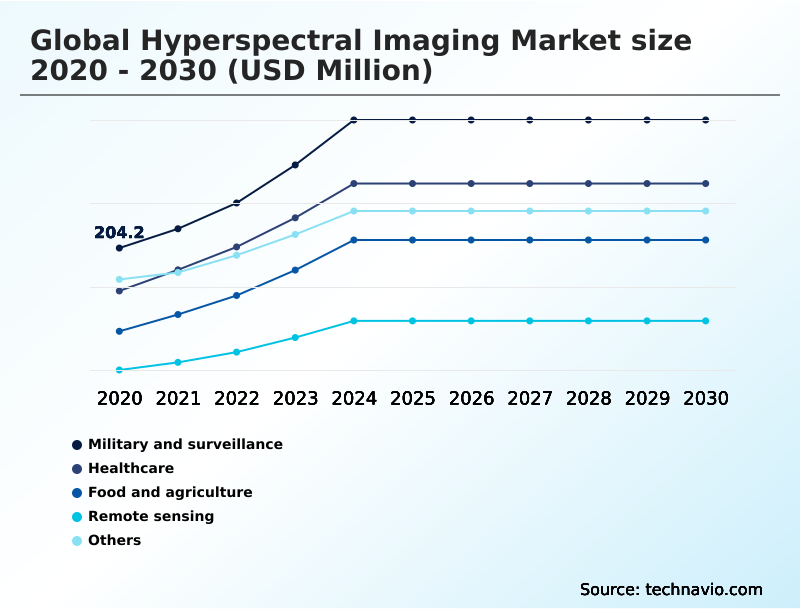
  • By Application - Military and surveillance segment was valued at USD 296.5 million in 2024
  • By Product - Cameras segment accounted for the largest market revenue share in 2024

Market Size & Forecast

  • Market Opportunities: USD 1.55 billion
  • Market Future Opportunities: USD 1.10 billion
  • CAGR from 2025 to 2030 : 13.3%

Market Summary

  • The hyperspectral imaging market is transitioning from specialized research to mainstream industrial and environmental applications. Key drivers include the miniaturization of sensors, enabling their deployment on unmanned aerial vehicles for precision agriculture and infrastructure monitoring. This technology provides a unique chemical fingerprinting capability, allowing for early disease detection in crops or identifying methane leaks from pipelines.
  • A significant trend is the fusion of spectral data with AI algorithms, which automates material classification and anomaly detection, making insights accessible to non-experts. For instance, a global logistics company can use hyperspectral machine vision for industrial sorting, verifying product authenticity and detecting contaminants in real time, thereby securing its supply chain and reducing recall-related losses by a significant margin.
  • However, adoption is tempered by challenges, including the high upfront cost of hyperspectral camera systems and the complexity of processing the large hyperspectral data cube they produce. As data processing becomes more efficient and hardware costs decline, the technology is poised for broader integration across sectors seeking granular, actionable intelligence for operational excellence and environmental stewardship.

What will be the Size of the Hyperspectral Imaging Market during the forecast period?

Get Key Insights on Market Forecast (PDF) Request Free Sample

How is the Hyperspectral Imaging Market Segmented?

The hyperspectral imaging industry research report provides comprehensive data (region-wise segment analysis), with forecasts and estimates in "USD million" for the period 2026-2030, as well as historical data from 2020-2024 for the following segments.

  • Application
    • Military and surveillance
    • Healthcare
    • Food and agriculture
    • Remote sensing
    • Others
  • Product
    • Cameras
    • Accessories
  • Component
    • Hardware
    • Software
  • Geography
    • North America
      • US
      • Canada
      • Mexico
    • APAC
      • China
      • India
      • Japan
    • Europe
      • Germany
      • UK
      • France
    • South America
      • Brazil
      • Argentina
    • Middle East and Africa
      • Saudi Arabia
      • UAE
      • South Africa
    • Rest of World (ROW)

By Application Insights

The military and surveillance segment is estimated to witness significant growth during the forecast period.

The military and surveillance segment is driven by demand for advanced target distinction and reconnaissance. Defense agencies leverage spectral intelligence to differentiate objects and defeat camouflage detection, even in low-light imaging conditions.

The integration of compact remote sensing payloads onto platforms, including the uav-mounted hyperspectral sensor, enables persistent defense spectral surveillance and real-time spectral analysis of operational areas.

This capability to process a three-dimensional dataset provides a decisive advantage, improving threat identification accuracy by over 25% compared to traditional sensors.

The focus is on hyperspectral sensor integration for next-generation security and night vision systems, using advanced spectral analysis to ensure battlefield superiority and secure domestic supply chains for critical materials.

Request Free Sample

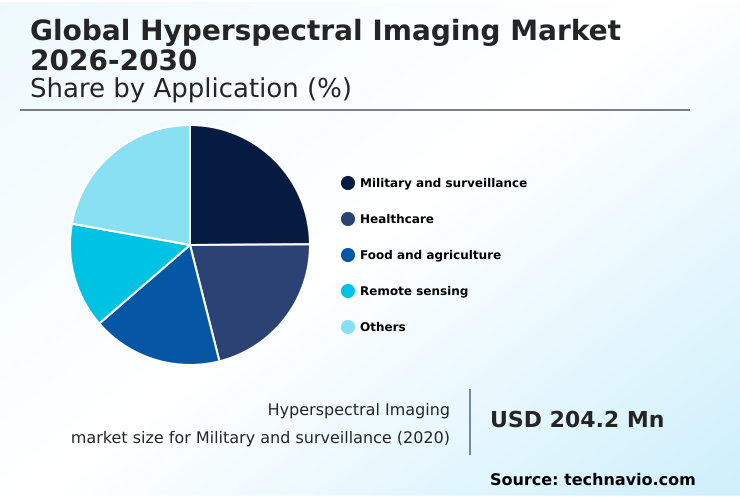
The Military and surveillance segment was valued at USD 296.5 million in 2024 and showed a gradual increase during the forecast period.

Request Free Sample

Regional Analysis

North America is estimated to contribute 34.6% to the growth of the global market during the forecast period.Technavio’s analysts have elaborately explained the regional trends and drivers that shape the market during the forecast period.

See How Hyperspectral Imaging Market Demand is Rising in North America Request Free Sample

North America is set to contribute over 34% of the market’s incremental growth, driven by investments in defense and precision agriculture. The region leverages satellite-based hyperspectral sensor technology for environmental monitoring and methane emissions monitoring.

Meanwhile, the APAC region is the fastest-growing market, fueled by government-led initiatives in China and India focused on agricultural spectral monitoring and resource management.

In South America, mining spectral exploration is a key application, with companies in Chile using mineral alteration mapping to guide extraction. Europe's focus is on industrial hyperspectral solutions, such as advanced industrial sorting in Germany's recycling sector.

The availability of commercial hyperspectral satellite imagery is democratizing access to geospatial analytics, with adoption improving crop health monitoring efficiency by 15%.

Market Dynamics

Our researchers analyzed the data with 2025 as the base year, along with the key drivers, trends, and challenges. A holistic analysis of drivers will help companies refine their marketing strategies to gain a competitive advantage.

  • The market's expansion is driven by a diverse range of high-value use cases. The practice of using hyperspectral imaging for precision agriculture is optimizing yields, while hyperspectral imaging in medical diagnostics is enabling breakthroughs like non-invasive disease detection. Specifically, spectral histology for tumor margin analysis is becoming a critical surgical tool.
  • In industry, the use of a swir hyperspectral camera for industrial sorting allows for hyperspectral imaging for plastic recycling, and snapshot hyperspectral imaging for machine vision enhances quality control. These advancements are powered by hyperspectral data processing and analysis software, enabling real-time hyperspectral material classification.
  • Concurrently, uav-based hyperspectral remote sensing applications are transforming fieldwork, with compact hyperspectral cameras for drones supporting everything from hyperspectral analysis for mineral exploration to hyperspectral remote sensing for water quality. Environmental monitoring with hyperspectral satellites is another key area, crucial for detecting methane leaks with hyperspectral imaging.
  • Moreover, defense applications of hyperspectral surveillance are evolving, with efforts focused on integrating hyperspectral imaging in night vision systems. These developments are underpinned by advancements in hyperspectral sensor technology and the emergence of ai-driven hyperspectral image reconstruction, which processes complex data more than twice as fast as previous methods, making the technology more practical across all sectors.

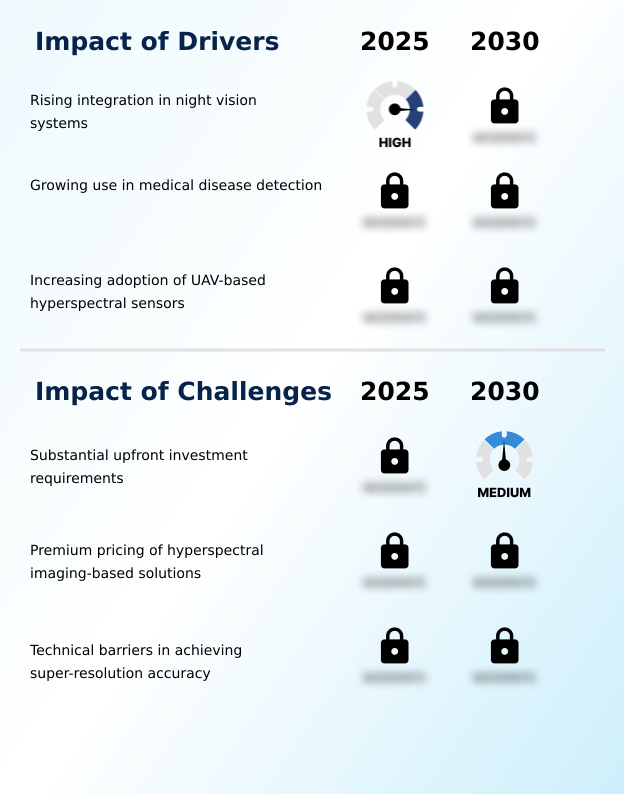
What are the key market drivers leading to the rise in the adoption of Hyperspectral Imaging Industry?

  • The rising integration of hyperspectral solutions in advanced night vision systems is a key driver for the market.

  • Market growth is driven by expanding applications in healthcare and remote sensing.
  • Medical hyperspectral imaging enables non-invasive tissue analysis and spectral histology, with surgeons using an intraoperative spectral tool to delineate tumor margins, reducing the need for repeat surgeries in 1 out of 8 cases.
  • This improves wound care assessment and diagnostic accuracy. Simultaneously, the adoption of the uav-mounted hyperspectral sensor is transforming airborne spectral mapping for environmental and agricultural use.
  • These platforms, often using a push-broom sensor, provide detailed chemical fingerprinting for applications from food quality inspection to gas detection.
  • In the food sector, such food safety spectral analysis has been shown to reduce contamination events by up to 30%, showcasing the technology’s broad industrial impact.

What are the market trends shaping the Hyperspectral Imaging Industry?

  • The rising deployment of advanced hyperspectral techniques within research and academic institutions is a significant upcoming market trend, accelerating multidisciplinary spectral analysis.

  • Key trends are expanding the scope of hyperspectral remote sensing, with academic and environmental sectors increasing investment. Researchers are leveraging high-resolution spectral dataset availability, which improves material classification accuracy by up to 20% over older methods. Environmental agencies utilize these systems for point-source emissions detection and monitoring water quality. Uav hyperspectral applications are expanding coverage for ecological assessments.
  • Meanwhile, meteorological research explores atmospheric moisture analysis to enhance hurricane forecasting, with some models showing an 18% improvement in intensity prediction. Advancements in hyperspectral data processing and snapshot spectral imaging are making advanced spectral analysis more accessible, while instruments like the ocean color instrument provide new insights into global climate systems, boosting demand for sophisticated hyperspectral data analytics.

What challenges does the Hyperspectral Imaging Industry face during its growth?

  • Substantial upfront investment requirements for hyperspectral imaging systems present a key challenge affecting industry growth and adoption.

  • High costs and technical barriers constrain broader market adoption. The premium pricing of hyperspectral camera systems, especially those using indium gallium arsenide for swir imaging, makes them inaccessible for some applications. A single short-wave infrared camera can cost up to three times more than a standard visible-near-infrared sensor.
  • Furthermore, managing the hyperspectral data cube requires substantial investment in computing and specialized hyperspectral software, increasing total ownership costs by 40% or more. While demand for compact hyperspectral sensors is growing for machine vision and material sorting, achieving super-resolution accuracy remains a challenge.
  • Integrating these systems into existing workflows for applications like forensic monitoring requires significant customization, slowing diffusion in budget-sensitive sectors that could benefit from the technology.

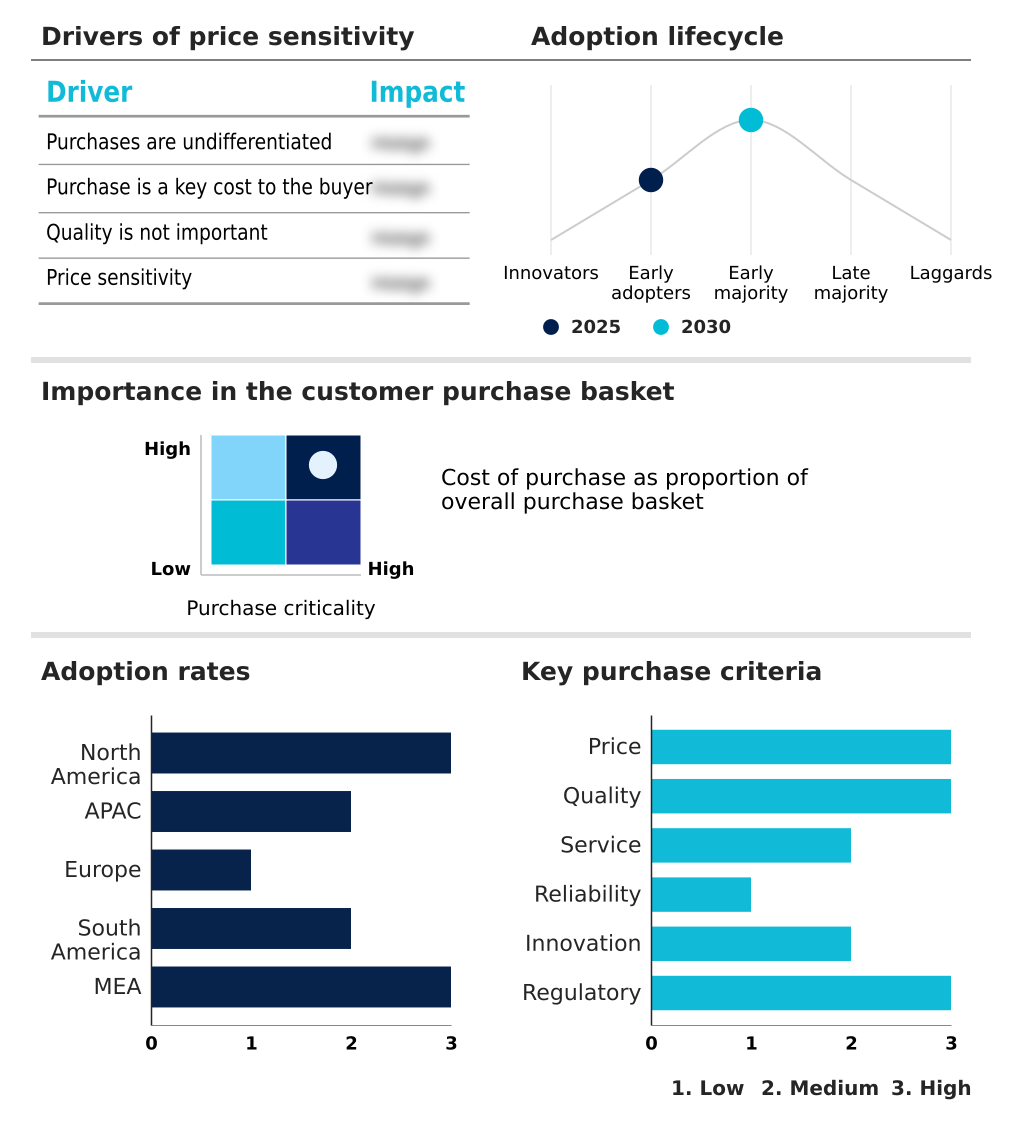
Exclusive Technavio Analysis on Customer Landscape

The hyperspectral imaging market forecasting report includes the adoption lifecycle of the market, covering from the innovator’s stage to the laggard’s stage. It focuses on adoption rates in different regions based on penetration. Furthermore, the hyperspectral imaging market report also includes key purchase criteria and drivers of price sensitivity to help companies evaluate and develop their market growth analysis strategies.

Customer Landscape of Hyperspectral Imaging Industry

Competitive Landscape

Companies are implementing various strategies, such as strategic alliances, hyperspectral imaging market forecast, partnerships, mergers and acquisitions, geographical expansion, and product/service launches, to enhance their presence in the industry.

Applied Spectral Imaging - Develops high-performance spectrometers and compact hyperspectral cameras covering multiple ranges for advanced laboratory, field, and industrial analysis.

The industry research and growth report includes detailed analyses of the competitive landscape of the market and information about key companies, including:

  • Applied Spectral Imaging
  • BaySpec Inc.
  • Brandywine Photonics
  • Corning Inc.
  • Cubert GmbH
  • Galileo Group Inc.
  • Headwall Photonics Inc.
  • HyperMed Imaging Inc.
  • HyVista Corp. Pty Ltd.
  • IMEC Inc.
  • inno-spec GmbH
  • Konica Minolta Inc.
  • Norsk Elektro Optikk AS
  • Polytec GmbH
  • Resonon Inc.
  • Surface Optics Corp.
  • Telops Inc.
  • XIMEA GmbH

Qualitative and quantitative analysis of companies has been conducted to help clients understand the wider business environment as well as the strengths and weaknesses of key industry players. Data is qualitatively analyzed to categorize companies as pure play, category-focused, industry-focused, and diversified; it is quantitatively analyzed to categorize companies as dominant, leading, strong, tentative, and weak.

Recent Development and News in Hyperspectral imaging market

  • In August 2024, Planet Labs deployed the Tanager-1 satellite, developed with the Carbon Mapper Coalition, to detect methane and carbon dioxide point-source emissions.
  • In September 2024, Hinalea Imaging released the Model 4300 VSWIR system, a development eliminating mechanical scanning for enhanced industrial material classification.
  • In October 2024, Headwall Photonics announced a strategic partnership with NV5, becoming a value-added provider of ENVI software to streamline workflows for defense and environmental applications.
  • In March 2025, SpaceX successfully deployed the SPHEREx observatory for NASA, a mission designed to survey the sky in near-infrared and optical light to support cosmology and remote sensing.

Dive into Technavio’s robust research methodology, blending expert interviews, extensive data synthesis, and validated models for unparalleled Hyperspectral Imaging Market insights. See full methodology.

Market Scope
Page number 289
Base year 2025
Historic period 2020-2024
Forecast period 2026-2030
Growth momentum & CAGR Accelerate at a CAGR of 13.3%
Market growth 2026-2030 USD 1100.8 million
Market structure Fragmented
YoY growth 2025-2026(%) 11.8%
Key countries US, Canada, Mexico, China, India, Japan, South Korea, Australia, Indonesia, Germany, UK, France, Italy, Spain, The Netherlands, Brazil, Argentina, Chile, Saudi Arabia, UAE, South Africa, Israel and Turkey
Competitive landscape Leading Companies, Market Positioning of Companies, Competitive Strategies, and Industry Risks

Request Free Sample

Research Analyst Overview

  • The market is evolving beyond niche scientific use, driven by hardware innovations and accessible analytics. Decision-making in boardrooms is now influenced by the potential of spectral intelligence, where investments in a spectral imaging platform can optimize industrial sorting or enable precision agriculture.
  • Advanced systems built with indium gallium arsenide for the short-wave infrared camera or a visible-near-infrared sensor generate a detailed hyperspectral data cube. This three-dimensional dataset allows for nuanced spectral signature analysis, crucial for material classification and enhancing spectral resolution.
  • From a satellite-based hyperspectral sensor performing airborne spectral mapping to a uav-mounted hyperspectral sensor with a compact remote sensing payload, the platforms are diversifying. Applications range from environmental monitoring and methane emissions monitoring to defense-related target distinction and camouflage detection. In healthcare, non-invasive tissue analysis through spectral histology and the use of an intraoperative spectral tool are transforming procedures.
  • Even specialized uses like low-light imaging, forensic monitoring, point-source emissions detection, and food quality inspection are becoming mainstream, supported by technologies like the push-broom sensor and snapshot spectral imaging. This high-resolution spectral dataset enables superior chemical fingerprinting, validated by instruments like the ocean color instrument, offering unmatched geospatial analytics capabilities.

What are the Key Data Covered in this Hyperspectral Imaging Market Research and Growth Report?

  • What is the expected growth of the Hyperspectral Imaging Market between 2026 and 2030?

    • USD 1.10 billion, at a CAGR of 13.3%

  • What segmentation does the market report cover?

    • The report is segmented by Application (Military and surveillance, Healthcare, Food and agriculture, Remote sensing, and Others), Product (Cameras, and Accessories), Component (Hardware, and Software) and Geography (North America, APAC, Europe, South America, Middle East and Africa)

  • Which regions are analyzed in the report?

    • North America, APAC, Europe, South America and Middle East and Africa

  • What are the key growth drivers and market challenges?

    • Rising integration in night vision systems, Substantial upfront investment requirements

  • Who are the major players in the Hyperspectral Imaging Market?

    • Applied Spectral Imaging, BaySpec Inc., Brandywine Photonics, Corning Inc., Cubert GmbH, Galileo Group Inc., Headwall Photonics Inc., HyperMed Imaging Inc., HyVista Corp. Pty Ltd., IMEC Inc., inno-spec GmbH, Konica Minolta Inc., Norsk Elektro Optikk AS, Polytec GmbH, Resonon Inc., Surface Optics Corp., Telops Inc. and XIMEA GmbH

Market Research Insights

  • Market dynamics are shifting as hyperspectral remote sensing becomes more commercially viable. The adoption of compact hyperspectral sensors in agricultural spectral monitoring has improved nutrient management, reducing fertilizer waste by over 15%. In healthcare, medical hyperspectral imaging is enhancing diagnostic precision, with studies showing a 20% increase in the accuracy of tumor margin detection.
  • Industrial hyperspectral solutions are delivering substantial ROI, particularly in recycling, where real-time spectral analysis boosts material recovery rates by up to 25%. Even in defense spectral surveillance, the technology provides a critical intelligence advantage.
  • The convergence of accessible hardware and powerful analytics is unlocking new efficiencies, though the high initial investment remains a key consideration for many potential adopters across industries.

We can help! Our analysts can customize this hyperspectral imaging market research report to meet your requirements.

Get in touch

1. Executive Summary

1.1 Market overview

Executive Summary - Chart on Market Overview
Executive Summary - Data Table on Market Overview
Executive Summary - Chart on Global Market Characteristics
Executive Summary - Chart on Market by Geography
Executive Summary - Chart on Market Segmentation by Application
Executive Summary - Chart on Market Segmentation by Product
Executive Summary - Chart on Market Segmentation by Component
Executive Summary - Chart on Incremental Growth
Executive Summary - Data Table on Incremental Growth
Executive Summary - Chart on Company Market Positioning

2. Technavio Analysis

2.1 Analysis of price sensitivity, lifecycle, customer purchase basket, adoption rates, and purchase criteria

2.2 Criticality of inputs and Factors of differentiation

Chart on Overview on criticality of inputs and factors of differentiation

2.3 Factors of disruption

Chart on Overview on factors of disruption

2.4 Impact of drivers and challenges

Chart on Impact of drivers and challenges in 2025 and 2030

3. Market Landscape

3.1 Market ecosystem

Chart on Parent Market
Data Table on - Parent Market

3.2 Market characteristics

Chart on Market characteristics analysis

3.3 Value chain analysis

Chart on Value chain analysis

4. Market Sizing

4.1 Market definition

Data Table on Offerings of companies included in the market definition

4.2 Market segment analysis

Market segments

4.3 Market size 2025

4.4 Market outlook: Forecast for 2025-2030

Chart on Global - Market size and forecast 2025-2030 ($ million)
Data Table on Global - Market size and forecast 2025-2030 ($ million)
Chart on Global Market: Year-over-year growth 2025-2030 (%)
Data Table on Global Market: Year-over-year growth 2025-2030 (%)

5. Historic Market Size

5.1 Global Hyperspectral Imaging Market 2020 - 2024

Historic Market Size - Data Table on Global Hyperspectral Imaging Market 2020 - 2024 ($ million)

5.2 Application segment analysis 2020 - 2024

Historic Market Size - Application Segment 2020 - 2024 ($ million)

5.3 Product segment analysis 2020 - 2024

Historic Market Size - Product Segment 2020 - 2024 ($ million)

5.4 Component segment analysis 2020 - 2024

Historic Market Size - Component Segment 2020 - 2024 ($ million)

5.5 Geography segment analysis 2020 - 2024

Historic Market Size - Geography Segment 2020 - 2024 ($ million)

5.6 Country segment analysis 2020 - 2024

Historic Market Size - Country Segment 2020 - 2024 ($ million)

6. Qualitative Analysis

6.1 The AI impact on Global Hyperspectral Imaging Market

7. Five Forces Analysis

7.1 Five forces summary

Five forces analysis - Comparison between 2025 and 2030

7.2 Bargaining power of buyers

Bargaining power of buyers - Impact of key factors 2025 and 2030

7.3 Bargaining power of suppliers

Bargaining power of suppliers - Impact of key factors in 2025 and 2030

7.4 Threat of new entrants

Threat of new entrants - Impact of key factors in 2025 and 2030

7.5 Threat of substitutes

Threat of substitutes - Impact of key factors in 2025 and 2030

7.6 Threat of rivalry

Threat of rivalry - Impact of key factors in 2025 and 2030

7.7 Market condition

Chart on Market condition - Five forces 2025 and 2030

8. Market Segmentation by Application

8.1 Market segments

Chart on Application - Market share 2025-2030 (%)
Data Table on Application - Market share 2025-2030 (%)

8.2 Comparison by Application

Chart on Comparison by Application
Data Table on Comparison by Application

8.3 Military and surveillance - Market size and forecast 2025-2030

Chart on Military and surveillance - Market size and forecast 2025-2030 ($ million)
Data Table on Military and surveillance - Market size and forecast 2025-2030 ($ million)
Chart on Military and surveillance - Year-over-year growth 2025-2030 (%)
Data Table on Military and surveillance - Year-over-year growth 2025-2030 (%)

8.4 Healthcare - Market size and forecast 2025-2030

Chart on Healthcare - Market size and forecast 2025-2030 ($ million)
Data Table on Healthcare - Market size and forecast 2025-2030 ($ million)
Chart on Healthcare - Year-over-year growth 2025-2030 (%)
Data Table on Healthcare - Year-over-year growth 2025-2030 (%)

8.5 Food and agriculture - Market size and forecast 2025-2030

Chart on Food and agriculture - Market size and forecast 2025-2030 ($ million)
Data Table on Food and agriculture - Market size and forecast 2025-2030 ($ million)
Chart on Food and agriculture - Year-over-year growth 2025-2030 (%)
Data Table on Food and agriculture - Year-over-year growth 2025-2030 (%)

8.6 Remote sensing - Market size and forecast 2025-2030

Chart on Remote sensing - Market size and forecast 2025-2030 ($ million)
Data Table on Remote sensing - Market size and forecast 2025-2030 ($ million)
Chart on Remote sensing - Year-over-year growth 2025-2030 (%)
Data Table on Remote sensing - Year-over-year growth 2025-2030 (%)

8.7 Others - Market size and forecast 2025-2030

Chart on Others - Market size and forecast 2025-2030 ($ million)
Data Table on Others - Market size and forecast 2025-2030 ($ million)
Chart on Others - Year-over-year growth 2025-2030 (%)
Data Table on Others - Year-over-year growth 2025-2030 (%)

8.8 Market opportunity by Application

Market opportunity by Application ($ million)
Data Table on Market opportunity by Application ($ million)

9. Market Segmentation by Product

9.1 Market segments

Chart on Product - Market share 2025-2030 (%)
Data Table on Product - Market share 2025-2030 (%)

9.2 Comparison by Product

Chart on Comparison by Product
Data Table on Comparison by Product

9.3 Cameras - Market size and forecast 2025-2030

Chart on Cameras - Market size and forecast 2025-2030 ($ million)
Data Table on Cameras - Market size and forecast 2025-2030 ($ million)
Chart on Cameras - Year-over-year growth 2025-2030 (%)
Data Table on Cameras - Year-over-year growth 2025-2030 (%)

9.4 Accessories - Market size and forecast 2025-2030

Chart on Accessories - Market size and forecast 2025-2030 ($ million)
Data Table on Accessories - Market size and forecast 2025-2030 ($ million)
Chart on Accessories - Year-over-year growth 2025-2030 (%)
Data Table on Accessories - Year-over-year growth 2025-2030 (%)

9.5 Market opportunity by Product

Market opportunity by Product ($ million)
Data Table on Market opportunity by Product ($ million)

10. Market Segmentation by Component

10.1 Market segments

Chart on Component - Market share 2025-2030 (%)
Data Table on Component - Market share 2025-2030 (%)

10.2 Comparison by Component

Chart on Comparison by Component
Data Table on Comparison by Component

10.3 Hardware - Market size and forecast 2025-2030

Chart on Hardware - Market size and forecast 2025-2030 ($ million)
Data Table on Hardware - Market size and forecast 2025-2030 ($ million)
Chart on Hardware - Year-over-year growth 2025-2030 (%)
Data Table on Hardware - Year-over-year growth 2025-2030 (%)

10.4 Software - Market size and forecast 2025-2030

Chart on Software - Market size and forecast 2025-2030 ($ million)
Data Table on Software - Market size and forecast 2025-2030 ($ million)
Chart on Software - Year-over-year growth 2025-2030 (%)
Data Table on Software - Year-over-year growth 2025-2030 (%)

10.5 Market opportunity by Component

Market opportunity by Component ($ million)
Data Table on Market opportunity by Component ($ million)

11. Customer Landscape

11.1 Customer landscape overview

Analysis of price sensitivity, lifecycle, customer purchase basket, adoption rates, and purchase criteria

12. Geographic Landscape

12.1 Geographic segmentation

Chart on Market share by geography 2025-2030 (%)
Data Table on Market share by geography 2025-2030 (%)

12.2 Geographic comparison

Chart on Geographic comparison
Data Table on Geographic comparison

12.3 North America - Market size and forecast 2025-2030

Chart on North America - Market size and forecast 2025-2030 ($ million)
Data Table on North America - Market size and forecast 2025-2030 ($ million)
Chart on North America - Year-over-year growth 2025-2030 (%)
Data Table on North America - Year-over-year growth 2025-2030 (%)
Chart on Regional Comparison - North America
Data Table on Regional Comparison - North America

12.3.1 US - Market size and forecast 2025-2030

Chart on US - Market size and forecast 2025-2030 ($ million)
Data Table on US - Market size and forecast 2025-2030 ($ million)
Chart on US - Year-over-year growth 2025-2030 (%)
Data Table on US - Year-over-year growth 2025-2030 (%)

12.3.2 Canada - Market size and forecast 2025-2030

Chart on Canada - Market size and forecast 2025-2030 ($ million)
Data Table on Canada - Market size and forecast 2025-2030 ($ million)
Chart on Canada - Year-over-year growth 2025-2030 (%)
Data Table on Canada - Year-over-year growth 2025-2030 (%)

12.3.3 Mexico - Market size and forecast 2025-2030

Chart on Mexico - Market size and forecast 2025-2030 ($ million)
Data Table on Mexico - Market size and forecast 2025-2030 ($ million)
Chart on Mexico - Year-over-year growth 2025-2030 (%)
Data Table on Mexico - Year-over-year growth 2025-2030 (%)

12.4 APAC - Market size and forecast 2025-2030

Chart on APAC - Market size and forecast 2025-2030 ($ million)
Data Table on APAC - Market size and forecast 2025-2030 ($ million)
Chart on APAC - Year-over-year growth 2025-2030 (%)
Data Table on APAC - Year-over-year growth 2025-2030 (%)
Chart on Regional Comparison - APAC
Data Table on Regional Comparison - APAC

12.4.1 China - Market size and forecast 2025-2030

Chart on China - Market size and forecast 2025-2030 ($ million)
Data Table on China - Market size and forecast 2025-2030 ($ million)
Chart on China - Year-over-year growth 2025-2030 (%)
Data Table on China - Year-over-year growth 2025-2030 (%)

12.4.2 India - Market size and forecast 2025-2030

Chart on India - Market size and forecast 2025-2030 ($ million)
Data Table on India - Market size and forecast 2025-2030 ($ million)
Chart on India - Year-over-year growth 2025-2030 (%)
Data Table on India - Year-over-year growth 2025-2030 (%)

12.4.3 Japan - Market size and forecast 2025-2030

Chart on Japan - Market size and forecast 2025-2030 ($ million)
Data Table on Japan - Market size and forecast 2025-2030 ($ million)
Chart on Japan - Year-over-year growth 2025-2030 (%)
Data Table on Japan - Year-over-year growth 2025-2030 (%)

12.4.4 South Korea - Market size and forecast 2025-2030

Chart on South Korea - Market size and forecast 2025-2030 ($ million)
Data Table on South Korea - Market size and forecast 2025-2030 ($ million)
Chart on South Korea - Year-over-year growth 2025-2030 (%)
Data Table on South Korea - Year-over-year growth 2025-2030 (%)

12.4.5 Australia - Market size and forecast 2025-2030

Chart on Australia - Market size and forecast 2025-2030 ($ million)
Data Table on Australia - Market size and forecast 2025-2030 ($ million)
Chart on Australia - Year-over-year growth 2025-2030 (%)
Data Table on Australia - Year-over-year growth 2025-2030 (%)

12.4.6 Indonesia - Market size and forecast 2025-2030

Chart on Indonesia - Market size and forecast 2025-2030 ($ million)
Data Table on Indonesia - Market size and forecast 2025-2030 ($ million)
Chart on Indonesia - Year-over-year growth 2025-2030 (%)
Data Table on Indonesia - Year-over-year growth 2025-2030 (%)

12.5 Europe - Market size and forecast 2025-2030

Chart on Europe - Market size and forecast 2025-2030 ($ million)
Data Table on Europe - Market size and forecast 2025-2030 ($ million)
Chart on Europe - Year-over-year growth 2025-2030 (%)
Data Table on Europe - Year-over-year growth 2025-2030 (%)
Chart on Regional Comparison - Europe
Data Table on Regional Comparison - Europe

12.5.1 Germany - Market size and forecast 2025-2030

Chart on Germany - Market size and forecast 2025-2030 ($ million)
Data Table on Germany - Market size and forecast 2025-2030 ($ million)
Chart on Germany - Year-over-year growth 2025-2030 (%)
Data Table on Germany - Year-over-year growth 2025-2030 (%)

12.5.2 UK - Market size and forecast 2025-2030

Chart on UK - Market size and forecast 2025-2030 ($ million)
Data Table on UK - Market size and forecast 2025-2030 ($ million)
Chart on UK - Year-over-year growth 2025-2030 (%)
Data Table on UK - Year-over-year growth 2025-2030 (%)

12.5.3 France - Market size and forecast 2025-2030

Chart on France - Market size and forecast 2025-2030 ($ million)
Data Table on France - Market size and forecast 2025-2030 ($ million)
Chart on France - Year-over-year growth 2025-2030 (%)
Data Table on France - Year-over-year growth 2025-2030 (%)

12.5.4 Italy - Market size and forecast 2025-2030

Chart on Italy - Market size and forecast 2025-2030 ($ million)
Data Table on Italy - Market size and forecast 2025-2030 ($ million)
Chart on Italy - Year-over-year growth 2025-2030 (%)
Data Table on Italy - Year-over-year growth 2025-2030 (%)

12.5.5 Spain - Market size and forecast 2025-2030

Chart on Spain - Market size and forecast 2025-2030 ($ million)
Data Table on Spain - Market size and forecast 2025-2030 ($ million)
Chart on Spain - Year-over-year growth 2025-2030 (%)
Data Table on Spain - Year-over-year growth 2025-2030 (%)

12.5.6 The Netherlands - Market size and forecast 2025-2030

Chart on The Netherlands - Market size and forecast 2025-2030 ($ million)
Data Table on The Netherlands - Market size and forecast 2025-2030 ($ million)
Chart on The Netherlands - Year-over-year growth 2025-2030 (%)
Data Table on The Netherlands - Year-over-year growth 2025-2030 (%)

12.6 South America - Market size and forecast 2025-2030

Chart on South America - Market size and forecast 2025-2030 ($ million)
Data Table on South America - Market size and forecast 2025-2030 ($ million)
Chart on South America - Year-over-year growth 2025-2030 (%)
Data Table on South America - Year-over-year growth 2025-2030 (%)
Chart on Regional Comparison - South America
Data Table on Regional Comparison - South America

12.6.1 Brazil - Market size and forecast 2025-2030

Chart on Brazil - Market size and forecast 2025-2030 ($ million)
Data Table on Brazil - Market size and forecast 2025-2030 ($ million)
Chart on Brazil - Year-over-year growth 2025-2030 (%)
Data Table on Brazil - Year-over-year growth 2025-2030 (%)

12.6.2 Argentina - Market size and forecast 2025-2030

Chart on Argentina - Market size and forecast 2025-2030 ($ million)
Data Table on Argentina - Market size and forecast 2025-2030 ($ million)
Chart on Argentina - Year-over-year growth 2025-2030 (%)
Data Table on Argentina - Year-over-year growth 2025-2030 (%)

12.6.3 Chile - Market size and forecast 2025-2030

Chart on Chile - Market size and forecast 2025-2030 ($ million)
Data Table on Chile - Market size and forecast 2025-2030 ($ million)
Chart on Chile - Year-over-year growth 2025-2030 (%)
Data Table on Chile - Year-over-year growth 2025-2030 (%)

12.7 Middle East and Africa - Market size and forecast 2025-2030

Chart on Middle East and Africa - Market size and forecast 2025-2030 ($ million)
Data Table on Middle East and Africa - Market size and forecast 2025-2030 ($ million)
Chart on Middle East and Africa - Year-over-year growth 2025-2030 (%)
Data Table on Middle East and Africa - Year-over-year growth 2025-2030 (%)
Chart on Regional Comparison - Middle East and Africa
Data Table on Regional Comparison - Middle East and Africa

12.7.1 Saudi Arabia - Market size and forecast 2025-2030

Chart on Saudi Arabia - Market size and forecast 2025-2030 ($ million)
Data Table on Saudi Arabia - Market size and forecast 2025-2030 ($ million)
Chart on Saudi Arabia - Year-over-year growth 2025-2030 (%)
Data Table on Saudi Arabia - Year-over-year growth 2025-2030 (%)

12.7.2 UAE - Market size and forecast 2025-2030

Chart on UAE - Market size and forecast 2025-2030 ($ million)
Data Table on UAE - Market size and forecast 2025-2030 ($ million)
Chart on UAE - Year-over-year growth 2025-2030 (%)
Data Table on UAE - Year-over-year growth 2025-2030 (%)

12.7.3 South Africa - Market size and forecast 2025-2030

Chart on South Africa - Market size and forecast 2025-2030 ($ million)
Data Table on South Africa - Market size and forecast 2025-2030 ($ million)
Chart on South Africa - Year-over-year growth 2025-2030 (%)
Data Table on South Africa - Year-over-year growth 2025-2030 (%)

12.7.4 Israel - Market size and forecast 2025-2030

Chart on Israel - Market size and forecast 2025-2030 ($ million)
Data Table on Israel - Market size and forecast 2025-2030 ($ million)
Chart on Israel - Year-over-year growth 2025-2030 (%)
Data Table on Israel - Year-over-year growth 2025-2030 (%)

12.7.5 Turkey - Market size and forecast 2025-2030

Chart on Turkey - Market size and forecast 2025-2030 ($ million)
Data Table on Turkey - Market size and forecast 2025-2030 ($ million)
Chart on Turkey - Year-over-year growth 2025-2030 (%)
Data Table on Turkey - Year-over-year growth 2025-2030 (%)

12.8 Market opportunity by geography

Market opportunity by geography ($ million)
Data Tables on Market opportunity by geography ($ million)

13. Drivers, Challenges, and Opportunity

13.1 Market drivers

Rising integration in night vision systems
Growing use in medical disease detection
Increasing adoption of UAV-based hyperspectral sensors

13.2 Market challenges

Substantial upfront investment requirements
Premium pricing of hyperspectral imaging-based solutions
Technical barriers in achieving super-resolution accuracy

13.3 Impact of drivers and challenges

Impact of drivers and challenges in 2025 and 2030

13.4 Market opportunities

Rising research deployment of hyperspectral techniques
Growing investment in environmental monitoring applications
Expanding use in hurricane wind forecasting

14. Competitive Landscape

14.1 Overview

14.2

Overview on criticality of inputs and factors of differentiation

14.3 Landscape disruption

Overview on factors of disruption

14.4 Industry risks

Impact of key risks on business

15. Competitive Analysis

15.1 Companies profiled

Companies covered

15.2 Company ranking index

15.3 Market positioning of companies

Matrix on companies position and classification

15.4 Applied Spectral Imaging

Applied Spectral Imaging - Overview
Applied Spectral Imaging - Product / Service
Applied Spectral Imaging - Key offerings
SWOT

15.5 BaySpec Inc.

BaySpec Inc. - Overview
BaySpec Inc. - Product / Service
BaySpec Inc. - Key offerings
SWOT

15.6 Brandywine Photonics

Brandywine Photonics - Overview
Brandywine Photonics - Product / Service
Brandywine Photonics - Key offerings
SWOT

15.7 Corning Inc.

Corning Inc. - Overview
Corning Inc. - Business segments
Corning Inc. - Key news
Corning Inc. - Key offerings
Corning Inc. - Segment focus
SWOT

15.8 Cubert GmbH

Cubert GmbH - Overview
Cubert GmbH - Product / Service
Cubert GmbH - Key offerings
SWOT

15.9 Galileo Group Inc.

Galileo Group Inc. - Overview
Galileo Group Inc. - Product / Service
Galileo Group Inc. - Key offerings
SWOT

15.10 Headwall Photonics Inc.

Headwall Photonics Inc. - Overview
Headwall Photonics Inc. - Product / Service
Headwall Photonics Inc. - Key offerings
SWOT

15.11 IMEC Inc.

IMEC Inc. - Overview
IMEC Inc. - Product / Service
IMEC Inc. - Key offerings
SWOT

15.12 Konica Minolta Inc.

Konica Minolta Inc. - Overview
Konica Minolta Inc. - Business segments
Konica Minolta Inc. - Key news
Konica Minolta Inc. - Key offerings
Konica Minolta Inc. - Segment focus
SWOT

15.13 Norsk Elektro Optikk AS

Norsk Elektro Optikk AS - Overview
Norsk Elektro Optikk AS - Product / Service
Norsk Elektro Optikk AS - Key offerings
SWOT

15.14 Polytec GmbH

Polytec GmbH - Overview
Polytec GmbH - Product / Service
Polytec GmbH - Key offerings
SWOT

15.15 Resonon Inc.

Resonon Inc. - Overview
Resonon Inc. - Product / Service
Resonon Inc. - Key offerings
SWOT

15.16 Surface Optics Corp.

Surface Optics Corp. - Overview
Surface Optics Corp. - Product / Service
Surface Optics Corp. - Key offerings
SWOT

15.17 Telops Inc.

Telops Inc. - Overview
Telops Inc. - Product / Service
Telops Inc. - Key offerings
SWOT

15.18 XIMEA GmbH

XIMEA GmbH - Overview
XIMEA GmbH - Product / Service
XIMEA GmbH - Key offerings
SWOT

16. Appendix

16.1 Scope of the report

Market definition
Objectives
Notes and caveats

16.2 Inclusions and exclusions checklist

Inclusions checklist
Exclusions checklist

16.3 Currency conversion rates for US$

16.4 Research methodology

16.5 Data procurement

Information sources

16.6 Data validation

16.7 Validation techniques employed for market sizing

16.8 Data synthesis

16.9 360 degree market analysis

16.10 List of abbreviations

Research Methodology

Technavio presents a detailed picture of the market by way of study, synthesis, and summation of data from multiple sources. The analysts have presented the various facets of the market with a particular focus on identifying the key industry influencers. The data thus presented is comprehensive, reliable, and the result of extensive research, both primary and secondary.

INFORMATION SOURCES

Primary sources

  • Manufacturers and suppliers
  • Channel partners
  • Industry experts
  • Strategic decision makers

Secondary sources

  • Industry journals and periodicals
  • Government data
  • Financial reports of key industry players
  • Historical data
  • Press releases

DATA ANALYSIS

Data Synthesis

  • Collation of data
  • Estimation of key figures
  • Analysis of derived insights

Data Validation

  • Triangulation with data models
  • Reference against proprietary databases
  • Corroboration with industry experts

REPORT WRITING

Qualitative

  • Market drivers
  • Market challenges
  • Market trends
  • Five forces analysis

Quantitative

  • Market size and forecast
  • Market segmentation
  • Geographical insights
  • Competitive landscape

Interested in this report?

Get your sample now to see our research methodology and insights!

Download Now

Frequently Asked Questions

Hyperspectral Imaging market growth will increase by USD 1100.8 million during 2026-2030 .

The Hyperspectral Imaging market is expected to grow at a CAGR of 13.3% during 2026-2030 .

Hyperspectral Imaging market is segmented by Application (Military and surveillance, Healthcare, Food and agriculture, Remote sensing, Others) Product (Cameras, Accessories) Component (Hardware, Software)

Applied Spectral Imaging, BaySpec Inc., Brandywine Photonics, Corning Inc., Cubert GmbH, Galileo Group Inc., Headwall Photonics Inc., HyperMed Imaging Inc., HyVista Corp. Pty Ltd., IMEC Inc., inno-spec GmbH, Konica Minolta Inc., Norsk Elektro Optikk AS, Polytec GmbH, Resonon Inc., Surface Optics Corp., Telops Inc., XIMEA GmbH are a few of the key vendors in the Hyperspectral Imaging market.

North America will register the highest growth rate of 34.6% among the other regions. Therefore, the Hyperspectral Imaging market in North America is expected to garner significant business opportunities for the vendors during the forecast period.

US, Canada, Mexico, China, India, Japan, South Korea, Australia, Indonesia, Germany, UK, France, Italy, Spain, The Netherlands, Brazil, Argentina, Chile, Saudi Arabia, UAE, South Africa, Israel, Turkey

  • Rising integration in night vision systems is the driving factor this market.

The Hyperspectral Imaging market vendors should focus on grabbing business opportunities from the Application segment as it accounted for the largest market share in the base year.