Image Guided Therapy System Market Analysis North America, Europe, Asia, Rest of World (ROW) - US, Germany, UK, China, Canada - Size and Forecast 2024-2028

Image Guided Therapy System Market Analysis North America, Europe, Asia, Rest of World (ROW) - US, Germany, UK, China, Canada - Size and Forecast 2024-2028

Published: Aug 2024 190 Pages SKU: IRTNTR72457

Market Overview at a Glance

$1.89 B
Market Opportunity
6.78%
CAGR
6.23
YoY growth 2023-2024(%)

Image Guided Therapy System Market Size 2024-2028 

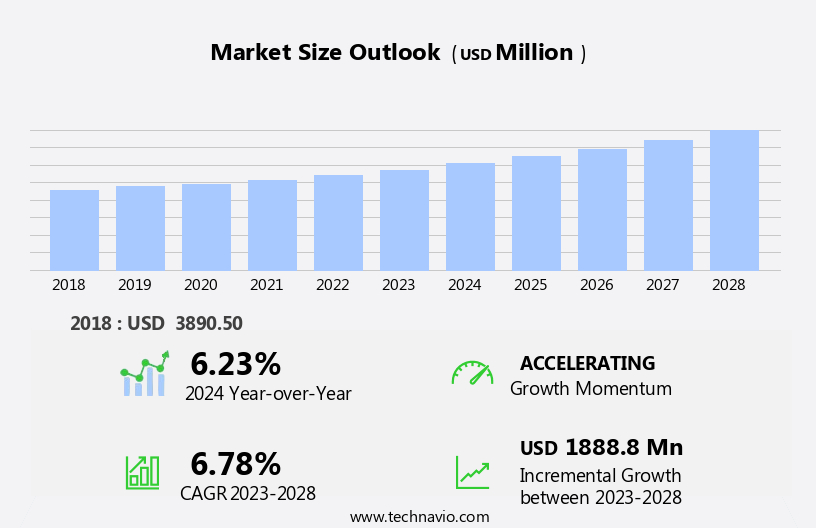
The image guided therapy system market size is forecast to increase by USD 1.89 billion at a CAGR of 6.78% between 2023 and 2028.

  • The high prevalence of cancer is the key driver of the image-guided therapy system market. Abbott Laboratories is a key player, offering intravascular imaging modalities used during percutaneous coronary intervention (PCI). These systems provide automated and accurate measurements, addressing the clinical needs of patients. Abbott's technology enhances the precision of medical procedures, supporting the growing demand for image-guided therapy systems in oncology and cardiovascular care.
  • Image Guided Therapy Systems (IGTS) market is witnessing significant growth due to the high prevalence of cancer and the integration of artificial intelligence (AI). The integration of AI in IGTS enhances the accuracy and efficiency of treatment delivery, leading to improved patient outcomes. However, the lack of adequate healthcare infrastructure in developing nations poses a challenge to market growth. Technological advancements in imaging systems, such as ultrasound, fluoroscopy, magnetic resonance imaging (MRI), and computed tomography (CT), are driving innovation in this field.

What will be the Size of the Image Guided Therapy System Market During the Forecast Period?

Image Guided Therapy System Market Size

 Request Free Sample

  • The image-guided therapy system market is experiencing significant growth due to the increasing prevalence of chronic diseases, particularly cancer, and the subsequent rise in demand for minimally invasive surgeries. Image-guided therapy systems enable real-time visualization during procedures, leading to improved accuracy and reduced risk of complications. Cancer radiotherapy, neurosurgery, and stroke care are major applications of image-guided therapy systems. The non-urgent surgical procedures segment is also expected to grow due to the advantages of minimally invasive approaches.
  • However, concerns regarding infections and the aging population pose challenges to market growth. Companies like Royal Philips and Siemens Healthineers are investing in advanced technologies, such as the Azurion imaging system and the Echonavigator 4, to address these challenges and meet the evolving needs of healthcare providers. The American Cancer Society estimates that there will be over 1.9 million new cancer cases diagnosed In the US in 2022. The increasing burden of cancer and other chronic diseases is expected to fuel the demand for image-guided therapy systems In the coming years.

How is this Image Guided Therapy System Industry segmented and which is the largest segment?

The image guided therapy system industry research report provides comprehensive data (region-wise segment analysis), with forecasts and estimates in "USD billion" for the period 2024-2028, as well as historical data from 2018-2022 for the following segments. 

  • End-user
    • Hospitals and clinics
    • Ambulatory surgical centers
    • Research and academic institutions
  • Product
    • Endoscopes
    • Magnetic resonance imaging (MRI)
    • Ultrasound systems
    • Computed tomography (CT) scanners
    • Others
  • Type
    • Cardiac Surgery
    • Neurosurgery
    • Orthopedic Surgery
    • Urology
    • Gastroenterology
    • Oncology Surgery
    • Others
  • Geography
    • North America
      • Canada
      • US
    • Europe
      • Germany
      • UK
    • Asia
      • China
    • Rest of World (ROW)

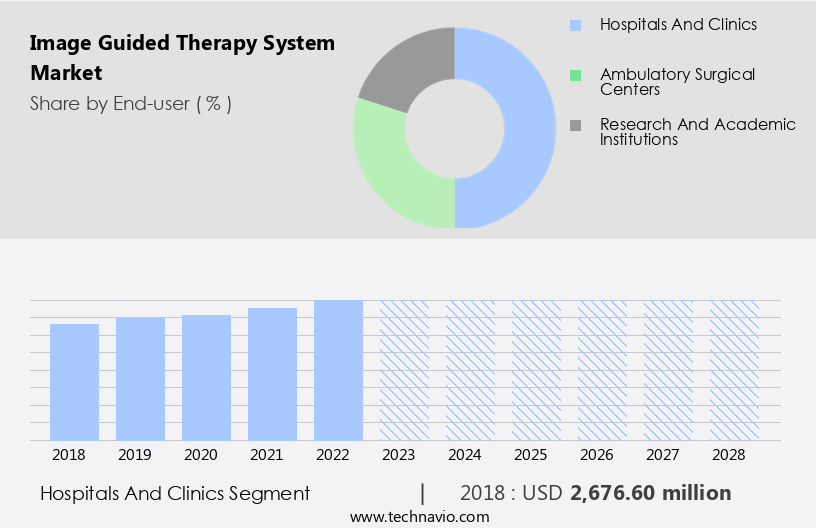
By End-user Insights

The hospitals and clinics segment is estimated to witness significant growth during the forecast period. Image-guided therapy systems are increasingly being adopted in healthcare facilities, including high-end hospitals and specialized clinics, due to their role in minimally invasive surgeries and advanced diagnostic capabilities. Technological advancements in imaging systems, such as Magnetic Resonance Imaging (MRI), Fluoroscopy, and Ultrasound, have enabled precise interventions for chronic diseases, including cancer, neurological disorders, and cardiovascular diseases (CVDs). Minimally invasive therapies, such as MR-guided focused ultrasound and non-invasive neurosurgery, are gaining popularity for their effectiveness in treating various conditions, including stroke care, gastrointestinal diseases, and inflammatory bowel disease.

Key players In the market include Philips, Medtronic, and Apollo Endosurgery. Strategic acquisitions and innovation continue to shape the industry, with companies like Johns Hopkins Medicine and Geriatric population exploring new opportunities in image-guided therapy platforms. The American Cancer Society and the Royal Philips have collaborated to advance cancer radiotherapy using image-guided systems. The market is expected to grow significantly due to the increasing prevalence of chronic conditions, such as high cholesterol, hypertension, cognitive heart diseases, and trauma cases.

Image Guided Therapy System Market Size

Get a glance at the share of various segments. Request Free Sample

The hospitals and clinics segment was valued at USD 2.68 billion in 2018 and showed a gradual increase during the forecast period.

Regional Analysis

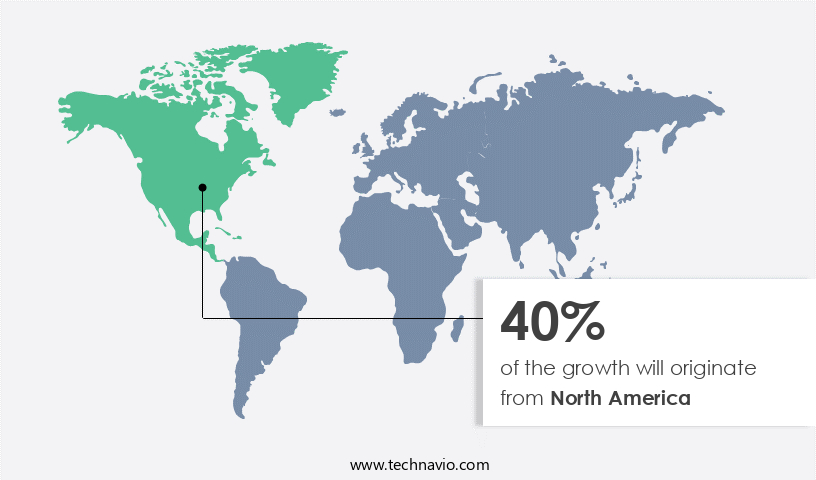
North America is estimated to contribute 40% to the growth of the global market during the forecast period. Technavio's analysts have elaborately explained the regional trends and drivers that shape the market during the forecast period.

Image Guided Therapy System Market Share by Geography

For more insights on the market share of various regions, Request Free Sample

The market in North America experienced significant growth in 2023, with the US leading the regional market expansion. Factors contributing to this growth include increased insurance coverage, rising research and development expenditure, a growing geriatric population with chronic diseases, and high healthcare spending. Chronic diseases, which affect six in ten adults In the US according to the Centers for Disease Control and Prevention (CDC), are a leading cause of death and disability. Advanced medical equipment adoption and the presence of major market players further boost market growth. Technological advancements in imaging systems, such as Magnetic Resonance Imaging (MRI), Fluoroscopy, and Ultrasound, have facilitated minimally invasive therapies for various conditions, including cancer, cardiovascular diseases (CVDs), neurological disorders, and gastrointestinal diseases.

Minimally invasive surgeries and therapies, such as MR-guided focused ultrasound, non-invasive neurosurgery, and corticosteroid injections, have gained popularity due to their reduced risk of infections and faster recovery times. Healthcare infrastructure improvements, strategic acquisitions, and innovation have also played a crucial role in market growth. In trauma care, specialty clinics, cardiac surgery, neurosurgery, and urology segments, image-guided therapy systems have proven beneficial in managing accidents, stroke care, and chronic conditions, such as high cholesterol, hypertension, cognitive heart diseases, and inflammatory bowel disease. Companies like Philips, Apollo Endosurgery, Medtronic, and Royal Philips are investing In the development of advanced image-guided therapy platforms to cater to evolving healthcare needs.

Market Dynamics

Our image guided therapy system market researchers analyzed the data with 2023 as the base year, along with the key drivers, trends, and challenges. A holistic analysis of drivers will help companies refine their marketing strategies to gain a competitive advantage.

What are the key market drivers leading to the rise In the adoption of Image Guided Therapy System Industry?

The high prevalence of cancer is the key driver of the market.

  • Image-guided therapy systems have gained significant traction In the healthcare industry due to the increasing prevalence of chronic diseases, such as cancer, and the need for minimally invasive therapies. Technological advancements in imaging systems, including Magnetic Resonance Imaging (MRI), Fluoroscopy, and Ultrasound, have enabled precise and accurate diagnosis and treatment of various conditions, including cancer radiotherapy, neurological disorders, gastrointestinal diseases, and cardiovascular diseases (CVDs). The endoscopes segment, which includes endoscopic systems used in gastroenterology, has witnessed substantial growth due to the increasing prevalence of inflammatory bowel disease and colorectal cancer. Companies such as Apollo Endosurgery and Medtronic have introduced innovative endoscopic approaches to minimize invasiveness and improve patient outcomes.
  • Moreover, the cardiac surgery segment has also seen significant growth due to the increasing number of cardiovascular diseases (CVDs) and trauma cases. Philips Azurion, an image-guided therapy platform, is widely used in cardiac surgery to provide real-time imaging and guidance during procedures. Moreover, the geriatric population, who are more susceptible to chronic conditions and infections, has fueled the demand for image-guided therapy systems in specialty clinics, neurosurgery, and stroke care. The American Cancer Society estimates that there will be over 1.9 million new cancer cases In the US in 2022. Innovation and strategic acquisitions continue to drive growth In the image-guided therapy market.
  • For instance, Royal Philips acquired Volcano Corporation to expand its interventional ultrasound business. MR-guided focused ultrasound and non-invasive neurosurgery are emerging areas of interest, with companies investing in research and development to bring new products to market. In summary, image-guided therapy systems have become an essential tool In the healthcare industry, enabling minimally invasive therapies for various chronic conditions, including cancer, neurological disorders, and cardiovascular diseases. The increasing prevalence of these conditions, coupled with technological advancements and innovation, is driving the growth of the image-guided therapy market.

What are the market trends shaping the Image Guided Therapy System Industry?

Integration of artificial intelligence (AI) with image-guided therapy systems is the upcoming market trend.

  • The integration of artificial intelligence (AI) into image-guided therapy systems is revolutionizing healthcare by enabling automation, standardization, and improved patient outcomes in minimally invasive surgeries for chronic diseases such as cancer, cognitive heart diseases, hypertension, and high cholesterol. These systems utilize imaging technologies like X-rays, CT scans, Magnetic Resonance Imaging (MRI), and Fluoroscopy to generate vast amounts of data. The analysis and interpretation of this data can be complex, even for experienced clinical professionals. AI integration addresses this challenge by increasing productivity, improving accuracy, and reducing errors in diagnoses.
  • This technological advancement is particularly beneficial for specialized fields like radiation oncology, neurology, trauma care, and specialty clinics. Key applications include cancer radiotherapy, neurosurgery, cardiac surgery, gastrointestinal diseases, and urology. Notable companies contributing to this market include Philips, Medtronic, and Apollo Endosurgery. The market is further fuelled by innovation, such as MR-guided focused ultrasound for non-invasive neurosurgery and corticosteroid injections for inflammatory bowel disease. The geriatric population, with its increased susceptibility to chronic conditions and higher demand for minimally invasive therapies, is a significant market driver.
  • Thus, the American Cancer Society reports an estimated 1.9 million new cancer cases and 608,570 cancer deaths In the US in 2022. As the population ages and the prevalence of chronic diseases increases, the demand for image guided therapy systems with AI integration is expected to grow.

What challenges does the Image Guided Therapy System Industry face during its growth?

Lack of adequate healthcare infrastructure in developing nations is a key challenge affecting the industry growth.

  • Image Guided Therapy Systems Market: Technological Advancements Fuel Growth in Minimally Invasive Surgeries and Cancer Treatments Image guided therapy systems have gained significant traction In the healthcare industry due to their precision and effectiveness in minimally invasive surgeries and cancer treatments. These systems, which include imaging systems such as Magnetic Resonance Imaging (MRI), Fluoroscopy, and Ultrasound, enable real-time visualization of the treatment area, leading to improved accuracy and reduced risk of complications. Technological advancements in image guided therapy systems have led to the development of innovative solutions for various chronic conditions, including cancer radiotherapy, neurological disorders, gastrointestinal diseases, and cardiovascular diseases (CVDs).
  • For instance, MR-guided focused ultrasound is a non-invasive neurosurgical procedure that utilizes real-time MRI imaging to target and destroy tumors with high precision. Moreover, minimally invasive therapies, such as corticosteroid injections and endoscopic procedures, have gained popularity due to their reduced recovery time and lower risk of infections. The endoscopes segment, which includes endoscopy systems used in gastroenterology, has witnessed significant growth due to the increasing prevalence of gastrointestinal diseases, such as inflammatory bowel disease and colorectal cancer. The geriatric population, which is at a higher risk of chronic conditions and CVDs, is a significant consumer of image guided therapy systems. According to the American Cancer Society, approximately 60% of all cancer diagnoses and 70% of all cancer deaths occur in individuals aged 65 and older. Furthermore, the increasing prevalence of neurological disorders, such as stroke, In the elderly population is driving the demand for image guided therapy systems in neurosurgery. Despite the numerous benefits of image guided therapy systems, their adoption is limited in underdeveloped and developing countries due to the lack of adequate healthcare infrastructure and limited healthcare expenditure. For instance, in India, rural patients face challenges in accessing specialized healthcare services due to a shortage of healthcare providers and local support services.
  • Strategic acquisitions and innovation are key drivers of growth In the image guided therapy systems market. For example, Philips' acquisition of Azurion, an image-guided therapy platform, has enabled the company to expand its product portfolio and enhance its position In the market. Similarly, Medtronic's acquisition of GI Genius, an artificial intelligence-based system for detecting and characterizing colorectal polyps during endoscopy, has strengthened its presence In the gastroenterology segment. In summary, image guided therapy systems are transforming the healthcare industry by enabling precise and minimally invasive treatments for various chronic conditions, including cancer, cardiovascular diseases, and neurological disorders. Despite the numerous benefits, their adoption is limited in underdeveloped and developing countries due to the lack of adequate healthcare infrastructure and limited healthcare expenditure. Strategic acquisitions and innovation are key drivers of growth In the image guided therapy systems market, with companies such as Philips and Medtronic leading the way.

Exclusive Customer Landscape

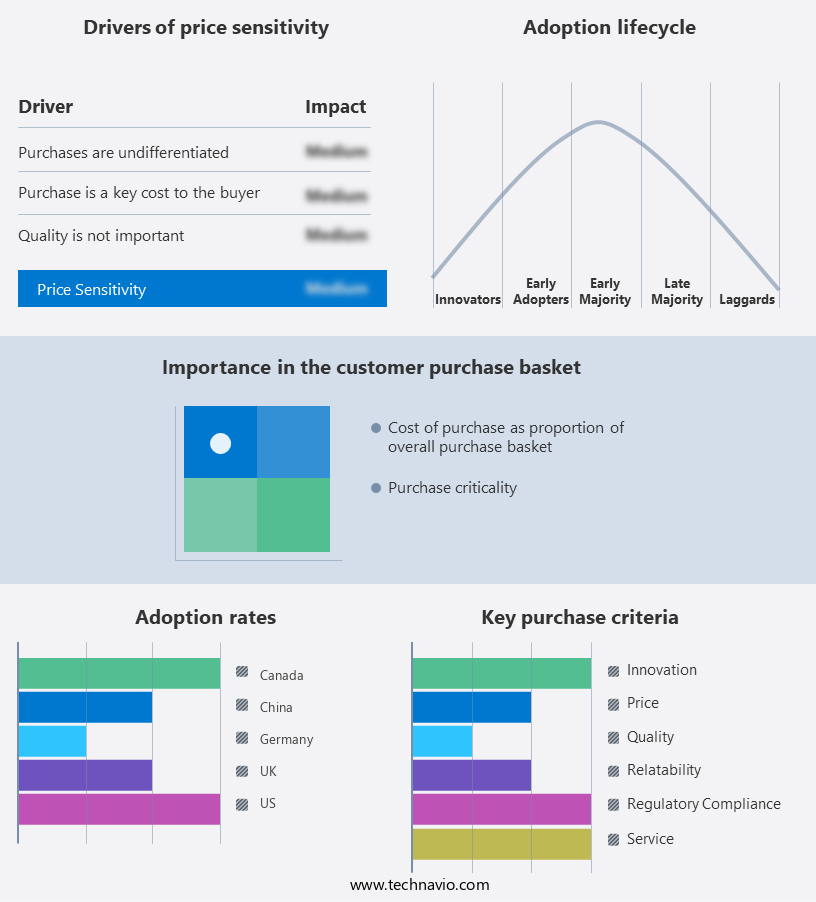
The image guided therapy system market forecasting report includes the adoption lifecycle of the market, covering from the innovator's stage to the laggard's stage. It focuses on adoption rates in different regions based on penetration. Furthermore, the image guided therapy system market report also includes key purchase criteria and drivers of price sensitivity to help companies evaluate and develop their market growth analysis strategies.

Image Guided Therapy System Market Share by Geography

 Customer Landscape

Key Companies & Market Insights

Companies are implementing various strategies, such as strategic alliances, image guided therapy system market forecast, partnerships, mergers and acquisitions, geographical expansion, and product/service launches, to enhance their presence In the industry. The industry research and growth report includes detailed analyses of the competitive landscape of the market and information about key companies, including:

  • Abbott Laboratories
  • Accuray Inc.
  • Analogic Corp.
  • Brainlab AG
  • C RAD AB
  • Canon Inc.
  • Elekta AB
  • General Electric Co.
  • Hitachi Ltd.
  • Ion Beam Applications SA
  • IsoRay Inc.
  • KARL STORZ SE and Co. KG
  • Koninklijke Philips N.V.
  • Medtronic Plc
  • Mevion Medical Systems Inc.
  • Olympus Corp.
  • Shimadzu Corp.
  • Siemens AG
  • Stryker Corp.
  • Varian Medical Systems Inc.

Qualitative and quantitative analysis of companies has been conducted to help clients understand the wider business environment as well as the strengths and weaknesses of key industry players. Data is qualitatively analyzed to categorize companies as pure play, category-focused, industry-focused, and diversified; it is quantitatively analyzed to categorize companies as dominant, leading, strong, tentative, and weak.

Research Analyst Overview

Image-guided therapy systems have gained significant traction In the healthcare industry due to the increasing prevalence of chronic diseases, such as cancer and cardiovascular diseases (CVDs), and the need for minimally invasive therapies. These systems enable healthcare professionals to visualize and navigate complex anatomical structures during surgical procedures, leading to improved accuracy, reduced complications, and enhanced patient outcomes. Technological advancements in imaging systems have been instrumental in driving the growth of the image-guided therapy market. Magnetic resonance imaging (MRI), radiation oncology, and fluoroscopy are some of the imaging modalities that are commonly used in image-guided therapy. Neurology, trauma care, and specialty clinics are among the segments that have witnessed substantial growth In the adoption of image-guided therapy systems. Chronic conditions, including cognitive heart diseases, high cholesterol, hypertension, and infections, have been identified as major drivers of the market. For instance, in cancer radiotherapy, image-guided systems help in delivering precise doses of radiation to the tumor site while minimizing exposure to healthy tissues. In neurosurgery, these systems enable surgeons to visualize the brain in real-time, facilitating non-invasive procedures and reducing the risk of complications.

Moreover, the geriatric population is another significant market driver, as this demographic is more susceptible to chronic conditions and requires more frequent medical interventions. The American Cancer Society estimates that there will be approximately 1.9 million new cancer cases diagnosed In the United States in 2022. Image-guided therapy systems play a crucial role In the diagnosis and treatment of these conditions, making them an essential component of healthcare infrastructure. Strategic acquisitions and innovation have been key growth strategies for market players. For instance, Royal Philips' acquisition of Volcano Corporation in 2015 expanded its portfolio of image-guided therapy solutions. Philips' image-guided therapy platform, Azurion, offers advanced imaging capabilities and seamless integration with various endoscopic systems, making it a popular choice among healthcare providers. MR-guided focused ultrasound is an emerging technology that is gaining popularity in image-guided therapy. This non-invasive neurosurgical procedure uses MRI to guide high-intensity focused ultrasound waves to targeted areas In the brain, making it an effective alternative to traditional open brain surgery. Inflammatory bowel disease and colorectal cancer are among the gastrointestinal diseases that are increasingly being treated with image-guided endoscopic approaches. Gastroenterologists use imaging systems, such as ultrasound, to visualize the digestive tract and identify abnormalities. Companies like Medtronic and Apollo Endosurgery offer advanced endoscopic systems, such as the Gi Genius and OverStitch Endoscopic Suturing System, respectively, to enhance the diagnostic and therapeutic capabilities of endoscopic procedures.

In summary, image-guided therapy systems have become an indispensable tool in modern healthcare, enabling accurate and minimally invasive interventions for various chronic conditions, including cancer, cardiovascular diseases, neurological disorders, and gastrointestinal diseases. The market is driven by technological advancements, the increasing prevalence of chronic conditions, and strategic acquisitions and innovations by key players.

Image Guided Therapy System Market Scope

Report Coverage

Details

Page number

190

Base year

2023

Historic period

2018-2022

Forecast period

2024-2028

Growth momentum & CAGR

Accelerate at a CAGR of 6.78%

Market growth 2024-2028

USD 1.89 billion

Market structure

Fragmented

YoY growth 2023-2024(%)

6.23

Key countries

US, Germany, UK, China, and Canada

Competitive landscape

Leading Companies, Market Positioning of Companies, Competitive Strategies, and Industry Risks

Request Free Sample

What are the Key Data Covered in this Image Guided Therapy System Market Research and Growth Report?

  • CAGR of the Image Guided Therapy System industry during the forecast period
  • Detailed information on factors that will drive the Image Guided Therapy System growth and forecasting between 2024 and 2028
  • Precise estimation of the size of the market and its contribution of the industry in focus to the parent market
  • Accurate predictions about upcoming growth and trends and changes in consumer behaviour
  • Growth of the market across North America, Europe, Asia, and Rest of World (ROW)
  • Thorough analysis of the market's competitive landscape and detailed information about companies
  • Comprehensive analysis of factors that will challenge the image guided therapy system market growth of industry companies

We can help! Our analysts can customize this image guided therapy system market research report to meet your requirements.

Get in touch

1 Executive Summary

  • 1.1 Market overview
    • Executive Summary - Chart on Market Overview
    • Executive Summary - Data Table on Market Overview
    • Executive Summary - Chart on Global Market Characteristics
    • Executive Summary - Chart on Market by Geography
    • Executive Summary - Chart on Market Segmentation by End-user
    • Executive Summary - Chart on Market Segmentation by Product
    • Executive Summary - Chart on Incremental Growth
    • Executive Summary - Data Table on Incremental Growth
    • Executive Summary - Chart on Company Market Positioning

2 Market Landscape

  • 2.1 Market ecosystem
    • Parent Market
    • Data Table on - Parent Market
  • 2.2 Market characteristics
    • Market characteristics analysis
  • 2.3 Value chain analysis
    • Value Chain Analysis

3 Market Sizing

  • 3.1 Market definition
    • Offerings of companies included in the market definition
  • 3.2 Market segment analysis
    • Market segments
  • 3.3 Market size 2023
    • 3.4 Market outlook: Forecast for 2023-2028
      • Chart on Global - Market size and forecast 2023-2028 ($ million)
      • Data Table on Global - Market size and forecast 2023-2028 ($ million)
      • Chart on Global Market: Year-over-year growth 2023-2028 (%)
      • Data Table on Global Market: Year-over-year growth 2023-2028 (%)

    4 Historic Market Size

    • 4.1 Global Image Guided Therapy System Market 2018 - 2022
      • Historic Market Size - Data Table on Global Image Guided Therapy System Market 2018 - 2022 ($ million)
    • 4.2 End-user segment analysis 2018 - 2022
      • Historic Market Size - End-user Segment 2018 - 2022 ($ million)
    • 4.3 Product segment analysis 2018 - 2022
      • Historic Market Size - Product Segment 2018 - 2022 ($ million)
    • 4.4 Geography segment analysis 2018 - 2022
      • Historic Market Size - Geography Segment 2018 - 2022 ($ million)
    • 4.5 Country segment analysis 2018 - 2022
      • Historic Market Size - Country Segment 2018 - 2022 ($ million)

    5 Five Forces Analysis

    • 5.1 Five forces summary
      • Five forces analysis - Comparison between 2023 and 2028
    • 5.2 Bargaining power of buyers
      • Bargaining power of buyers - Impact of key factors 2023 and 2028
    • 5.3 Bargaining power of suppliers
      • Bargaining power of suppliers - Impact of key factors in 2023 and 2028
    • 5.4 Threat of new entrants
      • Threat of new entrants - Impact of key factors in 2023 and 2028
    • 5.5 Threat of substitutes
      • Threat of substitutes - Impact of key factors in 2023 and 2028
    • 5.6 Threat of rivalry
      • Threat of rivalry - Impact of key factors in 2023 and 2028
    • 5.7 Market condition
      • Chart on Market condition - Five forces 2023 and 2028

    6 Market Segmentation by End-user

    • 6.1 Market segments
      • Chart on End-user - Market share 2023-2028 (%)
      • Data Table on End-user - Market share 2023-2028 (%)
    • 6.2 Comparison by End-user
      • Chart on Comparison by End-user
      • Data Table on Comparison by End-user
    • 6.3 Hospitals and clinics - Market size and forecast 2023-2028
      • Chart on Hospitals and clinics - Market size and forecast 2023-2028 ($ million)
      • Data Table on Hospitals and clinics - Market size and forecast 2023-2028 ($ million)
      • Chart on Hospitals and clinics - Year-over-year growth 2023-2028 (%)
      • Data Table on Hospitals and clinics - Year-over-year growth 2023-2028 (%)
    • 6.4 Ambulatory surgical centers - Market size and forecast 2023-2028
      • Chart on Ambulatory surgical centers - Market size and forecast 2023-2028 ($ million)
      • Data Table on Ambulatory surgical centers - Market size and forecast 2023-2028 ($ million)
      • Chart on Ambulatory surgical centers - Year-over-year growth 2023-2028 (%)
      • Data Table on Ambulatory surgical centers - Year-over-year growth 2023-2028 (%)
    • 6.5 Research and academic institutions - Market size and forecast 2023-2028
      • Chart on Research and academic institutions - Market size and forecast 2023-2028 ($ million)
      • Data Table on Research and academic institutions - Market size and forecast 2023-2028 ($ million)
      • Chart on Research and academic institutions - Year-over-year growth 2023-2028 (%)
      • Data Table on Research and academic institutions - Year-over-year growth 2023-2028 (%)
    • 6.6 Market opportunity by End-user
      • Market opportunity by End-user ($ million)
      • Data Table on Market opportunity by End-user ($ million)

    7 Market Segmentation by Product

    • 7.1 Market segments
      • Chart on Product - Market share 2023-2028 (%)
      • Data Table on Product - Market share 2023-2028 (%)
    • 7.2 Comparison by Product
      • Chart on Comparison by Product
      • Data Table on Comparison by Product
    • 7.3 Endoscopes - Market size and forecast 2023-2028
      • Chart on Endoscopes - Market size and forecast 2023-2028 ($ million)
      • Data Table on Endoscopes - Market size and forecast 2023-2028 ($ million)
      • Chart on Endoscopes - Year-over-year growth 2023-2028 (%)
      • Data Table on Endoscopes - Year-over-year growth 2023-2028 (%)
    • 7.4 Magnetic resonance imaging (MRI) - Market size and forecast 2023-2028
      • Chart on Magnetic resonance imaging (MRI) - Market size and forecast 2023-2028 ($ million)
      • Data Table on Magnetic resonance imaging (MRI) - Market size and forecast 2023-2028 ($ million)
      • Chart on Magnetic resonance imaging (MRI) - Year-over-year growth 2023-2028 (%)
      • Data Table on Magnetic resonance imaging (MRI) - Year-over-year growth 2023-2028 (%)
    • 7.5 Ultrasound systems - Market size and forecast 2023-2028
      • Chart on Ultrasound systems - Market size and forecast 2023-2028 ($ million)
      • Data Table on Ultrasound systems - Market size and forecast 2023-2028 ($ million)
      • Chart on Ultrasound systems - Year-over-year growth 2023-2028 (%)
      • Data Table on Ultrasound systems - Year-over-year growth 2023-2028 (%)
    • 7.6 Computed tomography (CT) scanners - Market size and forecast 2023-2028
      • Chart on Computed tomography (CT) scanners - Market size and forecast 2023-2028 ($ million)
      • Data Table on Computed tomography (CT) scanners - Market size and forecast 2023-2028 ($ million)
      • Chart on Computed tomography (CT) scanners - Year-over-year growth 2023-2028 (%)
      • Data Table on Computed tomography (CT) scanners - Year-over-year growth 2023-2028 (%)
    • 7.7 Others - Market size and forecast 2023-2028
      • Chart on Others - Market size and forecast 2023-2028 ($ million)
      • Data Table on Others - Market size and forecast 2023-2028 ($ million)
      • Chart on Others - Year-over-year growth 2023-2028 (%)
      • Data Table on Others - Year-over-year growth 2023-2028 (%)
    • 7.8 Market opportunity by Product
      • Market opportunity by Product ($ million)
      • Data Table on Market opportunity by Product ($ million)

    8 Market Segmentation by Type

    • 8.1 Market segments
      • Chart on Type - Market share (2023-2028) (%)
      • Data Table on Type - Market share (2023-2028) (%)
      • Market opportunity by $segment_name ($ million)
      • Data Table on Market opportunity by $segment_name ($ million)
    • 8.2 Comparison by Type
      • Chart on Comparison by Type
      • Data Table on Comparison by Type
    • 8.3 Cardiac Surgery - Market size and forecast (2023-2028)
      • Chart on Cardiac Surgery - Market size and forecast (2023-2028) ($ million)
      • Data Table on Cardiac Surgery - Market size and forecast (2023-2028) ($ million)
      • Chart on Cardiac Surgery - Year-over-year growth (2023-2028) (%)
      • Data Table on Cardiac Surgery - Year-over-year growth (2023-2028) (%)
    • 8.4 Neurosurgery - Market size and forecast (2023-2028)
      • Chart on Neurosurgery - Market size and forecast (2023-2028) ($ million)
      • Data Table on Neurosurgery - Market size and forecast (2023-2028) ($ million)
      • Chart on Neurosurgery - Year-over-year growth (2023-2028) (%)
      • Data Table on Neurosurgery - Year-over-year growth (2023-2028) (%)
    • 8.5 Orthopedic Surgery - Market size and forecast (2023-2028)
      • Chart on Orthopedic Surgery - Market size and forecast (2023-2028) ($ million)
      • Data Table on Orthopedic Surgery - Market size and forecast (2023-2028) ($ million)
      • Chart on Orthopedic Surgery - Year-over-year growth (2023-2028) (%)
      • Data Table on Orthopedic Surgery - Year-over-year growth (2023-2028) (%)
    • 8.6 Urology - Market size and forecast (2023-2028)
      • Chart on Urology - Market size and forecast (2023-2028) ($ million)
      • Data Table on Urology - Market size and forecast (2023-2028) ($ million)
      • Chart on Urology - Year-over-year growth (2023-2028) (%)
      • Data Table on Urology - Year-over-year growth (2023-2028) (%)
    • 8.7 Gastroenterology - Market size and forecast (2023-2028)
      • Chart on Gastroenterology - Market size and forecast (2023-2028) ($ million)
      • Data Table on Gastroenterology - Market size and forecast (2023-2028) ($ million)
      • Chart on Gastroenterology - Year-over-year growth (2023-2028) (%)
      • Data Table on Gastroenterology - Year-over-year growth (2023-2028) (%)
    • 8.8 Oncology Surgery - Market size and forecast (2023-2028)
      • Chart on Oncology Surgery - Market size and forecast (2023-2028) ($ million)
      • Data Table on Oncology Surgery - Market size and forecast (2023-2028) ($ million)
      • Chart on Oncology Surgery - Year-over-year growth (2023-2028) (%)
      • Data Table on Oncology Surgery - Year-over-year growth (2023-2028) (%)
    • 8.9 Others - Market size and forecast (2023-2028)
      • Chart on Others - Market size and forecast (2023-2028) ($ million)
      • Data Table on Others - Market size and forecast (2023-2028) ($ million)
      • Chart on Others - Year-over-year growth (2023-2028) (%)
      • Data Table on Others - Year-over-year growth (2023-2028) (%)

    9 Customer Landscape

    • 9.1 Customer landscape overview
      • Analysis of price sensitivity, lifecycle, customer purchase basket, adoption rates, and purchase criteria

    10 Geographic Landscape

    • 10.1 Geographic segmentation
      • Chart on Market share by geography 2023-2028 (%)
      • Data Table on Market share by geography 2023-2028 (%)
    • 10.2 Geographic comparison
      • Chart on Geographic comparison
      • Data Table on Geographic comparison
    • 10.3 North America - Market size and forecast 2023-2028
      • Chart on North America - Market size and forecast 2023-2028 ($ million)
      • Data Table on North America - Market size and forecast 2023-2028 ($ million)
      • Chart on North America - Year-over-year growth 2023-2028 (%)
      • Data Table on North America - Year-over-year growth 2023-2028 (%)
    • 10.4 Europe - Market size and forecast 2023-2028
      • Chart on Europe - Market size and forecast 2023-2028 ($ million)
      • Data Table on Europe - Market size and forecast 2023-2028 ($ million)
      • Chart on Europe - Year-over-year growth 2023-2028 (%)
      • Data Table on Europe - Year-over-year growth 2023-2028 (%)
    • 10.5 Asia - Market size and forecast 2023-2028
      • Chart on Asia - Market size and forecast 2023-2028 ($ million)
      • Data Table on Asia - Market size and forecast 2023-2028 ($ million)
      • Chart on Asia - Year-over-year growth 2023-2028 (%)
      • Data Table on Asia - Year-over-year growth 2023-2028 (%)
    • 10.6 Rest of World (ROW) - Market size and forecast 2023-2028
      • Chart on Rest of World (ROW) - Market size and forecast 2023-2028 ($ million)
      • Data Table on Rest of World (ROW) - Market size and forecast 2023-2028 ($ million)
      • Chart on Rest of World (ROW) - Year-over-year growth 2023-2028 (%)
      • Data Table on Rest of World (ROW) - Year-over-year growth 2023-2028 (%)
    • 10.7 US - Market size and forecast 2023-2028
      • Chart on US - Market size and forecast 2023-2028 ($ million)
      • Data Table on US - Market size and forecast 2023-2028 ($ million)
      • Chart on US - Year-over-year growth 2023-2028 (%)
      • Data Table on US - Year-over-year growth 2023-2028 (%)
    • 10.8 Germany - Market size and forecast 2023-2028
      • Chart on Germany - Market size and forecast 2023-2028 ($ million)
      • Data Table on Germany - Market size and forecast 2023-2028 ($ million)
      • Chart on Germany - Year-over-year growth 2023-2028 (%)
      • Data Table on Germany - Year-over-year growth 2023-2028 (%)
    • 10.9 UK - Market size and forecast 2023-2028
      • Chart on UK - Market size and forecast 2023-2028 ($ million)
      • Data Table on UK - Market size and forecast 2023-2028 ($ million)
      • Chart on UK - Year-over-year growth 2023-2028 (%)
      • Data Table on UK - Year-over-year growth 2023-2028 (%)
    • 10.10 China - Market size and forecast 2023-2028
      • Chart on China - Market size and forecast 2023-2028 ($ million)
      • Data Table on China - Market size and forecast 2023-2028 ($ million)
      • Chart on China - Year-over-year growth 2023-2028 (%)
      • Data Table on China - Year-over-year growth 2023-2028 (%)
    • 10.11 Canada - Market size and forecast 2023-2028
      • Chart on Canada - Market size and forecast 2023-2028 ($ million)
      • Data Table on Canada - Market size and forecast 2023-2028 ($ million)
      • Chart on Canada - Year-over-year growth 2023-2028 (%)
      • Data Table on Canada - Year-over-year growth 2023-2028 (%)
    • 10.12 Market opportunity by geography
      • Market opportunity by geography ($ million)
      • Data Tables on Market opportunity by geography ($ million)

    11 Drivers, Challenges, and Opportunity/Restraints

    • 11.1 Market drivers
      • 11.2 Market challenges
        • 11.3 Impact of drivers and challenges
          • Impact of drivers and challenges in 2023 and 2028
        • 11.4 Market opportunities/restraints

          12 Competitive Landscape

          • 12.1 Overview
            • 12.2 Competitive Landscape
              • Overview on criticality of inputs and factors of differentiation
            • 12.3 Landscape disruption
              • Overview on factors of disruption
            • 12.4 Industry risks
              • Impact of key risks on business

            13 Competitive Analysis

            • 13.1 Companies profiled
              • Companies covered
            • 13.2 Market positioning of companies
              • Matrix on companies position and classification
            • 13.3 Abbott Laboratories
              • Abbott Laboratories - Overview
              • Abbott Laboratories - Business segments
              • Abbott Laboratories - Key news
              • Abbott Laboratories - Key offerings
              • Abbott Laboratories - Segment focus
            • 13.4 Accuray Inc.
              • Accuray Inc. - Overview
              • Accuray Inc. - Product / Service
              • Accuray Inc. - Key offerings
            • 13.5 Brainlab AG
              • Brainlab AG - Overview
              • Brainlab AG - Product / Service
              • Brainlab AG - Key offerings
            • 13.6 C RAD AB
              • C RAD AB - Overview
              • C RAD AB - Product / Service
              • C RAD AB - Key offerings
            • 13.7 Canon Inc.
              • Canon Inc. - Overview
              • Canon Inc. - Business segments
              • Canon Inc. - Key news
              • Canon Inc. - Key offerings
              • Canon Inc. - Segment focus
            • 13.8 Elekta AB
              • Elekta AB - Overview
              • Elekta AB - Business segments
              • Elekta AB - Key offerings
              • Elekta AB - Segment focus
            • 13.9 General Electric Co.
              • General Electric Co. - Overview
              • General Electric Co. - Business segments
              • General Electric Co. - Key news
              • General Electric Co. - Key offerings
              • General Electric Co. - Segment focus
            • 13.10 Hitachi Ltd.
              • Hitachi Ltd. - Overview
              • Hitachi Ltd. - Business segments
              • Hitachi Ltd. - Key news
              • Hitachi Ltd. - Key offerings
              • Hitachi Ltd. - Segment focus
            • 13.11 Ion Beam Applications SA
              • Ion Beam Applications SA - Overview
              • Ion Beam Applications SA - Business segments
              • Ion Beam Applications SA - Key offerings
              • Ion Beam Applications SA - Segment focus
            • 13.12 IsoRay Inc.
              • IsoRay Inc. - Overview
              • IsoRay Inc. - Product / Service
              • IsoRay Inc. - Key offerings
            • 13.13 Koninklijke Philips NV
              • Koninklijke Philips NV - Overview
              • Koninklijke Philips NV - Business segments
              • Koninklijke Philips NV - Key news
              • Koninklijke Philips NV - Key offerings
              • Koninklijke Philips NV - Segment focus
            • 13.14 Medtronic Plc
              • Medtronic Plc - Overview
              • Medtronic Plc - Business segments
              • Medtronic Plc - Key news
              • Medtronic Plc - Key offerings
              • Medtronic Plc - Segment focus
            • 13.15 Olympus Corp.
              • Olympus Corp. - Overview
              • Olympus Corp. - Business segments
              • Olympus Corp. - Key news
              • Olympus Corp. - Key offerings
              • Olympus Corp. - Segment focus
            • 13.16 Siemens AG
              • Siemens AG - Overview
              • Siemens AG - Business segments
              • Siemens AG - Key news
              • Siemens AG - Key offerings
              • Siemens AG - Segment focus
            • 13.17 Stryker Corp.
              • Stryker Corp. - Overview
              • Stryker Corp. - Business segments
              • Stryker Corp. - Key news
              • Stryker Corp. - Key offerings
              • Stryker Corp. - Segment focus

            14 Appendix

            • 14.1 Scope of the report
              • 14.2 Inclusions and exclusions checklist
                • Inclusions checklist
                • Exclusions checklist
              • 14.3 Currency conversion rates for US$
                • Currency conversion rates for US$
              • 14.4 Research methodology
                • Research methodology
              • 14.5 Data procurement
                • Information sources
              • 14.6 Data validation
                • Data validation
              • 14.7 Validation techniques employed for market sizing
                • Validation techniques employed for market sizing
              • 14.8 Data synthesis
                • Data synthesis
              • 14.9 360 degree market analysis
                • 360 degree market analysis
              • 14.10 List of abbreviations
                • List of abbreviations

              Research Methodology

              Technavio presents a detailed picture of the market by way of study, synthesis, and summation of data from multiple sources. The analysts have presented the various facets of the market with a particular focus on identifying the key industry influencers. The data thus presented is comprehensive, reliable, and the result of extensive research, both primary and secondary.

              INFORMATION SOURCES

              Primary sources

              • Manufacturers and suppliers
              • Channel partners
              • Industry experts
              • Strategic decision makers

              Secondary sources

              • Industry journals and periodicals
              • Government data
              • Financial reports of key industry players
              • Historical data
              • Press releases

              DATA ANALYSIS

              Data Synthesis

              • Collation of data
              • Estimation of key figures
              • Analysis of derived insights

              Data Validation

              • Triangulation with data models
              • Reference against proprietary databases
              • Corroboration with industry experts

              REPORT WRITING

              Qualitative

              • Market drivers
              • Market challenges
              • Market trends
              • Five forces analysis

              Quantitative

              • Market size and forecast
              • Market segmentation
              • Geographical insights
              • Competitive landscape

              Interested in this report?

              Get your sample now to see our research methodology and insights!

              Download Now

              Frequently Asked Questions

              Image Guided Therapy System market growth will increase by $ 1888.8 mn during 2024-2028 .

              The Image Guided Therapy System market is expected to grow at a CAGR of 6.78% during 2024-2028 .

              Image Guided Therapy System market is segmented by End-user( Hospitals and clinics, Ambulatory surgical centers, Research and academic institutions) Product( Endoscopes, Magnetic resonance imaging (MRI), Ultrasound systems, Computed tomography (CT) scanners, Others)

              Abbott Laboratories, Accuray Inc., Analogic Corp., Brainlab AG, C RAD AB, Canon Inc., Elekta AB, General Electric Co., Hitachi Ltd., Ion Beam Applications SA, IsoRay Inc., KARL STORZ SE and Co. KG, Koninklijke Philips N.V., Medtronic Plc, Mevion Medical Systems Inc., Olympus Corp., Shimadzu Corp., Siemens AG, Stryker Corp., Varian Medical Systems Inc. are a few of the key vendors in the Image Guided Therapy System market.

              North America will register the highest growth rate of 40% among the other regions. Therefore, the Image Guided Therapy System market in North America is expected to garner significant business opportunities for the vendors during the forecast period.

              US, Germany, UK, China, Canada

              • High prevalence of cancerThe prevalence of cancer is increasing across the world due to various reasons is the driving factor this market.
              • including unhealthy diet is the driving factor this market.
              • lack of physical activity is the driving factor this market.
              • tobacco use is the driving factor this market.
              • and excessive alcohol consumption. Generally is the driving factor this market.
              • tumor development involves simultaneous changes in thousands of cells and variations in genes. According to the International Agency for Research on Cancer (IARC) is the driving factor this market.
              • 20% of people develop cancer during their lifetime globally is the driving factor this market.
              • and 12.5% of men and 9.09% of women die from the disease. A rise in the elderly population around the globe and socio-economic risk factors are the primary factors driving the increase in the prevalence of various carcinomas. Breast cancer is the most common cancer diagnosed among women globally. Colorectal is the driving factor this market.
              • lung is the driving factor this market.
              • cervical is the driving factor this market.
              • and thyroid cancers are also common among women. Moreover is the driving factor this market.
              • the US National Cancer Institute estimates that by 2030 is the driving factor this market.
              • the global number of cancer cases and deaths are expected to be 21.6 million and 13.5 million is the driving factor this market.
              • respectively. In the future is the driving factor this market.
              • diagnosis and treatment costs are likely to increase as the population ages and increase in the number of people affected with cancer. Costs are also likely to increase as new and often more expensive treatments are adopted as standards of care. In order to offer improved treatment options is the driving factor this market.
              • medical facilities need sensitive and reliable diagnostics for accurate and early diagnosis of cancer. Thus is the driving factor this market.
              • the high incidence of cancer is increasing the demand for cancer screening and diagnoses is the driving factor this market.
              • which is expected to drive the growth of the global image guided therapy system market during the forecast period. Similarly is the driving factor this market.
              • the increasing prevalence of other chronic conditions is the driving factor this market.
              • such as cardiovascular diseases and neurological disorders is the driving factor this market.
              • will augment the demand for image guided therapy systems during the forecast period. is the driving factor this market.

              The Image Guided Therapy System market vendors should focus on grabbing business opportunities from the Hospitals and clinics segment as it accounted for the largest market share in the base year.