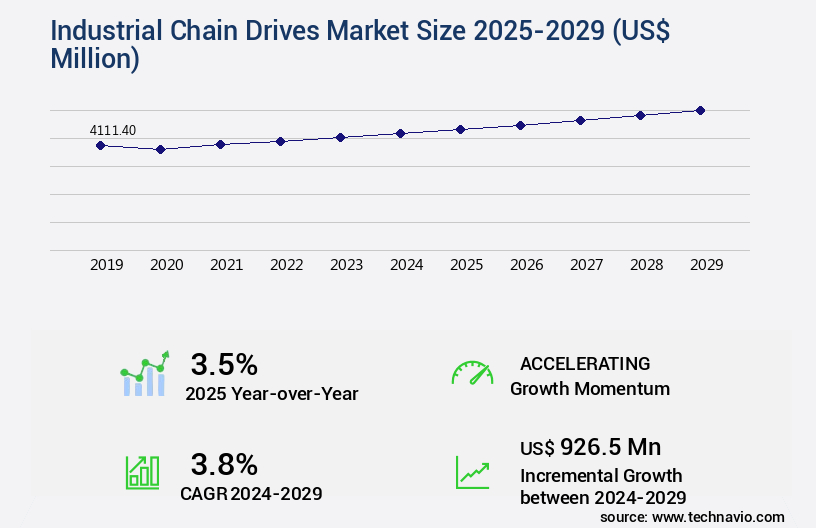
Industrial Chain Drives Market Size 2025-2029
The industrial chain drives market size is forecast to increase by USD 926.5 million, at a CAGR of 3.8% between 2024 and 2029. Growing end-user investments in APAC will drive the industrial chain drives market.
Major Market Trends & Insights
- APAC dominated the market and accounted for a 65% growth during the forecast period.
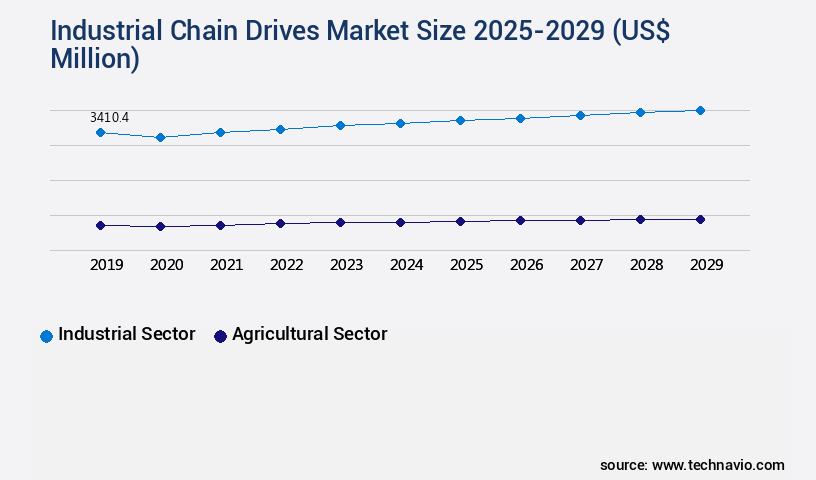
- By End-user - Industrial sector segment was valued at USD 3410.40 million in 2023
- By Product Type - Roller chains segment accounted for the largest market revenue share in 2023
Market Size & Forecast
- Market Opportunities: USD 33.63 million
- Market Future Opportunities: USD 926.50 million
- CAGR : 3.8%
- APAC: Largest market in 2023
Market Summary
- The market is a dynamic and ever-evolving landscape, characterized by continuous advancements in core technologies and expanding applications. With a focus on enhancing productivity and efficiency, this market is witnessing significant growth, particularly in regions such as Asia Pacific, where end-user investments are on the rise. According to recent reports, the APAC market is projected to account for over 50% of the global demand by 2025. However, the market's growth is not without challenges. High costs associated with lubrication and related services continue to pose significant hurdles for market participants.
- Despite these challenges, the market presents numerous opportunities for growth, particularly in industries such as automotive, food and beverage, and oil and gas. As key companies, including Bosch Rexroth, Schaeffler, and Nabtesco, continue to innovate and expand their offerings, the market is poised for continued evolution in the coming years.
What will be the Size of the Industrial Chain Drives Market during the forecast period?
Get Key Insights on Market Forecast (PDF) Request Free Sample
How is the Industrial Chain Drives Market Segmented and what are the key trends of market segmentation?
The industrial chain drives industry research report provides comprehensive data (region-wise segment analysis), with forecasts and estimates in "USD million" for the period 2025-2029, as well as historical data from 2019-2023 for the following segments.
- End-user
- Industrial sector
- Agricultural sector
- Product Type
- Roller chains
- Silent chains
- Leaf chains
- Others
- Material
- Alloy steel
- Carbon steel
- Nickel-chrome alloys
- Others
- Geography
- North America
- US
- Canada
- Mexico
- Europe
- Germany
- UK
- APAC
- Australia
- China
- India
- Japan
- South Korea
- Rest of World (ROW)
- North America
By End-user Insights
The industrial sector segment is estimated to witness significant growth during the forecast period.
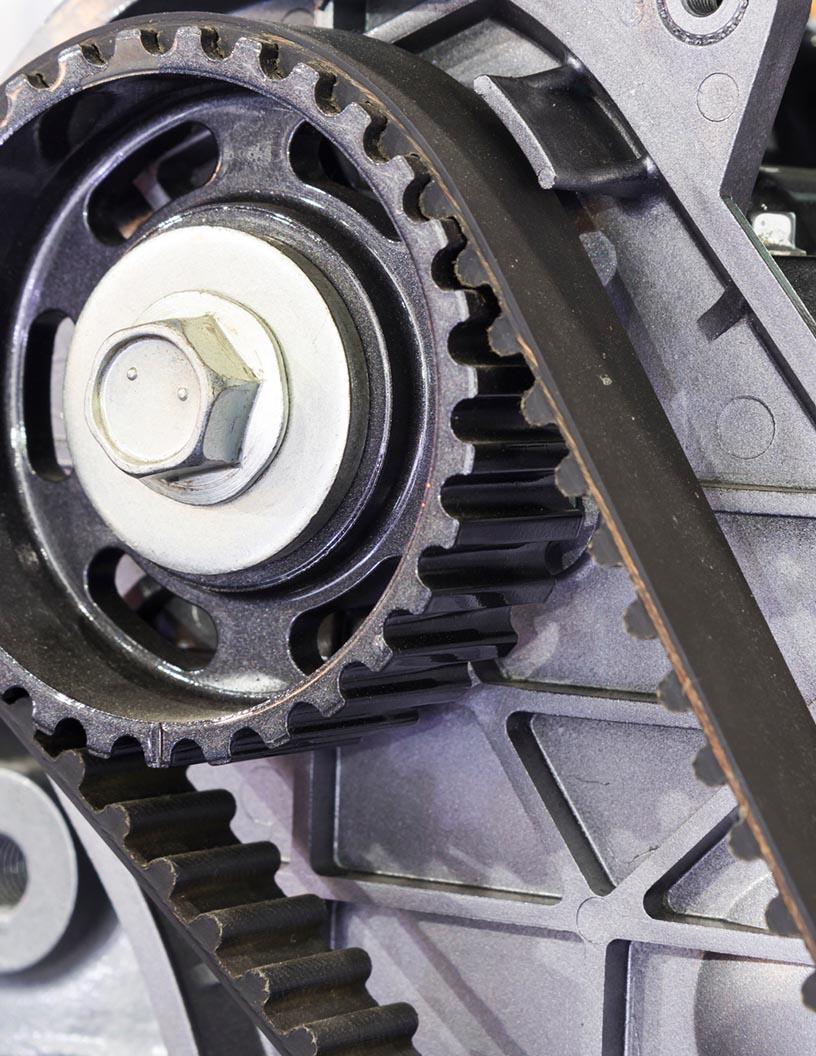
The market encompasses various types of chain drive systems utilized in industrial machinery for both mobile and stationary applications. Key sectors utilizing these drives include oil and gas, chemical and petrochemical, food and beverage, metals and mining, paper and pulp, cement, and fertilizer industries. In the oil and gas sector, heavy-duty chain drives are extensively employed in rig and port applications, managing cable packages for main hoists and slewing systems. Furthermore, they are deployed in lay towers and drilling operations for onshore oil and gas applications. Industrial chain maintenance plays a crucial role in ensuring optimal chain drive efficiency.
Regular inspections, lubrication, and replacement of worn-out components such as roller chains, sprockets, and drive chain tensioners are essential for maintaining chain drive systems' longevity and performance. The roller chain drives segment is witnessing significant growth due to their ability to handle heavy loads and high speeds. High-speed chain drives, in particular, are gaining popularity due to their enhanced efficiency and reduced noise levels. Silent chain drives are another emerging trend in the market, catering to industries requiring minimal noise emissions. The market for industrial chain drives is projected to grow substantially, with an estimated 18.3% of the total industrial machinery market share.
Additionally, the precision chain drives segment is expected to expand at a rapid pace, driven by the increasing demand for high-precision applications in various industries. Industrial chain durability is a critical factor influencing the market's growth. The development of advanced materials and manufacturing techniques has led to the production of more robust and long-lasting chain drives. Moreover, the ongoing advancements in chain drive optimization and selection methods contribute to the market's continuous evolution. In conclusion, the market is a significant component of the industrial machinery sector, serving various industries and applications. Its growth is driven by factors such as increasing demand for high-performance chain drives, the need for efficient maintenance practices, and the ongoing development of advanced chain drive technologies.
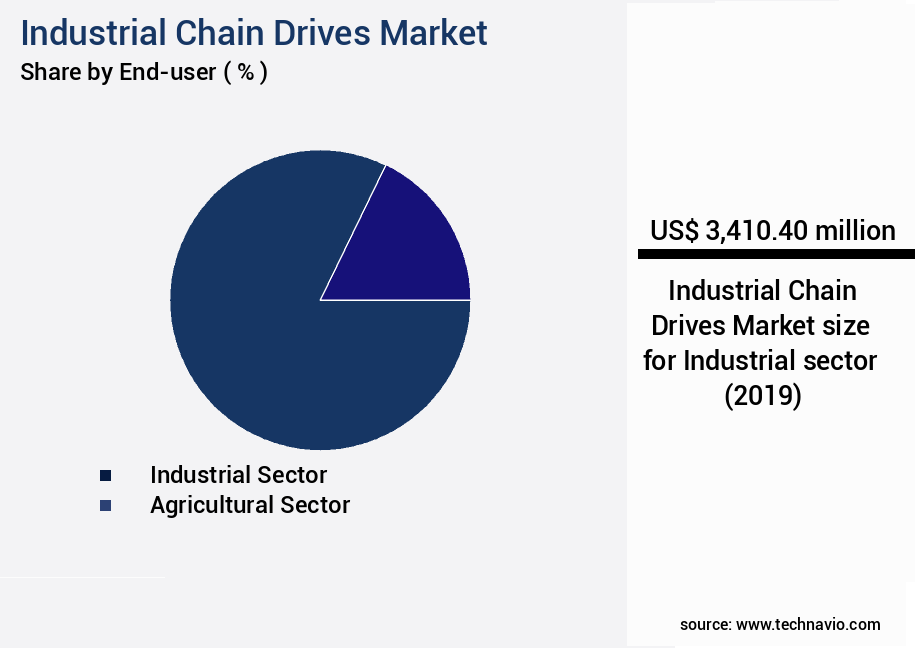
The Industrial sector segment was valued at USD 3410.40 million in 2019 and showed a gradual increase during the forecast period.
Regional Analysis
APAC is estimated to contribute 65% to the growth of the global market during the forecast period.Technavio's analysts have elaborately explained the regional trends and drivers that shape the market during the forecast period.

See How Industrial Chain Drives Market Demand is Rising in APAC Request Free Sample
In the Asia-Pacific (APAC) region, industries are the primary consumers of industrial chain drives. APAC's ongoing economic growth, particularly in developing countries like India and China, significantly contributes to the expansion of the market. Initiatives such as Make in India and Make in China, which focus on bolstering domestic manufacturing industries, further support market growth. Small and medium enterprises (SMEs) in Asian countries are crucial for increasing domestic demand.
Cost-effective industrial chain drive products contribute to this trend. The market in APAC is characterized by continuous evolution and growth.
Market Dynamics
Our researchers analyzed the data with 2024 as the base year, along with the key drivers, trends, and challenges. A holistic analysis of drivers will help companies refine their marketing strategies to gain a competitive advantage.
The industrial chain drive market encompasses a diverse range of power transmission solutions that facilitate the efficient transfer of power between linked components in various industries. Calculating the power requirements for these systems is a crucial initial step, ensuring the selected chain drive can handle the necessary workload. Preventative maintenance is another essential aspect, with regular inspections and lubrication essential for maintaining roller chain drive efficiency. Selecting an appropriate chain drive for a conveyor system necessitates careful consideration of factors such as speed, load capacity, and environmental conditions. The impact of lubrication on chain drive efficiency is significant, with proper lubrication reducing wear and enhancing system longevity.
Design considerations for high-speed chain drives include material selection, tensioning techniques, and alignment. Troubleshooting common chain drive system failures, such as misalignment or wear, is an ongoing challenge. Methods for reducing noise in industrial chain drives include using specialized materials and optimizing system design. Determining chain drive life cycle and replacement intervals is crucial for minimizing downtime and maintenance costs. Assessing chain drive strength and durability requirements varies depending on the application. Implementing safety procedures for industrial chain drives is essential to prevent accidents and ensure worker safety. Optimizing chain drive system efficiency can lead to significant cost savings, with monitoring sensors providing valuable performance data.
Comparing different types of industrial chain drives, such as roller, timing, and link belt drives, reveals notable differences in terms of efficiency, durability, and cost. For instance, roller chain drives offer high power density and load capacity but are generally noisier than link belt drives. Improving chain drive system reliability and longevity involves implementing best practices, such as proper installation, tensioning, and maintenance. A cost-benefit analysis of chain drive system upgrades reveals that investing in advanced materials, such as high-strength steel or composite materials, can lead to significant long-term savings through increased durability and reduced maintenance requirements. Understanding chain drive wear patterns and their causes is essential for effective maintenance and replacement planning.
Best practices for installing and maintaining chain drives include proper tensioning techniques, regular inspections, and timely lubrication.
What are the key market drivers leading to the rise in the adoption of Industrial Chain Drives Industry?
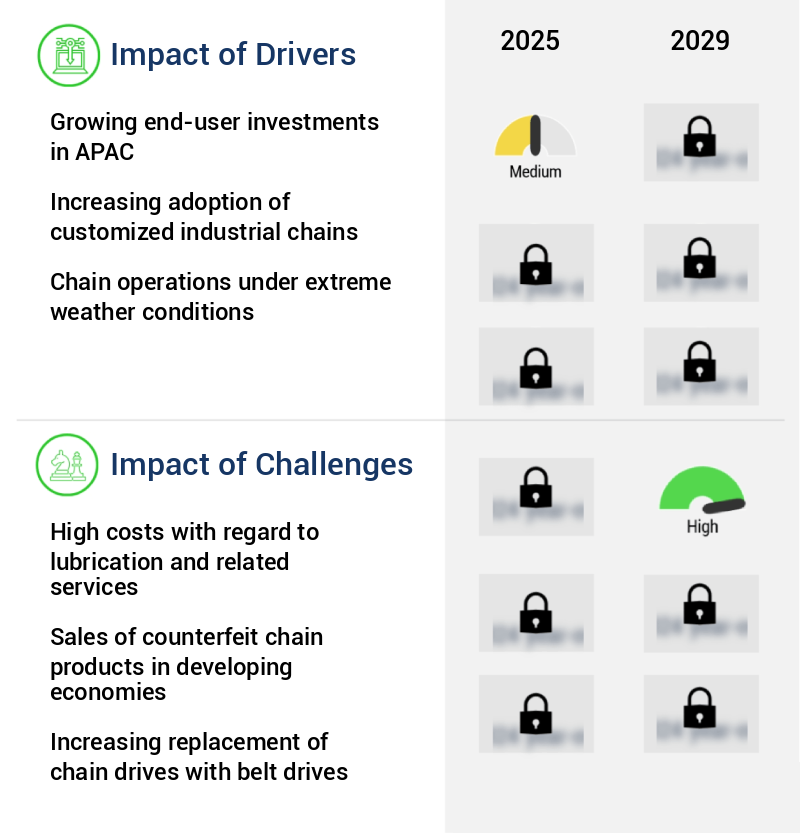
- In the Asia-Pacific region, the significant growth in end-user investments serves as the primary catalyst for market expansion.
- The industrial chain drive market in Asia Pacific (APAC) is experiencing significant growth due to increasing investments in end-user industries. Factors contributing to this expansion include the availability of low-cost raw materials, abundant labor resources, favorable demographics, and high demand for industrial products. These conditions create a favorable environment for industrial chain drive manufacturers in APAC, making the region a key player in the global market. Additionally, the region's low manufacturing costs have attracted end-user companies from developed regions to invest in new projects, providing opportunities for industrial chain drive adoption. The continuous growth of projects within the end-user industries enables APAC industrial chain drive manufacturers to maintain a competitive edge.
- It's essential to emphasize the ongoing nature of market activities and the evolving patterns that drive growth. The industrial chain drive market in APAC is a dynamic and evolving landscape, with numerous opportunities for innovation and expansion.
What are the market trends shaping the Industrial Chain Drives Industry?
- Mergers and acquisitions are experiencing an upward trend in the market. A rise in mergers and acquisitions is currently prevailing as a market trend.
- Companies in the industrial chain are employing strategic mergers and acquisitions and partnerships to expand their presence in developing regions and gain a competitive edge in the chain and sprocket market. These strategies enable manufacturers to penetrate indigenous markets, access local market insights and expertise, and leverage technological advancements and resources from their international partners. By driving revenue growth and delivering advanced chain drives to the global market, international companies aim to sustain a competitive advantage over other key players. The importance of these strategies is evident as the industrial chain continues to evolve, with manufacturers focusing on innovation and product development to meet the diverse needs of various sectors.
- For instance, the transportation industry demands high-performance chain drives for efficient power transmission, while the manufacturing sector requires robust and durable chain drives for heavy machinery applications. In the energy sector, there is a growing trend towards renewable energy solutions, necessitating the development of chain drives for wind turbines and solar panels. The market's continuous unfolding and evolving patterns underscore the need for companies to stay agile and responsive to changing customer requirements and industry trends.
What challenges does the Industrial Chain Drives Industry face during its growth?
- The escalating expenses related to lubrication and associated services represent a significant challenge to the industry's growth trajectory.
- Industrial chain drives play a crucial role in power transmission in various industries, enabling smooth operation of machinery. However, their maintenance and lubrication requirements add to operational costs. Traditionally, industrial chain drives necessitate continuous lubrication to minimize energy losses due to friction. This manual process increases labor costs and can lead to unplanned production downtime. The latest advancements in industrial chain drives include lube-free chain drives, which eliminate the need for lubrication. For example, conveyor chains can now operate without lubrication, significantly reducing maintenance costs and production interruptions. Despite these benefits, the initial investment for lube-free chain drives is higher than their lubricated counterparts.
- Comparatively, the cost of lubrication and frequent maintenance for industrial chain drives can amount to a substantial portion of the total operational expenses. According to industry reports, lubrication costs account for approximately 1-2% of the total production costs in industries relying heavily on chain drives. In conclusion, while lubrication is essential for the smooth operation and longevity of industrial chain drives, it adds to the operational costs. The shift towards lube-free chain drives presents an opportunity for cost savings, but the higher initial investment is a consideration. As a business-savvy assistant, it's crucial to weigh the pros and cons of both options and make informed decisions based on the unique requirements and budget of your industrial operations.
Exclusive Customer Landscape
The industrial chain drives market forecasting report includes the adoption lifecycle of the market, covering from the innovator's stage to the laggard's stage. It focuses on adoption rates in different regions based on penetration. Furthermore, the industrial chain drives market report also includes key purchase criteria and drivers of price sensitivity to help companies evaluate and develop their market growth analysis strategies.

Customer Landscape of Industrial Chain Drives Industry
Competitive Landscape & Market Insights
Companies are implementing various strategies, such as strategic alliances, industrial chain drives market forecast, partnerships, mergers and acquisitions, geographical expansion, and product/service launches, to enhance their presence in the industry.
Tsubakimoto Chain Co. - Industrial chain drives from this company feature a zero slip design, ensuring consistent speed ratios and seamless power transfer. Acting as functional equivalents to timing chains, these drives excel in applications such as internal combustion engines, delivering optimal performance.
The industry research and growth report includes detailed analyses of the competitive landscape of the market and information about key companies, including:
- Tsubakimoto Chain Co.
- Renold PLC
- Rexnord Corporation
- SKF Group
- Diamond Chain Company
- Timken Company
- Iwis
- Regina Catene Calibrate S.p.A.
- KettenWulf
- Donghua Chain Group
- Hangzhou Chinabase Machinery
- Zhejiang Gidi Chain
- Peer Chain
- U.S. Tsubaki
- Martin Sprocket & Gear
- Allied-Locke Industries
- Ramsey Products
- KMC Chain Industrial
- Daido Kogyo
- Wippermann
- Senqcia Corporation
Qualitative and quantitative analysis of companies has been conducted to help clients understand the wider business environment as well as the strengths and weaknesses of key industry players. Data is qualitatively analyzed to categorize companies as pure play, category-focused, industry-focused, and diversified; it is quantitatively analyzed to categorize companies as dominant, leading, strong, tentative, and weak.
Recent Development and News in Industrial Chain Drives Market
- In January 2024, Bosch Rexroth, a leading industrial technology company, introduced its new generation of IndraDrive Mi drive technology, featuring higher efficiency and smaller size. This innovation was announced in a company press release and is expected to significantly impact the market by offering improved performance and cost savings (Bosch Rexroth, 2024).
- In March 2024, Schneider Electric, a global energy management and automation solutions provider, and ABB, a leading technology company in power and automation, announced a strategic partnership to combine their respective offerings in electric motors and drives. This collaboration, revealed in a joint press release, aims to create a comprehensive portfolio and strengthen their positions in the market (Schneider Electric & ABB, 2024).
- In May 2024, Nidec Corporation, a Japanese manufacturing company, completed the acquisition of Emerson Electric's Industrial Automation business. This deal, reported in a company press release, significantly expanded Nidec's presence in the industrial automation and drives market, providing access to new technologies and customers (Nidec Corporation, 2024).
- In April 2025, Siemens AG, a German technology powerhouse, received regulatory approval for its acquisition of Sensirion AG, a Swiss sensor manufacturer. This acquisition, announced in a company press release, is expected to enhance Siemens' industrial chain drives offerings with advanced sensor technology, providing more accurate and efficient drive solutions (Siemens AG, 2025).
Dive into Technavio's robust research methodology, blending expert interviews, extensive data synthesis, and validated models for unparalleled Industrial Chain Drives Market insights. See full methodology.
|
Market Scope |
|
|
Report Coverage |
Details |
|
Page number |
225 |
|
Base year |
2024 |
|
Historic period |
2019-2023 |
|
Forecast period |
2025-2029 |
|
Growth momentum & CAGR |
Accelerate at a CAGR of 3.8% |
|
Market growth 2025-2029 |
USD 926.5 million |
|
Market structure |
Fragmented |
|
YoY growth 2024-2025(%) |
3.5 |
|
Key countries |
US, China, India, Germany, Canada, Japan, Mexico, Australia, South Korea, and UK |
|
Competitive landscape |
Leading Companies, Market Positioning of Companies, Competitive Strategies, and Industry Risks |
Research Analyst Overview
- In the realm of industrial automation, chain drive systems play a pivotal role in power transmission and material handling. These systems, encompassing conveyor chains, power transmission chains, and roller chain drives, undergo constant optimization to enhance efficiency and productivity. Chain drive maintenance is a critical aspect of industrial operations, ensuring the longevity and optimal performance of these systems. Lubrication systems, for instance, play a crucial role in maintaining chain drive efficiency. High-speed chain drives, in particular, necessitate meticulous maintenance due to their increased operational speeds and demands. The industrial chain market is characterized by continuous evolution, with ongoing advancements in chain drive technology.
- For example, silent chain drives have gained popularity due to their reduced noise levels, while precision chain drives cater to industries requiring high accuracy. Sprocket design and roller chain sizing are essential components of chain drive selection, with various factors influencing the choice between heavy-duty and lightweight chains. Chain drive installation and tensioners are also crucial elements, ensuring proper alignment and tension for efficient power transmission. Chain wear monitoring is an essential practice for maintaining industrial chain durability. By closely observing and addressing wear patterns, industries can prevent costly downtime and extend the lifespan of their chain drive systems.
- In conclusion, the industrial chain market is a dynamic landscape, driven by the ongoing quest for improved efficiency, productivity, and durability. From chain drive optimization and maintenance to component selection and troubleshooting, each aspect plays a vital role in ensuring the seamless operation of industrial processes.
What are the Key Data Covered in this Industrial Chain Drives Market Research and Growth Report?
-
What is the expected growth of the Industrial Chain Drives Market between 2025 and 2029?
-
USD 926.5 million, at a CAGR of 3.8%
-
-
What segmentation does the market report cover?
-
The report segmented by End-user (Industrial sector and Agricultural sector), Product Type (Roller chains, Silent chains, Leaf chains, and Others), Material (Alloy steel, Carbon steel, Nickel-chrome alloys, and Others), and Geography (APAC, North America, Europe, South America, Middle East and Africa, and Rest of World (ROW))
-
-
Which regions are analyzed in the report?
-
APAC, North America, Europe, South America, and Middle East and Africa
-
-
What are the key growth drivers and market challenges?
-
Growing end-user investments in APAC, High costs with regard to lubrication and related services
-
-
Who are the major players in the Industrial Chain Drives Market?
-
Key Companies Tsubakimoto Chain Co., Renold PLC, Rexnord Corporation, SKF Group, Diamond Chain Company, Timken Company, Iwis, Regina Catene Calibrate S.p.A., KettenWulf, Donghua Chain Group, Hangzhou Chinabase Machinery, Zhejiang Gidi Chain, Peer Chain, U.S. Tsubaki, Martin Sprocket & Gear, Allied-Locke Industries, Ramsey Products, KMC Chain Industrial, Daido Kogyo, Wippermann, and Senqcia Corporation
-
Market Research Insights
- The industrial chain drives market is defined by a focus on optimizing chain drive system for increased efficiency and reliability. Proper lubrication on chain drive efficiency is a critical factor, as poor or insufficient lubrication is the cause of failure in approximately 60% of cases.
- Moreover, proper lubrication can extend the life of a chain by up to 60 times. Troubleshooting common chain drive system failures often involves addressing issues like misalignment, which can drastically reduce a system's lifespan. The effects of chain drive misalignment on system performance are so significant that ensuring accurate alignment can substantially contribute to a longer drive life.
- Methods for reducing noise in industrial chain drives are also evolving; for example, certain designs have been shown to reduce noise levels by an average of 3 to 8 dB.
- Overall, cost-benefit analysis of chain drive system upgrades consistently shows a strong return, as companies aim to improve chain drive system reliability and longevity to minimize downtime, which can cost as much as USD50,000 per hour in some manufacturing environments
We can help! Our analysts can customize this industrial chain drives market research report to meet your requirements.
 RIA -
RIA - 
