Industrial Chain Market Size and Forecast Report- APAC, North America, Europe, South America, Middle East and Africa - China, US, Germany, India, Canada, Japan, UK, France, South Korea, Italy (2025-2029)

Industrial Chain Market Size and Forecast Report- APAC, North America, Europe, South America, Middle East and Africa - China, US, Germany, India, Canada, Japan, UK, France, South Korea, Italy (2025-2029)

Published: Nov 2024 208 Pages SKU: IRTNTR80412

Market Overview at a Glance

$970 Mn
Market Opportunity
4.4%
CAGR
3.0
YoY growth 2024-2025(%)

Industrial Chain Market Size 2025-2029

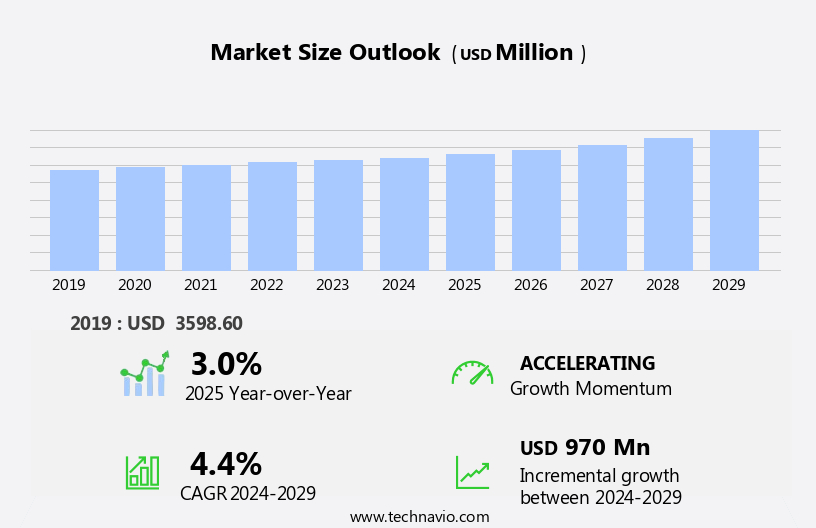
The industrial chain market size is forecast to increase by USD 970 billion at a CAGR of 4.4% between 2024 and 2029.

  • The market encompasses hydraulic systems, direct drive systems, and power transmission systems, all essential components of industrial automation. This market is driven by the increasing industrialization and urbanization, leading to a heightened demand for automation solutions. companies in this market continue to introduce innovative products to meet the evolving needs of industries.
  • However, fluctuations in raw material prices pose a significant challenge. Hydraulic systems, for instance, rely on oil prices, while direct drive systems depend on the availability and cost of rare earth magnets. Incorporating advanced technologies like double-pitch chains in power transmission systems can enhance efficiency and productivity, making them a popular choice for automation applications.

What will be Industrial Chain Market Size During the Forecast Period?

Industrial Chain Market Size

 Request Free Sample

  • The market encompasses various industries such as mining, agricultural equipment, construction, consumer goods, and transportation. This market plays a crucial role in the production and distribution of raw materials and finished products. In the upstream sector, the focus is on the extraction and processing of raw materials. The availability of cheap raw materials is a significant factor driving the market. Power transmission components, including roller chains, leaf chains, and chain drives, are essential in this stage to transport and convey materials from one process to another.
  • Moving towards the midstream sector, the market plays a vital role in the transformation of raw materials into semi-finished and finished products. Automation and cost-efficient materials are essential in this stage to increase productivity and reduce costs. Material handling tools, conveyors, and sorting systems are some of the key components used in this sector. Lastly, in the downstream sector, the market facilitates the transportation of finished products to various industries and end-users. Cargo transportation and e-commerce are two significant applications in this sector. The efficient and timely delivery of finished products is crucial to maintain customer satisfaction and ensure business growth.

How is this market segmented and which is the largest segment?

The market research report provides comprehensive data (region-wise segment analysis), with forecasts and estimates in "USD million" for the period 2025-2029, as well as historical data from 2019-2023 for the following  industrial chain market segment

  • Type
    • Roller chains
    • Leaf chains
    • Others
  • End-user
    • Automotive
    • Food and beverage
    • Agriculture
    • Mining and construction
    • Oil and gas
  • Geography
    • APAC
      • China
      • India
      • Japan
      • South Korea
    • North America
      • Canada
      • US
    • Europe
      • Germany
      • UK
      • France
      • Italy
    • South America
    • Middle East and Africa

By Type Insights

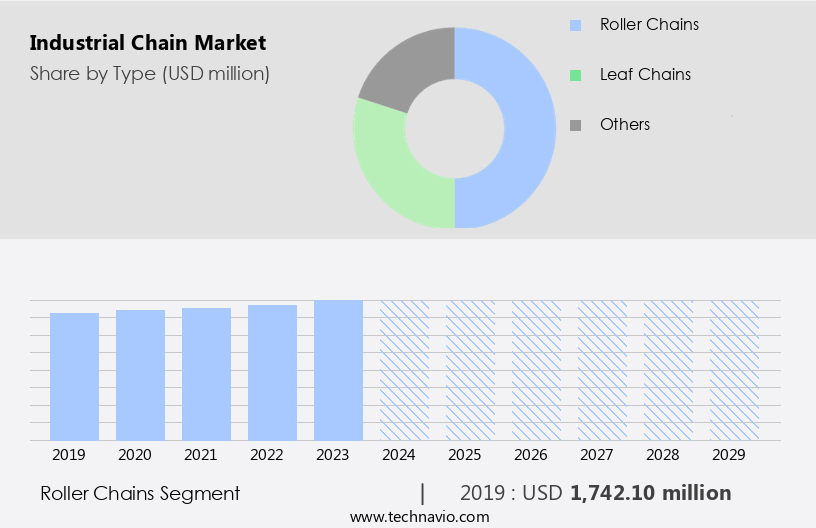
  • The roller chains segment is estimated to witness significant growth during the forecast period.

Roller chains play a vital role in the transfer of mechanical power and material handling in numerous industries, including food and beverage, electronics, and transportation. These chains function by connecting to rotating sprockets linked to motors, enabling efficient power transmission or material conveyance. The roller chain structure consists of two types of links: inner links and outer links. Inner links, which include rollers and bushings between two plates, ensure smooth movement. Outer links, made up of two plates joined by pins, pass through the inner links' bushings, ensuring the chain operates optimally. Roller chains' application extends to various sectors, notably in the power transmission of industrial machinery and product conveyance within manufacturing facilities.

The food and beverage industry utilizes roller chains for processing and packaging equipment, while electronics manufacturing relies on them for assembly lines. In transportation, roller chains are essential for material handling systems, such as conveyor belts and lift trucks. Additionally, the availability of cheap raw materials contributes to the market's growth in these industries. In summary, roller chains are indispensable components in industries that require power transmission and material handling. Their versatility and efficiency make them a popular choice in food and beverage, electronics, and transportation sectors. The availability of affordable raw materials further bolsters the market's growth in these industries.

Industrial Chain Market Size

Get a glance at the market report of share of various segments Request Free Sample

The Roller chains segment was valued at USD 1742.10 million in 2019 and showed a gradual increase during the forecast period.

Regional Analysis

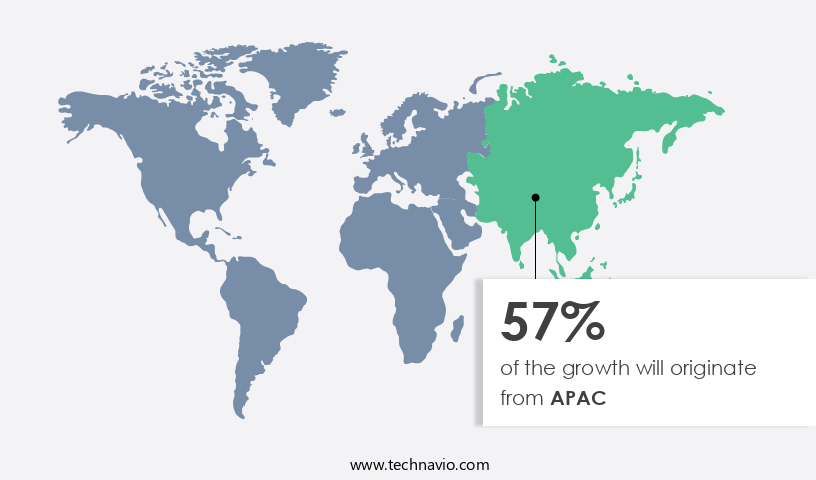
  • APAC is estimated to contribute 57% to the growth of the global market during the forecast period.

Technavio's analysts have elaborately explained the regional trends and drivers that shape the market during the forecast period.

Industrial Chain Market Share by Geography

For more insights on the market share of various regions Request Free Sample

As per Industrial Chain Regional Insights the Asia-Pacific (APAC) will be playing a pivotal role in the market due to its thriving manufacturing, construction, mining, and agricultural sectors. In China, the world's leading manufacturing hub, industrial chains are essential for various applications, including consumer goods production and heavy machinery. For instance, the Chinese automotive sector experienced steady growth from January to September 2024, producing around 21.4 million units, a 1.9% increase year-on-year, and selling 21.57 million units, a 2.4% rise. This growth highlights the importance of industrial chains in fostering the automotive industry's expansion and efficiency. Moreover, the construction and mining industries in APAC significantly contribute to the demand for industrial chains. The agricultural sector also benefits from lightweight materials and advanced machinery, driving the need for robust industrial chains. Additionally, the increasing adoption of electric vehicles (EVs) in APAC countries is expected to further boost the demand for industrial chains in the coming years.

Market Dynamics

Our researchers analyzed the data with 2024 as the base year, along with the key drivers, trends, and challenges. A holistic analysis of drivers will help companies refine their marketing strategies to gain a competitive advantage.The market is a complex network of interconnected industries. Each sector relies on the other to ensure a smooth flow of raw materials and finished products. The use of advanced power transmission components, such as chain drives, and material handling tools, enables industries to streamline their processes and increase efficiency. In conclusion, the market plays a vital role in the production and distribution of various industries. From the extraction and processing of raw materials to the delivery of finished products, the market ensures a seamless flow of goods and materials. By focusing on cost-efficient materials, automation, and efficient power transmission components, industries can optimize their operations and remain competitive in the market.

What are the key market drivers leading to the rise in adoption of Industrial Chain Market ?

Rising industrialization and urbanization is the key driver of the market.

  • The market in the United States is experiencing significant growth due to the increasing industrialization and urbanization trend. According to the United Nations, approximately 56% of the world's population, or 4.4 billion people, resided in urban areas in 2023. This percentage is projected to reach nearly 70% by 2050. This urban population growth necessitates extensive infrastructure development and efficient manufacturing processes in cities. In the US, the manufacturing sector contributed USD2.3 trillion to the GDP in 2023, representing 10.2% of the total GDP. Industrial chains play a crucial role in supporting manufacturing activities in the US, from production lines to logistics and transportation systems.
  • Chain drives, including roller chains and leaf chains, are essential components in material handling tools such as conveyors and sorting systems. These systems facilitate the efficient movement of goods and raw materials in manufacturing processes. The demand for industrial chains is expected to continue growing as the US manufacturing sector adapts to meet the needs of an urbanizing population. 

What are the market trends shaping the Industrial Chain Market?

Introduction of new products by vendors is the upcoming trend in the market.

  • The market is experiencing notable progressions due to the launch of innovative solutions by key players. On September 17, 2024, Tsubakimoto Chain Co. Announced the introduction of the Epsilon Chain Stainless Steel Series. Scheduled for release on October 1, 2024, this groundbreaking product boasts the world's smallest roller chain, measuring only 1.905 mm in pitch. This advanced chain is designed to deliver dependable power transmission in confined areas. Its anticipated benefits include improved precision, efficiency, and compactness in medical devices, healthcare equipment, and industrial robots. By substituting conventional belts and cables, the Epsilon Chain offers more accurate, streamlined power transmission, thereby decreasing labor requirements and enhancing energy productivity in manufacturing operations.

What challenges does Industrial Chain Market face during the growth?

Fluctuations in raw material prices is a key challenge affecting the market growth.

  • The market in the United States is influenced by several factors, including the cost fluctuations of key raw materials such as steel and aluminum in the e-commerce sector and cargo transportation industry. The price instability of these materials can significantly impact manufacturing expenses, thereby shaping the market landscape. For example, the price of iron ore in China rose from USD105 per tonne in August 2023 to USD135 per tonne in December 2023. Furthermore, the cost of coal has also seen a surge, contributing to the overall rise in steel prices.  Given that China is the world's leading steel manufacturer, these price increases have a substantial impact on the US the market, leading to increased production costs and narrower profit margins for manufacturers.

Exclusive Customer Landscape

The market forecasting report includes the adoption lifecycle of the market, covering from the innovator's stage to the laggard's stage. It focuses on adoption rates in different regions based on penetration. Furthermore, the market report also includes key purchase criteria and drivers of price sensitivity to help companies evaluate and develop their market growth analysis strategies.
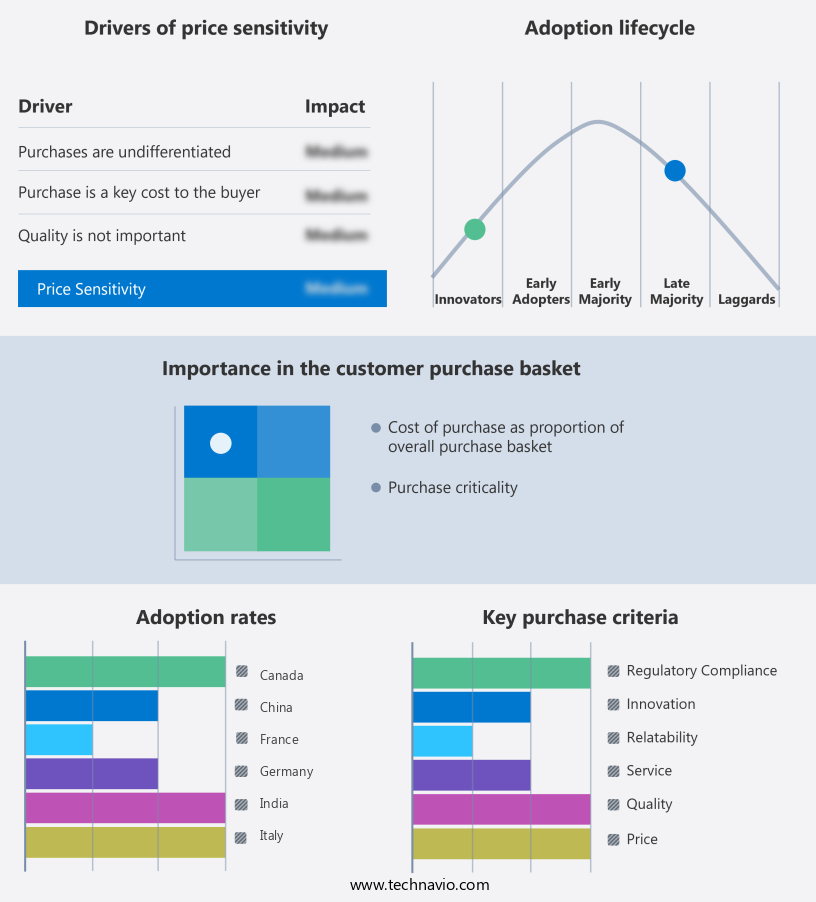
Industrial Chain Market Share by Geography

 Customer Landscape

Key Companies & Market Insights

Companies are implementing various strategies, such as strategic alliances, market forecast , partnerships, mergers and acquisitions, geographical expansion, and product/service launches, to enhance their presence in the market.

Anant Engineering - Our company provides a range of industrial chains for various applications, including extended pin chains, conveyor chains, conveyor attachment chains, and transmission chains. These chains ensure the smooth operation and efficiency of industrial processes in sectors such as manufacturing, transportation, and construction. Our offerings are of the highest quality, ensuring reliability and durability. We are committed to delivering solutions that meet the unique needs of our clients, enhancing their productivity and competitiveness in the market. Our industrial chains undergo rigorous testing to ensure they meet the highest industry standards, providing peace of mind and reducing downtime. Our team of experts is always available to provide technical support and guidance, ensuring optimal performance and longevity of our products. With a focus on innovation and continuous improvement, we strive to provide our clients with the best possible solutions for their industrial chain needs.

The market research and growth report includes detailed analyses of the competitive landscape of the market and information about key companies, including:

  • Anant Engineering
  • CAN AM CHAINS
  • DAIDO KOGYO Co. Ltd.
  • Diamond Drives
  • EMCO Engineering
  • ESBEE MACHINERY Pvt Ltd.
  • Hangzhou Donghua Chain Group Co Ltd
  • MAXCO Chain Ltd.
  • Ming Chang Chain
  • Regal Rexnord Corp.
  • Regina Catene Calibrate Spa
  • Renold Plc
  • Rolcon Engineering Co Ltd.
  • ROLLERCHAIN
  • Sugiyama Chain Co. Ltd.
  • Tripcon Engineering Pvt Ltd
  • Webster Industries Inc.
  • Wippermann junior GmbH

Qualitative and quantitative analysis of companies has been conducted to help clients understand the wider business environment as well as the strengths and weaknesses of key market players. Data is qualitatively analyzed to categorize companies as pure play, category-focused, industry-focused, and diversified; it is quantitatively analyzed to categorize companies as dominant, leading, strong, tentative, and weak.

Research Analyst Overview

The market encompasses various industries, including mining, agricultural equipment, construction, consumer goods, and more. A key component of this market is the production and distribution of power transmission systems, such as chain drives, roller chains, and leaf chains. These systems are essential for industries that require heavy material handling, including manufacturing, transportation, and logistics. Upstream in the industrial chain, raw materials are sourced at a low cost to produce cost-efficient materials. Midstream, these materials are transformed into semi-finished products, which are then used to manufacture finished products in the downstream sector. Industries like food and beverage, electronics, and automotive rely on material handling systems, conveyors belt, sorting systems, and automation to produce and distribute their goods.

Outdated machinery and inefficient power transmission systems can hinder the productivity and profitability of industrial operations. Therefore, there is a growing trend towards the adoption of advanced power transmission systems, such as electric drives, hydraulic systems, and direct drive systems. Additionally, the increasing popularity of electric vehicles (EVs) in industries like transportation and logistics is driving demand for roller chains and leaf chains in the market. Industrial automation and supply chain management are also critical aspects of the market. Efficient supply chain management ensures that raw materials are delivered on time and at the right place, while industrial automation improves productivity and reduces labor costs. Double-pitch chains are commonly used in industrial automation applications due to their high load capacity and durability. In summary, the market is a complex network of industries and processes that rely on each other to produce and distribute finished products. Power transmission systems, material handling tools, and automation are essential components of this market, and the trend towards cost-efficient materials and advanced technologies is driving innovation and growth.

Industrial Chain Market Scope

Report Coverage

Details

Page number

208

Base year

2024

Historic period

2019-2023

Forecast period

2025-2029

Growth momentum & CAGR

Accelerate at a CAGR of 4.4%

Market growth 2025-2029

USD 970 million

Market structure

Fragmented

YoY growth 2024-2025(%)

3.0

Key countries

China, US, Germany, India, Canada, Japan, UK, France, South Korea, and Italy

Competitive landscape

Leading Companies, Market Positioning of Companies, Competitive Strategies, and Industry Risks

Request Free Sample

What are the Key Data Covered in this Market Research and Growth Report?

  • CAGR of the market during the forecast period
  • Detailed information on factors that will drive the market growth and forecasting between 2025 and 2029
  • Precise estimation of the size of the market  and its contribution of the market in focus to the parent market
  • Accurate predictions about upcoming market growth and trends and changes in consumer behaviour
  • Growth of the market across APAC, North America, Europe, South America, and Middle East and Africa
  • Thorough analysis of the market's competitive landscape and detailed information about companies
  • Comprehensive analysis of factors that will challenge the growth of market companies

We can help! Our analysts can customize this market research report to meet your requirements. Get in touch

1 Executive Summary

  • 1.1 Market overview
    • Executive Summary - Chart on Market Overview
    • Executive Summary - Data Table on Market Overview
    • Executive Summary - Chart on Global Market Characteristics
    • Executive Summary - Chart on Market by Geography
    • Executive Summary - Chart on Market Segmentation by Type
    • Executive Summary - Chart on Market Segmentation by End-user
    • Executive Summary - Chart on Incremental Growth
    • Executive Summary - Data Table on Incremental Growth
    • Executive Summary - Chart on Company Market Positioning

2 Technavio Analysis

  • 2.1 Analysis of price sensitivity, lifecycle, customer purchase basket, adoption rates, and purchase criteria
    • Analysis of price sensitivity, lifecycle, customer purchase basket, adoption rates, and purchase criteria
  • 2.2 Criticality of inputs and Factors of differentiation
    • Overview on criticality of inputs and factors of differentiation
  • 2.3 Factors of disruption
    • Overview on factors of disruption
  • 2.4 Impact of drivers and challenges
    • Impact of drivers and challenges in 2024 and 2029

3 Market Landscape

  • 3.1 Market ecosystem
    • Parent Market
    • Data Table on - Parent Market
  • 3.2 Market characteristics
    • Market characteristics analysis
  • 3.3 Value chain analysis
    • Value chain analysis

4 Market Sizing

  • 4.1 Market definition
    • Offerings of companies included in the market definition
  • 4.2 Market segment analysis
    • Market segments
  • 4.3 Market size 2024
    • 4.4 Market outlook: Forecast for 2024-2029
      • Chart on Global - Market size and forecast 2024-2029 ($ million)
      • Data Table on Global - Market size and forecast 2024-2029 ($ million)
      • Chart on Global Market: Year-over-year growth 2024-2029 (%)
      • Data Table on Global Market: Year-over-year growth 2024-2029 (%)

    5 Historic Market Size

    • 5.1 Global Industrial Chain Market 2019 - 2023
      • Historic Market Size - Data Table on Global Industrial Chain Market 2019 - 2023 ($ million)
    • 5.2 Type segment analysis 2019 - 2023
      • Historic Market Size - Type Segment 2019 - 2023 ($ million)
    • 5.3 End-user segment analysis 2019 - 2023
      • Historic Market Size - End-user Segment 2019 - 2023 ($ million)
    • 5.4 Geography segment analysis 2019 - 2023
      • Historic Market Size - Geography Segment 2019 - 2023 ($ million)
    • 5.5 Country segment analysis 2019 - 2023
      • Historic Market Size - Country Segment 2019 - 2023 ($ million)

    6 Qualitative Analysis

    • 6.1 Impact of AI on the Global Industrial Chain Market

      7 Five Forces Analysis

      • 7.1 Five forces summary
        • Five forces analysis - Comparison between 2024 and 2029
      • 7.2 Bargaining power of buyers
        • Bargaining power of buyers - Impact of key factors 2024 and 2029
      • 7.3 Bargaining power of suppliers
        • Bargaining power of suppliers - Impact of key factors in 2024 and 2029
      • 7.4 Threat of new entrants
        • Threat of new entrants - Impact of key factors in 2024 and 2029
      • 7.5 Threat of substitutes
        • Threat of substitutes - Impact of key factors in 2024 and 2029
      • 7.6 Threat of rivalry
        • Threat of rivalry - Impact of key factors in 2024 and 2029
      • 7.7 Market condition
        • Chart on Market condition - Five forces 2024 and 2029

      8 Market Segmentation by Type

      • 8.1 Market segments
        • Chart on Type - Market share 2024-2029 (%)
        • Data Table on Type - Market share 2024-2029 (%)
      • 8.2 Comparison by Type
        • Chart on Comparison by Type
        • Data Table on Comparison by Type
      • 8.3 Roller chains - Market size and forecast 2024-2029
        • Chart on Roller chains - Market size and forecast 2024-2029 ($ million)
        • Data Table on Roller chains - Market size and forecast 2024-2029 ($ million)
        • Chart on Roller chains - Year-over-year growth 2024-2029 (%)
        • Data Table on Roller chains - Year-over-year growth 2024-2029 (%)
      • 8.4 Leaf chains - Market size and forecast 2024-2029
        • Chart on Leaf chains - Market size and forecast 2024-2029 ($ million)
        • Data Table on Leaf chains - Market size and forecast 2024-2029 ($ million)
        • Chart on Leaf chains - Year-over-year growth 2024-2029 (%)
        • Data Table on Leaf chains - Year-over-year growth 2024-2029 (%)
      • 8.5 Others - Market size and forecast 2024-2029
        • Chart on Others - Market size and forecast 2024-2029 ($ million)
        • Data Table on Others - Market size and forecast 2024-2029 ($ million)
        • Chart on Others - Year-over-year growth 2024-2029 (%)
        • Data Table on Others - Year-over-year growth 2024-2029 (%)
      • 8.6 Market opportunity by Type
        • Market opportunity by Type ($ million)
        • Data Table on Market opportunity by Type ($ million)

      9 Market Segmentation by End-user

      • 9.1 Market segments
        • Chart on End-user - Market share 2024-2029 (%)
        • Data Table on End-user - Market share 2024-2029 (%)
      • 9.2 Comparison by End-user
        • Chart on Comparison by End-user
        • Data Table on Comparison by End-user
      • 9.3 Automotive - Market size and forecast 2024-2029
        • Chart on Automotive - Market size and forecast 2024-2029 ($ million)
        • Data Table on Automotive - Market size and forecast 2024-2029 ($ million)
        • Chart on Automotive - Year-over-year growth 2024-2029 (%)
        • Data Table on Automotive - Year-over-year growth 2024-2029 (%)
      • 9.4 Food and beverage - Market size and forecast 2024-2029
        • Chart on Food and beverage - Market size and forecast 2024-2029 ($ million)
        • Data Table on Food and beverage - Market size and forecast 2024-2029 ($ million)
        • Chart on Food and beverage - Year-over-year growth 2024-2029 (%)
        • Data Table on Food and beverage - Year-over-year growth 2024-2029 (%)
      • 9.5 Agriculture - Market size and forecast 2024-2029
        • Chart on Agriculture - Market size and forecast 2024-2029 ($ million)
        • Data Table on Agriculture - Market size and forecast 2024-2029 ($ million)
        • Chart on Agriculture - Year-over-year growth 2024-2029 (%)
        • Data Table on Agriculture - Year-over-year growth 2024-2029 (%)
      • 9.6 Mining and construction - Market size and forecast 2024-2029
        • Chart on Mining and construction - Market size and forecast 2024-2029 ($ million)
        • Data Table on Mining and construction - Market size and forecast 2024-2029 ($ million)
        • Chart on Mining and construction - Year-over-year growth 2024-2029 (%)
        • Data Table on Mining and construction - Year-over-year growth 2024-2029 (%)
      • 9.7 Oil and gas - Market size and forecast 2024-2029
        • Chart on Oil and gas - Market size and forecast 2024-2029 ($ million)
        • Data Table on Oil and gas - Market size and forecast 2024-2029 ($ million)
        • Chart on Oil and gas - Year-over-year growth 2024-2029 (%)
        • Data Table on Oil and gas - Year-over-year growth 2024-2029 (%)
      • 9.8 Market opportunity by End-user
        • Market opportunity by End-user ($ million)
        • Data Table on Market opportunity by End-user ($ million)

      10 Customer Landscape

      • 10.1 Customer landscape overview
        • Analysis of price sensitivity, lifecycle, customer purchase basket, adoption rates, and purchase criteria

      11 Geographic Landscape

      • 11.1 Geographic segmentation
        • Chart on Market share by geography 2024-2029 (%)
        • Data Table on Market share by geography 2024-2029 (%)
      • 11.2 Geographic comparison
        • Chart on Geographic comparison
        • Data Table on Geographic comparison
      • 11.3 APAC - Market size and forecast 2024-2029
        • Chart on APAC - Market size and forecast 2024-2029 ($ million)
        • Data Table on APAC - Market size and forecast 2024-2029 ($ million)
        • Chart on APAC - Year-over-year growth 2024-2029 (%)
        • Data Table on APAC - Year-over-year growth 2024-2029 (%)
      • 11.4 North America - Market size and forecast 2024-2029
        • Chart on North America - Market size and forecast 2024-2029 ($ million)
        • Data Table on North America - Market size and forecast 2024-2029 ($ million)
        • Chart on North America - Year-over-year growth 2024-2029 (%)
        • Data Table on North America - Year-over-year growth 2024-2029 (%)
      • 11.5 Europe - Market size and forecast 2024-2029
        • Chart on Europe - Market size and forecast 2024-2029 ($ million)
        • Data Table on Europe - Market size and forecast 2024-2029 ($ million)
        • Chart on Europe - Year-over-year growth 2024-2029 (%)
        • Data Table on Europe - Year-over-year growth 2024-2029 (%)
      • 11.6 South America - Market size and forecast 2024-2029
        • Chart on South America - Market size and forecast 2024-2029 ($ million)
        • Data Table on South America - Market size and forecast 2024-2029 ($ million)
        • Chart on South America - Year-over-year growth 2024-2029 (%)
        • Data Table on South America - Year-over-year growth 2024-2029 (%)
      • 11.7 Middle East and Africa - Market size and forecast 2024-2029
        • Chart on Middle East and Africa - Market size and forecast 2024-2029 ($ million)
        • Data Table on Middle East and Africa - Market size and forecast 2024-2029 ($ million)
        • Chart on Middle East and Africa - Year-over-year growth 2024-2029 (%)
        • Data Table on Middle East and Africa - Year-over-year growth 2024-2029 (%)
      • 11.8 China - Market size and forecast 2024-2029
        • Chart on China - Market size and forecast 2024-2029 ($ million)
        • Data Table on China - Market size and forecast 2024-2029 ($ million)
        • Chart on China - Year-over-year growth 2024-2029 (%)
        • Data Table on China - Year-over-year growth 2024-2029 (%)
      • 11.9 US - Market size and forecast 2024-2029
        • Chart on US - Market size and forecast 2024-2029 ($ million)
        • Data Table on US - Market size and forecast 2024-2029 ($ million)
        • Chart on US - Year-over-year growth 2024-2029 (%)
        • Data Table on US - Year-over-year growth 2024-2029 (%)
      • 11.10 Germany - Market size and forecast 2024-2029
        • Chart on Germany - Market size and forecast 2024-2029 ($ million)
        • Data Table on Germany - Market size and forecast 2024-2029 ($ million)
        • Chart on Germany - Year-over-year growth 2024-2029 (%)
        • Data Table on Germany - Year-over-year growth 2024-2029 (%)
      • 11.11 India - Market size and forecast 2024-2029
        • Chart on India - Market size and forecast 2024-2029 ($ million)
        • Data Table on India - Market size and forecast 2024-2029 ($ million)
        • Chart on India - Year-over-year growth 2024-2029 (%)
        • Data Table on India - Year-over-year growth 2024-2029 (%)
      • 11.12 Canada - Market size and forecast 2024-2029
        • Chart on Canada - Market size and forecast 2024-2029 ($ million)
        • Data Table on Canada - Market size and forecast 2024-2029 ($ million)
        • Chart on Canada - Year-over-year growth 2024-2029 (%)
        • Data Table on Canada - Year-over-year growth 2024-2029 (%)
      • 11.13 Japan - Market size and forecast 2024-2029
        • Chart on Japan - Market size and forecast 2024-2029 ($ million)
        • Data Table on Japan - Market size and forecast 2024-2029 ($ million)
        • Chart on Japan - Year-over-year growth 2024-2029 (%)
        • Data Table on Japan - Year-over-year growth 2024-2029 (%)
      • 11.14 UK - Market size and forecast 2024-2029
        • Chart on UK - Market size and forecast 2024-2029 ($ million)
        • Data Table on UK - Market size and forecast 2024-2029 ($ million)
        • Chart on UK - Year-over-year growth 2024-2029 (%)
        • Data Table on UK - Year-over-year growth 2024-2029 (%)
      • 11.15 France - Market size and forecast 2024-2029
        • Chart on France - Market size and forecast 2024-2029 ($ million)
        • Data Table on France - Market size and forecast 2024-2029 ($ million)
        • Chart on France - Year-over-year growth 2024-2029 (%)
        • Data Table on France - Year-over-year growth 2024-2029 (%)
      • 11.16 South Korea - Market size and forecast 2024-2029
        • Chart on South Korea - Market size and forecast 2024-2029 ($ million)
        • Data Table on South Korea - Market size and forecast 2024-2029 ($ million)
        • Chart on South Korea - Year-over-year growth 2024-2029 (%)
        • Data Table on South Korea - Year-over-year growth 2024-2029 (%)
      • 11.17 Italy - Market size and forecast 2024-2029
        • Chart on Italy - Market size and forecast 2024-2029 ($ million)
        • Data Table on Italy - Market size and forecast 2024-2029 ($ million)
        • Chart on Italy - Year-over-year growth 2024-2029 (%)
        • Data Table on Italy - Year-over-year growth 2024-2029 (%)
      • 11.18 Market opportunity by geography
        • Market opportunity by geography ($ million)
        • Data Tables on Market opportunity by geography ($ million)

      12 Drivers, Challenges, and Opportunity/Restraints

      • 12.1 Market drivers
        • 12.2 Market challenges
          • 12.3 Impact of drivers and challenges
            • Impact of drivers and challenges in 2024 and 2029
          • 12.4 Market opportunities/restraints

            13 Competitive Landscape

            • 13.1 Overview
              • 13.2 Competitive Landscape
                • Overview on criticality of inputs and factors of differentiation
              • 13.3 Landscape disruption
                • Overview on factors of disruption
              • 13.4 Industry risks
                • Impact of key risks on business

              14 Competitive Analysis

              • 14.1 Companies profiled
                • Companies covered
              • 14.2 Company ranking index
                • Company ranking index
              • 14.3 Market positioning of companies
                • Matrix on companies position and classification
              • 14.4 Anant Engineering
                • Anant Engineering - Overview
                • Anant Engineering - Product / Service
                • Anant Engineering - Key offerings
                • SWOT
              • 14.5 CAN AM CHAINS
                • CAN AM CHAINS - Overview
                • CAN AM CHAINS - Product / Service
                • CAN AM CHAINS - Key offerings
                • SWOT
              • 14.6 DAIDO KOGYO Co. Ltd.
                • DAIDO KOGYO Co. Ltd. - Overview
                • DAIDO KOGYO Co. Ltd. - Product / Service
                • DAIDO KOGYO Co. Ltd. - Key offerings
                • SWOT
              • 14.7 Diamond Drives
                • Diamond Drives - Overview
                • Diamond Drives - Product / Service
                • Diamond Drives - Key offerings
                • SWOT
              • 14.8 Hangzhou Donghua Chain Group Co Ltd
                • Hangzhou Donghua Chain Group Co Ltd - Overview
                • Hangzhou Donghua Chain Group Co Ltd - Product / Service
                • Hangzhou Donghua Chain Group Co Ltd - Key offerings
                • SWOT
              • 14.9 MAXCO Chain Ltd.
                • MAXCO Chain Ltd. - Overview
                • MAXCO Chain Ltd. - Product / Service
                • MAXCO Chain Ltd. - Key offerings
                • SWOT
              • 14.10 Ming Chang Chain
                • Ming Chang Chain - Overview
                • Ming Chang Chain - Product / Service
                • Ming Chang Chain - Key offerings
                • SWOT
              • 14.11 Regal Rexnord Corp.
                • Regal Rexnord Corp. - Overview
                • Regal Rexnord Corp. - Business segments
                • Regal Rexnord Corp. - Key offerings
                • Regal Rexnord Corp. - Segment focus
                • SWOT
              • 14.12 Regina Catene Calibrate Spa
                • Regina Catene Calibrate Spa - Overview
                • Regina Catene Calibrate Spa - Product / Service
                • Regina Catene Calibrate Spa - Key offerings
                • SWOT
              • 14.13 Renold Plc
                • Renold Plc - Overview
                • Renold Plc - Business segments
                • Renold Plc - Key offerings
                • Renold Plc - Segment focus
                • SWOT
              • 14.14 Rolcon Engineering Co Ltd.
                • Rolcon Engineering Co Ltd. - Overview
                • Rolcon Engineering Co Ltd. - Product / Service
                • Rolcon Engineering Co Ltd. - Key offerings
                • SWOT
              • 14.15 Sugiyama Chain Co. Ltd.
                • Sugiyama Chain Co. Ltd. - Overview
                • Sugiyama Chain Co. Ltd. - Product / Service
                • Sugiyama Chain Co. Ltd. - Key offerings
                • SWOT
              • 14.16 Tripcon Engineering Pvt Ltd
                • Tripcon Engineering Pvt Ltd - Overview
                • Tripcon Engineering Pvt Ltd - Product / Service
                • Tripcon Engineering Pvt Ltd - Key offerings
                • SWOT
              • 14.17 Webster Industries Inc.
                • Webster Industries Inc. - Overview
                • Webster Industries Inc. - Product / Service
                • Webster Industries Inc. - Key offerings
                • SWOT
              • 14.18 Wippermann junior GmbH
                • Wippermann junior GmbH - Overview
                • Wippermann junior GmbH - Product / Service
                • Wippermann junior GmbH - Key offerings
                • SWOT

              15 Appendix

              • 15.1 Scope of the report
                • 15.2 Inclusions and exclusions checklist
                  • Inclusions checklist
                  • Exclusions checklist
                • 15.3 Currency conversion rates for US$
                  • Currency conversion rates for US$
                • 15.4 Research methodology
                  • Research methodology
                • 15.5 Data procurement
                  • Information sources
                • 15.6 Data validation
                  • Data validation
                • 15.7 Validation techniques employed for market sizing
                  • Validation techniques employed for market sizing
                • 15.8 Data synthesis
                  • Data synthesis
                • 15.9 360 degree market analysis
                  • 360 degree market analysis
                • 15.10 List of abbreviations
                  • List of abbreviations

                Research Methodology

                Technavio presents a detailed picture of the market by way of study, synthesis, and summation of data from multiple sources. The analysts have presented the various facets of the market with a particular focus on identifying the key industry influencers. The data thus presented is comprehensive, reliable, and the result of extensive research, both primary and secondary.

                INFORMATION SOURCES

                Primary sources

                • Manufacturers and suppliers
                • Channel partners
                • Industry experts
                • Strategic decision makers

                Secondary sources

                • Industry journals and periodicals
                • Government data
                • Financial reports of key industry players
                • Historical data
                • Press releases

                DATA ANALYSIS

                Data Synthesis

                • Collation of data
                • Estimation of key figures
                • Analysis of derived insights

                Data Validation

                • Triangulation with data models
                • Reference against proprietary databases
                • Corroboration with industry experts

                REPORT WRITING

                Qualitative

                • Market drivers
                • Market challenges
                • Market trends
                • Five forces analysis

                Quantitative

                • Market size and forecast
                • Market segmentation
                • Geographical insights
                • Competitive landscape

                Interested in this report?

                Get your sample now to see our research methodology and insights!

                Download Now

                Frequently Asked Questions

                Industrial Chain market growth will increase by $ 970 mn during 2025-2029.

                The Industrial Chain market is expected to grow at a CAGR of 4.4% during 2025-2029.

                Industrial Chain market is segmented by Type( Roller chains, Leaf chains, Others) End-user( Automotive, Food and beverage, Agriculture, Mining and construction, Oil and gas)

                Anant Engineering, CAN AM CHAINS, DAIDO KOGYO Co. Ltd., Diamond Drives, EMCO Engineering, ESBEE MACHINERY Pvt Ltd., Hangzhou Donghua Chain Group Co Ltd, MAXCO Chain Ltd., Ming Chang Chain, Regal Rexnord Corp., Regina Catene Calibrate Spa, Renold Plc, Rolcon Engineering Co Ltd., ROLLERCHAIN, Sugiyama Chain Co. Ltd., Tripcon Engineering Pvt Ltd, Webster Industries Inc., Wippermann junior GmbH are a few of the key vendors in the Industrial Chain market.

                APAC will register the highest growth rate of 57% among the other regions. Therefore, the Industrial Chain market in APAC is expected to garner significant business opportunities for the vendors during the forecast period.

                China, US, Germany, India, Canada, Japan, UK, France, South Korea, Italy

                • Rising industrialization and urbanizationThe global industrial chain market is significantly driven by rising industrialization and urbanization. In 2023 is the driving factor this market.
                • approximately 56% of the worlds population is the driving factor this market.
                • or 4.4 billion people is the driving factor this market.
                • resided in urban areas. This trend is projected to continue is the driving factor this market.
                • with the urban population expected to more than double by 2050 is the driving factor this market.
                • at which point nearly 70% of people will live in cities. This rapid urbanization fuels the demand for industrial chains is the driving factor this market.
                • as cities require extensive infrastructure development and efficient manufacturing processes to support growing populations.In the United States is the driving factor this market.
                • manufacturing contributed $2.3 trillion to the GDP in 2023 is the driving factor this market.
                • accounting for 10.2% of the total GDP. This substantial contribution underscores the importance of industrial chains in supporting manufacturing activities is the driving factor this market.
                • from production lines to logistics and transportation systems. The need for reliable and efficient industrial chains is critical to maintaining high productivity levels and ensuring smooth operations across various manufacturing sectors.Chinas industrial output saw a notable increase of 6.1% in the first quarter of 2024 is the driving factor this market.
                • with the manufacturing sector growing by 6.7%. The high-tech manufacturing sector experienced an even more significant rise of 7.5% is the driving factor this market.
                • reflecting the countrys focus on advanced manufacturing technologies. Major industrial enterprises in China earned profits totaling approximately $128.7 billion in the first two months of 2024 is the driving factor this market.
                • marking a 10.2% year-on-year increase. This growth highlights the essential role of industrial chains in supporting Chinas expanding industrial activities and technological advancements.Indias industrial sector also demonstrated robust growth is the driving factor this market.
                • with a 9.5% increase in 2023-24. Manufacturing led this growth is the driving factor this market.
                • achieving an average annual increase of 5.2% over the past decade. In FY23 is the driving factor this market.
                • manufacturing contributed 14.3% to gross value added and accounted for 35.2% of total output is the driving factor this market.
                • emphasizing its strong linkages across the economy. The demand for industrial chains in India is driven by the need to support diverse manufacturing processes and ensure efficient production and distribution systems.As cities expand and industrial activities grow is the driving factor this market.
                • the demand for high-quality is the driving factor this market.
                • durable industrial chains will continue to increase is the driving factor this market.
                • driving further innovation and development in the market. is the driving factor this market.

                The Industrial Chain market vendors should focus on grabbing business opportunities from the Roller chains segment as it accounted for the largest market share in the base year.