Industrial Communication Market Size 2024-2028
The industrial communication market size is forecast to increase by USD 81.2 billion at a CAGR of 11.01% between 2023 and 2028.
- The rising adoption of Industrial Internet of Things (IIoT) technology is the key driver of the industrial communication market, as industries increasingly leverage connected devices and smart sensors to improve automation, efficiency, and data-driven decision-making. This growing reliance on IIoT is pushing the demand for robust communication solutions.
- An emerging trend in the market is the integration of fieldbus technology with IIoT systems. This integration enables better communication and data exchange between industrial devices and IIoT platforms, facilitating real-time monitoring, improved asset management, and more efficient operations. As this trend develops, it will further enhance the scalability and performance of industrial communication networks.
- The trend towards smart factories and digital transformation is leading to the increased use of artificial intelligence, cloud computing, and software solutions to support industrial communication.
What will be the Size of the Industrial Communication Market during the Forecast Period?
- The market encompasses the technologies and solutions enabling seamless data exchange between various industrial equipment and processes. This market experiences significant growth due to the increasing demand for improved efficiency and reduced human intervention in industrial operations. Standardization of interfaces, protocols, and communication technologies plays a crucial role in facilitating interoperability among diverse industrial equipment. Key trends include the adoption of wireless networks, such as Bluetooth Smart, WirelessHART, WLAN, Zigbee, and cellular technologies, for enhancing connectivity and flexibility. Industrial equipment manufacturers are integrating plug-and-play features and advanced protocols like IEEE 802 and Hart Communication to ensure reliable data transfer.
- Data misrepresentation and security concerns continue to be addressed through the implementation of robust encryption and authentication methods. Additionally, the market witnesses the integration of various technologies to mitigate challenges posed by high voltage transients, electromagnetic protection, shock and vibration, and harsh environmental conditions. Networking wires and device housings are engineered to withstand industrial conditions and ensure data integrity. The oil & gas industry, among others, heavily relies on industrial communication systems to optimize operations and minimize downtime. The market is expected to continue expanding, driven by the need for real-time data monitoring, predictive maintenance, and automation.
How is this Industrial Communication Industry segmented and which is the largest segment?
The industrial communication industry research report provides comprehensive data (region-wise segment analysis), with forecasts and estimates in "USD billion" for the period 2024-2028, as well as historical data from 2018-2022 for the following segments.
- Product
- Fieldbus
- Industrial Ethernet
- Wireless
- Type
- Component
- Software
- Services
- End-User
- Automotive
- Electrical & Electronics
- Aerospace & Defense
- Oil & Gas
- Chemicals & Fertilizers
- Food & Beverages
- Geography
- APAC
- China
- Japan
- North America
- US
- Europe
- Germany
- UK
- South America
- Middle East and Africa
- APAC
By Product Insights
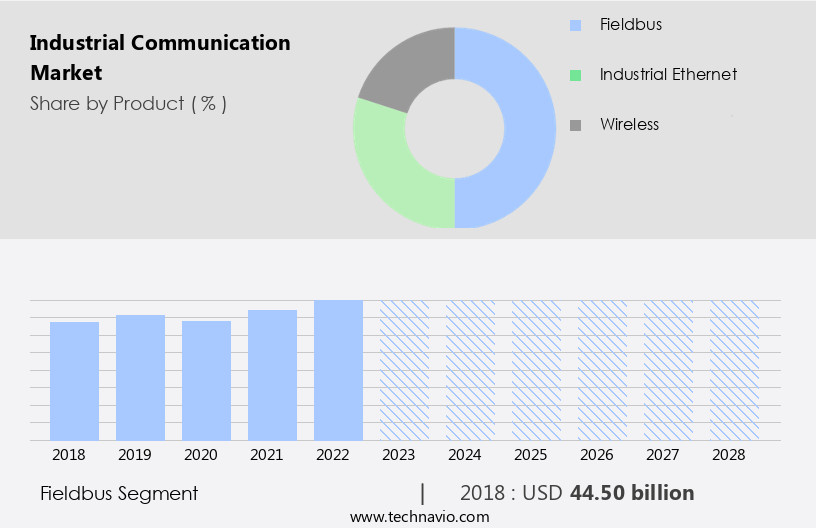
The fieldbus segment is estimated to witness significant growth during the forecast period. Industrial communication systems, such as Fieldbus, play a crucial role in connecting automation modules to process control in manufacturing plants. One notable system is PROFIBUS, which utilizes a multi-drop single cable to link devices, offering cost-efficiency on large sites due to its simplified installation and fault identification. PROFIBUS comes in two variants: PROFIBUS PA, designed for process automation with a bus power supply for field devices and intrinsic safety, and PROFIBUS DP, suitable for process control applications requiring high data rates and real-time communication. These systems enhance industrial efficiency by reducing human intervention, promoting standardization, and enabling seamless communication between various industrial equipment and interfaces.
Additionally, they incorporate advanced features like Plug-and-play, wireless networks (Bluetooth Smart, WirelessHART, WLAN, Zigbee), and various protocols (IEEE 802, HART communication, Cellular technologies) to ensure secure and reliable data transfer. Industrial communication equipment offers services like network design, maintenance contracts, and remote support to end users in industries such as Oil & gas, Pharma, and Chemical plants. Key considerations include high voltage transients, electrostatic discharge, surge, burst, and lightning strikes, as well as electromagnetic protection, shock, and vibration. Networking wires and device housings require air conditioning and heat dissipation for optimal performance.
Get a glance at the market report of various segments Request Free Sample
The Fieldbus segment was valued at USD 44.50 billion in 2018 and showed a gradual increase during the forecast period.
Regional Analysis
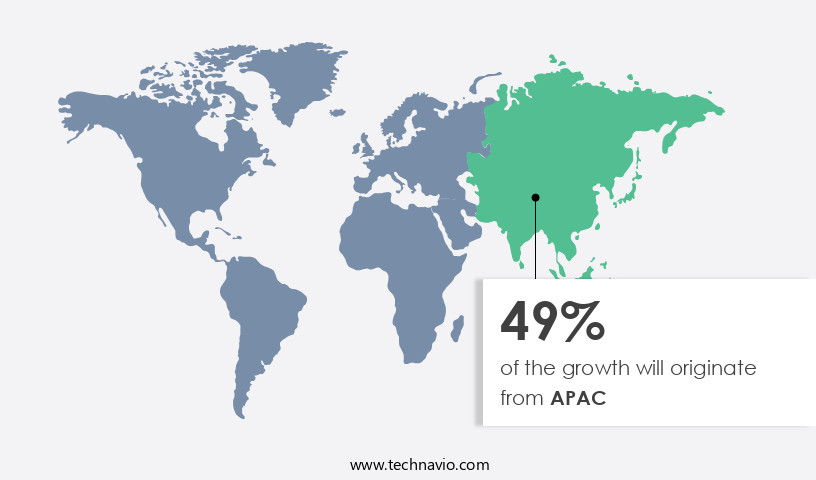
APAC is estimated to contribute 49% to the growth of the global market during the forecast period. Technavio's analysts have elaborately explained the regional trends and drivers that shape the market during the forecast period.
For more insights on the market size of various regions, Request Free Sample
The market In the Asia Pacific (APAC) region is experiencing significant growth due to the increasing automation demands from the thriving automotive industry, particularly in countries like China, Japan, India, Malaysia, and South Korea. Major investments, such as General Motors' USD14 billion commitment in China and Suzuki's USD1.38 billion investment in a new plant in India, underscore this trend. Additionally, the region's expansion in power, oil and gas, and wastewater management sectors is driving the adoption of Industrial Communication Equipment. Key technologies, including WirelessHART, Bluetooth Smart, WLAN, Zigbee, and Cellular technologies, are gaining popularity due to their efficiency, standardization, and plug-and-play features.
Industrial equipment manufacturers are integrating these technologies into their offerings to cater to end users' needs for real-time access, extended enterprise visibility, and vital manufacturing data. Network design, maintenance contracts, and support services are essential services offerings in this market. Key challenges include data misrepresentation, high voltage transients, electromagnetic protection, shock and vibration, and networking wires and device housings' susceptibility to air conditioning, heat dissipation, and harsh industrial conditions. IEEE 802 and HART communication protocols, as well as industrial switches, play a crucial role in addressing these challenges.
Market Dynamics
Our researchers analyzed the data with 2023 as the base year, along with the key drivers, trends, and challenges. A holistic analysis of drivers will help companies refine their marketing strategies to gain a competitive advantage.
What are the key market drivers leading to the rise In the adoption of market?
Rising adoption of IIoT technology is the key driver of the market. In the realm of industrial communication, the Internet of Things (IoT) and Industrial Internet of Things (IIoT) are revolutionizing process industries by enabling seamless data exchange between various devices and systems. IIoT specifically focuses on integrating industrial equipment with sensors, big data analytics, and cloud infrastructure to enhance efficiency and standardize operations. The benefits of IIoT are particularly appealing to manufacturers, who recognize the value of open networks like Ethernet over traditional dedicated automation networks. Ethernet offers increased bandwidth and interoperability, allowing for real-time access to vital manufacturing data and extended enterprise visibility. The integration of IoT and IIoT in process industries includes various devices, from human intervention-free smart devices to industrial equipment.
While smart devices such as televisions, tablets, and smartphones account for approximately 40% of these devices, the remaining are made up of industrial equipment not traditionally connected to the internet. These devices include interfaces, protocols, and sensors used in industries like oil & gas, chemical plants, and manufacturing. IIoT adoption is driven by the need for standardization and the desire to minimize human intervention. Industrial equipment manufacturers are developing plug-and-play features, making it easier for end users to integrate new devices into their networks. Wireless networks like Bluetooth Smart, WirelessHART, WLAN, Zigbee, and cellular technologies are gaining popularity due to their ease of implementation and flexibility.
What are the market trends shaping the Industrial Communication market?
Integration of fieldbus with IIoT is the upcoming market trend. The Industrial Internet of Things (IIoT) and Fieldbus integration is revolutionizing industrial communication systems in process industries. This convergence offers real-time access to device status, diagnostic alerts, process variables, and configuration parameters. It ensures efficient plant operations by continuously monitoring device performance. Integrating Fieldbus with IIoT results in significant cost savings for end-users. By utilizing various services over the Internet, the need for additional auxiliary equipment is minimized, leading to reduced Capex and Opex. Industrial equipment manufacturers are focusing on standardization, plug-and-play features, and interoperability to cater to this market trend. Wireless networks, including Bluetooth Smart, WirelessHART, WLAN, Zigbee, and cellular technologies, are gaining popularity for their ease of use and flexibility.
Industrial communication equipment must withstand harsh environments, including high voltage transients, electromagnetic protection, shock, vibration, and electrostatic discharge. Additionally, networking wires and device housings require air conditioning and heat dissipation for optimal performance. This integration of IIoT and Fieldbus is transforming industries such as oil & gas, manufacturing, chemical plants, and automation, providing extended enterprise visibility, vital manufacturing data, and supply chain integration. Services offerings, including network design, maintenance contracts, and remote support services, are essential for end-users to ensure optimal performance and reliability. Medical devices and sensing technologies are also benefiting from this advancement.
What challenges does the market face during its growth?
Lack of determinism in industrial communication networks is a key challenge affecting the industry growth.Industrial communication plays a pivotal role in process industries, particularly in ensuring efficiency and minimizing human intervention. Standardization of interfaces and protocols is crucial for seamless data transfer between industrial equipment. Determinism, the ability to ensure predictable message transmission, is vital for critical control applications in automation. In the context of industrial communication, efficiency is paramount. Delay in data transfer can significantly impact production processes, especially in industries such as oil & gas, manufacturing, and chemical plants. Wireless networks, including Bluetooth Smart, WirelessHART, WLAN, Zigbee, and cellular technologies, offer plug-and-play features, making integration easier. However, industrial communication equipment must withstand harsh environments.
Protection against high voltage transients, electrostatic discharge, and other hazards is essential. Industrial switches, with electromagnetic protection, shock and vibration resistance, and robust networking wires, ensure reliable data transfer. End users require services offerings, including network design, maintenance contracts, and remote support services, to optimize their industrial communication systems. Real-time access to vital manufacturing data enables extended enterprise visibility, supply chain integration, and improved automation. Sensing technologies, such as medical devices, also benefit from industrial communication. Network design and maintenance are critical aspects of industrial communication. IEEE 802 standards provide a framework for industrial Ethernet communication. HART communication, a popular fieldbus protocol, ensures interoperability between devices.
Exclusive Customer Landscape
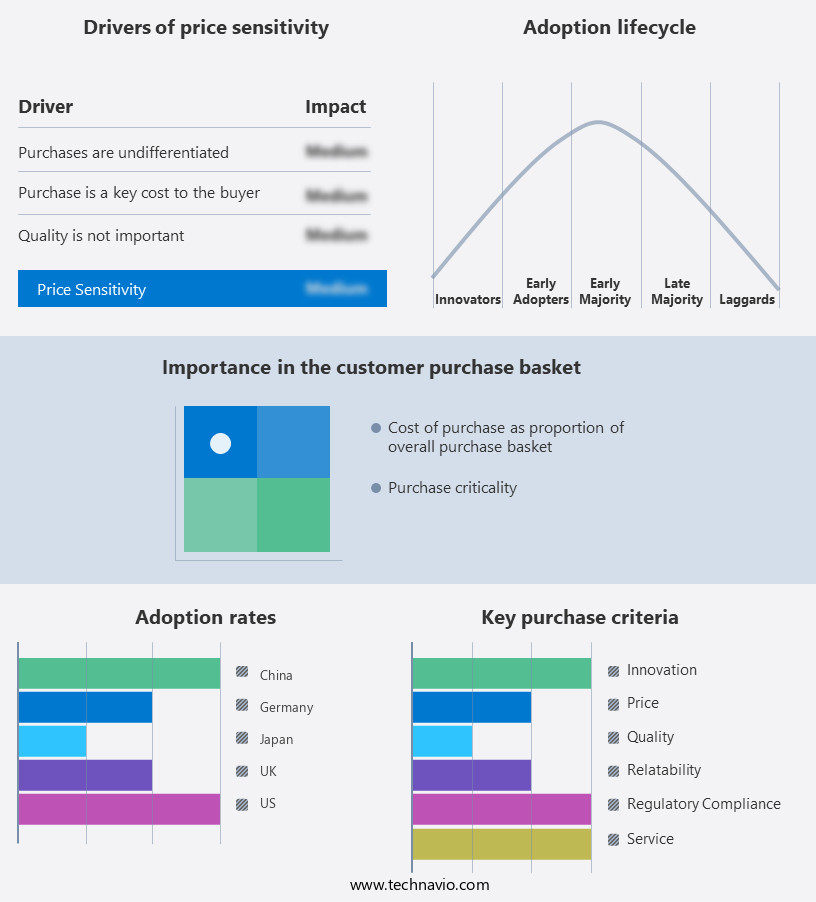
The industrial communication market forecasting report includes the adoption lifecycle of the market, covering from the innovator's stage to the laggard's stage. It focuses on adoption rates in different regions based on penetration. Furthermore, the industrial communication market report also includes key purchase criteria and drivers of price sensitivity to help companies evaluate and develop their market growth analysis strategies.
Customer Landscape
Key Companies & Market Insights
Companies are implementing various strategies, such as strategic alliances, industrial communication market forecast, partnerships, mergers and acquisitions, geographical expansion, and product/service launches, to enhance their presence In the industry.
ABB Ltd. - The market encompasses technologies and systems enabling seamless data exchange between machines, devices, and enterprises. This sector experiences continuous growth due to increasing automation and digitalization in manufacturing, energy, transportation, and other industries. Advanced technologies, such as Industrial Internet of Things (IIoT), wireless communication, and automation protocols, fuel market expansion. Additionally, the integration of artificial intelligence and machine learning enhances industrial communication systems' capabilities, improving operational efficiency and productivity.
The industry research and growth report includes detailed analyses of the competitive landscape of the market and information about key companies, including:
- ABB Ltd.
- Advantech Co. Ltd.
- ASUSTeK Computer Inc.
- Beckhoff Automation GmbH and Co. KG
- Belden Inc.
- Cisco Systems Inc.
- Emerson Electric Co.
- FANUC Corp.
- General Electric Co.
- Huawei Technologies Co., Ltd.
- ifm electronic gmbh
- Moxa Inc.
- OMRON Corp.
- Phoenix Contact GmbH and Co. KG
- Physik Instrumente GmbH and Co. KG
- Rockwell Automation Inc.
- Schneider Electric SE
- SICK AG
- Siemens AG
- Texas Instruments Inc.
Qualitative and quantitative analysis of companies has been conducted to help clients understand the wider business environment as well as the strengths and weaknesses of key industry players. Data is qualitatively analyzed to categorize companies as pure play, category-focused, industry-focused, and diversified; it is quantitatively analyzed to categorize companies as dominant, leading, strong, tentative, and weak.
Research Analyst Overview
Industrial communication plays a pivotal role in enhancing the efficiency of process industries by reducing human intervention and promoting standardization. The implementation of advanced industrial communication systems enables seamless data exchange between various industrial equipment, interfaces, and protocols. The importance of industrial communication is underscored by the increasing demand for plug-and-play features in industrial equipment. Equipment manufacturers are integrating wireless networks, such as Bluetooth Smart, WirelessHART, WLAN, Zigbee, and cellular technologies, to facilitate easy installation and integration of devices. However, the adoption of industrial communication systems also presents challenges. Data misrepresentation and security concerns are major issues that need to be addressed.
IEEE 802 and Hart Communication protocols provide guidelines for ensuring data integrity and security. Industrial communication equipment is subjected to various environmental hazards, including high voltage transients, electrostatic discharge, surge, burst, and lightning strikes. Industrial switches and networking wires require electromagnetic protection, shock and vibration resistance, and effective heat dissipation through air conditioning. Device housings and industrial communication equipment offerings also cater to the unique requirements of various industries. For instance, the oil & gas industry demands equipment that can withstand harsh operating conditions, while medical devices require stringent electromagnetic compatibility (EMC) regulations. Services offerings In the market include network design, maintenance contracts, and remote support services.
End users seek real-time access to vital manufacturing data and extended enterprise visibility for supply chain integration and optimization. Automation and sensing technologies are driving the demand for industrial communication systems in manufacturing and chemical plants. Companies such as Rockwell Automation offer comprehensive solutions for process control and plant management. In conclusion, the market is witnessing significant growth due to the increasing demand for efficient and standardized communication systems. The market dynamics are shaped by factors such as the need for data security, environmental hazards, and the integration of automation and sensing technologies.
|
Market Scope |
|
|
Report Coverage |
Details |
|
Page number |
183 |
|
Base year |
2023 |
|
Historic period |
2018-2022 |
|
Forecast period |
2024-2028 |
|
Growth momentum & CAGR |
Accelerate at a CAGR of 11.01% |
|
Market growth 2024-2028 |
USD 81.2 billion |
|
Market structure |
Fragmented |
|
YoY growth 2023-2024(%) |
9.63 |
|
Key countries |
US, China, Germany, UK, and Japan |
|
Competitive landscape |
Leading Companies, Market Positioning of Companies, Competitive Strategies, and Industry Risks |
What are the Key Data Covered in this Industrial Communication Market Research and Growth Report?
- CAGR of the Industrial Communication industry during the forecast period
- Detailed information on factors that will drive the growth and forecasting between 2024 and 2028
- Precise estimation of the size of the market and its contribution of the industry in focus to the parent market
- Accurate predictions about upcoming growth and trends and changes in consumer behaviour
- Growth of the market across APAC, North America, Europe, South America, and Middle East and Africa
- Thorough analysis of the market's competitive landscape and detailed information about companies
- Comprehensive analysis of factors that will challenge the industrial communication market growth of industry companies
We can help! Our analysts can customize this industrial communication market research report to meet your requirements.


