Industrial Internet Of Things (iot) Market Size 2026-2030
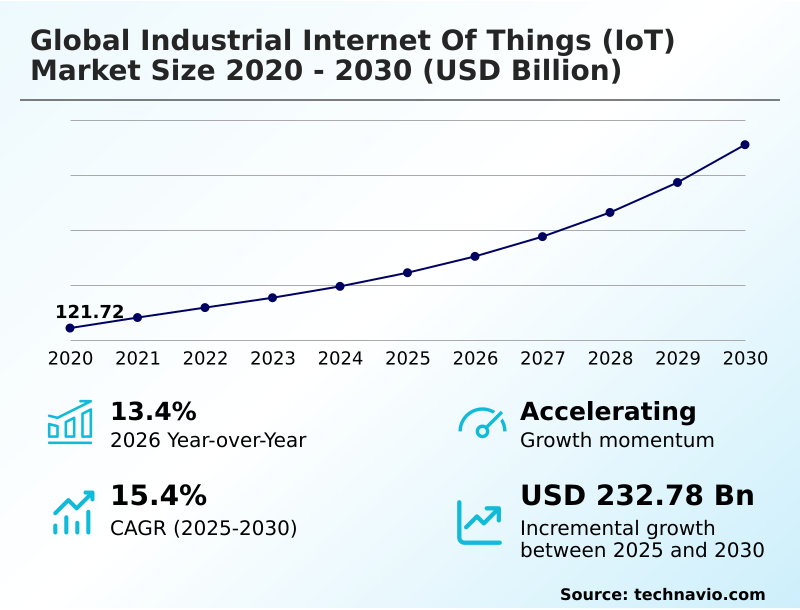
The industrial internet of things (iot) market size is valued to increase by USD 232.78 billion, at a CAGR of 15.4% from 2025 to 2030. Growth in industrial automation is augmenting market growth will drive the industrial internet of things (iot) market.
Major Market Trends & Insights
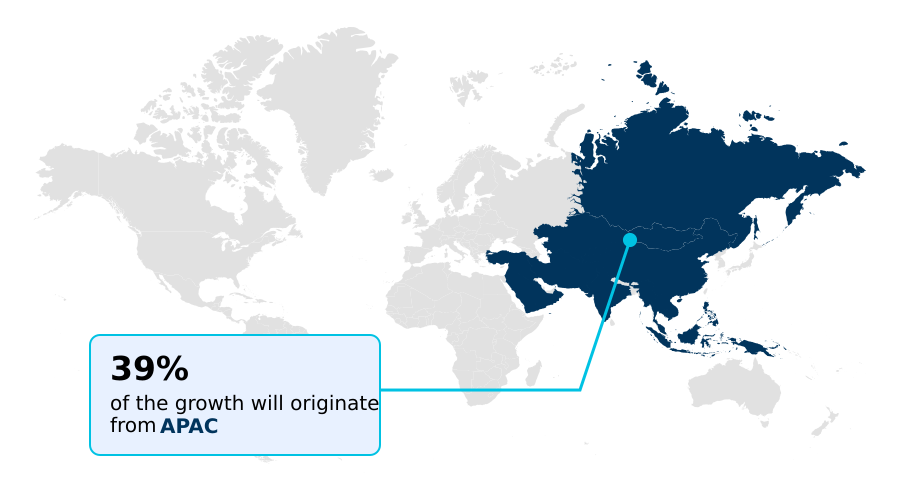
- APAC dominated the market and accounted for a 38.9% growth during the forecast period.
- By End-user - Manufacturing segment was valued at USD 54.92 billion in 2024
- By Component - Hardware segment accounted for the largest market revenue share in 2024
Market Size & Forecast
- Market Opportunities: USD 333.39 billion
- Market Future Opportunities: USD 232.78 billion
- CAGR from 2025 to 2030 : 15.4%
Market Summary
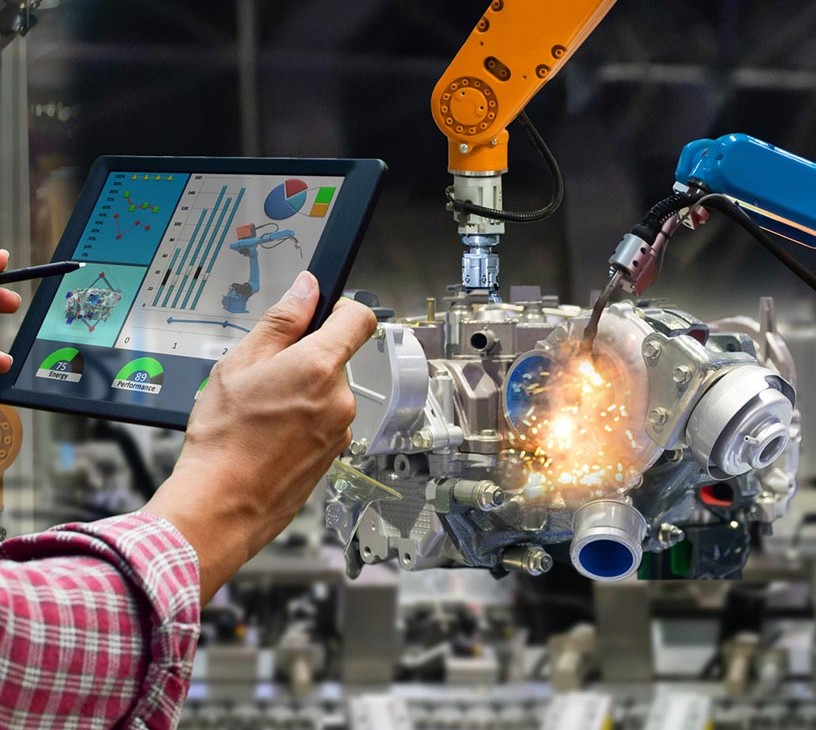
- The industrial internet of things (IoT) market is defined by the integration of connected devices and intelligent systems within industrial settings to optimize operations. This evolution is driven by the need for greater efficiency and data-driven decision-making, compelling organizations to adopt technologies like edge computing and machine learning.
- A key trend is the move toward predictive maintenance, where industrial-grade sensors and data analytics forecast equipment failures, significantly reducing downtime. For example, a logistics firm can use asset tracking and connected logistics solutions to monitor its fleet in real-time, optimizing routes and fuel consumption, which enhances supply chain visibility and cuts operational costs.
- The convergence of operational technology (OT) with IT systems, facilitated by a robust IIoT architecture and secure industrial gateway devices, is creating smarter, more resilient industrial ecosystems.
- However, challenges related to cybersecurity for industrial control systems and the complexity of IIoT integration with legacy systems persist, requiring strategic planning and investment in secure OT network segmentation and comprehensive IIoT device management.
What will be the Size of the Industrial Internet Of Things (iot) Market during the forecast period?
Get Key Insights on Market Forecast (PDF) Get Free Sample
How is the Industrial Internet Of Things (iot) Market Segmented?
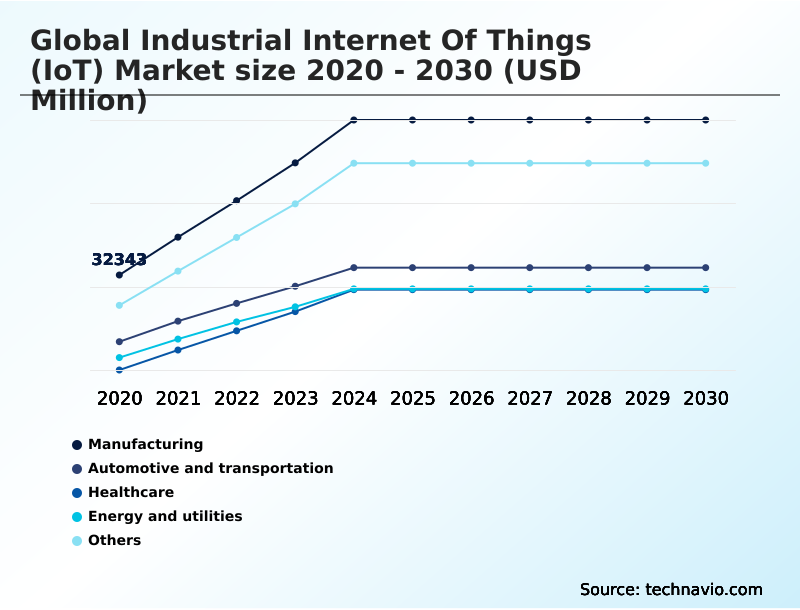
The industrial internet of things (iot) industry research report provides comprehensive data (region-wise segment analysis), with forecasts and estimates in "USD million" for the period 2026-2030, as well as historical data from 2020-2024 for the following segments.
- End-user
- Manufacturing
- Automotive and transportation
- Healthcare
- Energy and utilities
- Others
- Component
- Hardware
- Software
- Services
- Connectivity
- Wired
- Wireless
- Deployment
- On-cloud
- On-premises
- Geography
- APAC
- China
- Japan
- India
- North America
- US
- Canada
- Mexico
- Europe
- Germany
- UK
- France
- South America
- Brazil
- Argentina
- Middle East and Africa
- Saudi Arabia
- UAE
- South Africa
- Rest of World (ROW)
- APAC
By End-user Insights
The manufacturing segment is estimated to witness significant growth during the forecast period.
The manufacturing sector's adoption of industrial IoT is driven by the push toward smart factory implementation, where cyber-physical systems and industrial automation solutions converge to enhance production.
This transition involves deploying industrial-grade sensors and leveraging industrial data integration to create a fully connected industrial sensor network. As a result, firms achieve real-time data processing, which improves operational visibility from raw material intake to final output.
The use of an IoT platform enables predictive maintenance and adaptive controls, leading to a 20% reduction in unscheduled equipment downtime.
This evolution from isolated machine control to integrated digital manufacturing ecosystems, supported by industrial sensor networks, is pivotal for maintaining a competitive edge through improved asset performance management (apm) and operational resilience.
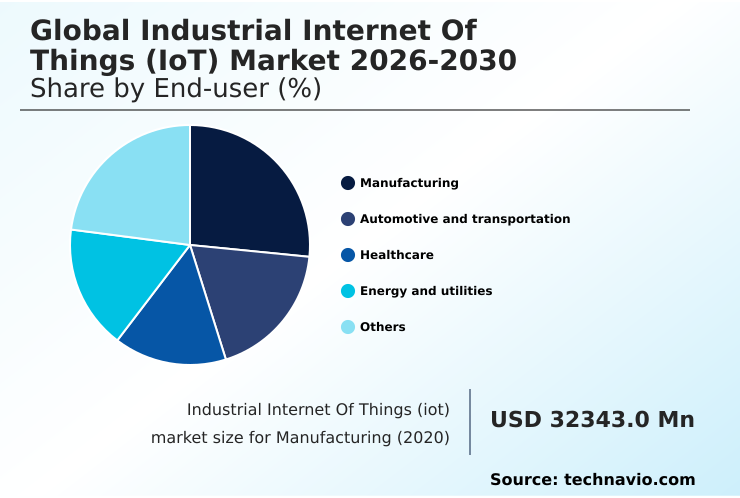
The Manufacturing segment was valued at USD 54.92 billion in 2024 and showed a gradual increase during the forecast period.
Regional Analysis
APAC is estimated to contribute 38.9% to the growth of the global market during the forecast period.Technavio’s analysts have elaborately explained the regional trends and drivers that shape the market during the forecast period.
See How Industrial Internet Of Things (iot) Market Demand is Rising in APAC Get Free Sample
The geographic landscape of the industrial internet of things (IoT) market is characterized by varied adoption rates, with APAC leading in market expansion.
The region's growth in digital manufacturing and smart factory implementation is outpacing Europe's by over 1.2% annually, driven by massive investments in industrial automation solutions.
North America remains a mature market, heavily focused on optimizing existing IIoT architecture with advanced edge analytics for manufacturing and robust IoT cybersecurity framework.
In this region, firms report a 20% higher efficiency in asset performance management (apm) compared to global averages.
Developing regions in South America and the Middle East and Africa are increasingly adopting IIoT for supply chain and connected logistics to modernize key sectors like mining and energy, though they still face challenges with infrastructure and initial investment costs for industrial data integration.
Market Dynamics
Our researchers analyzed the data with 2025 as the base year, along with the key drivers, trends, and challenges. A holistic analysis of drivers will help companies refine their marketing strategies to gain a competitive advantage.
- Strategic deployment within the industrial internet of things (IoT) market requires careful consideration of various operational models and technological pathways. For instance, the decision between edge computing vs cloud for iiot is not merely technical but strategic, impacting latency, cost, and data sovereignty. Real-time analytics in production environments often favor edge deployments for immediate response capabilities.
- The benefits of iiot in manufacturing are maximized when iiot integration with legacy systems is meticulously planned, ensuring that existing infrastructure contributes to the new data ecosystem. A key area of focus is cybersecurity for industrial control systems, as secure remote access for ot is non-negotiable.
- Deployments that combine robust iiot platform for asset tracking with blockchain for supply chain traceability have demonstrated a 30% improvement in verification efficiency over traditional methods. Furthermore, understanding the roi of iiot implementation is critical for securing executive buy-in. Models show that leveraging predictive maintenance using ml can extend asset lifespan by up to 20%.
- The 5g impact on smart factories is also transformative, enabling massive device connectivity and ultra-reliable, low-latency communication. Effective iiot device lifecycle management, guided by clear iiot protocols for industrial automation and a strategy for using digital twins for optimization, ensures long-term sustainability.
- Ultimately, success hinges on a holistic approach that includes iiot for energy consumption monitoring and addresses the iiot impact on workforce skills, potentially leading to new iiot data monetization strategies and a re-evaluation of how cloud-based scada systems benefits are measured.
What are the key market drivers leading to the rise in the adoption of Industrial Internet Of Things (iot) Industry?
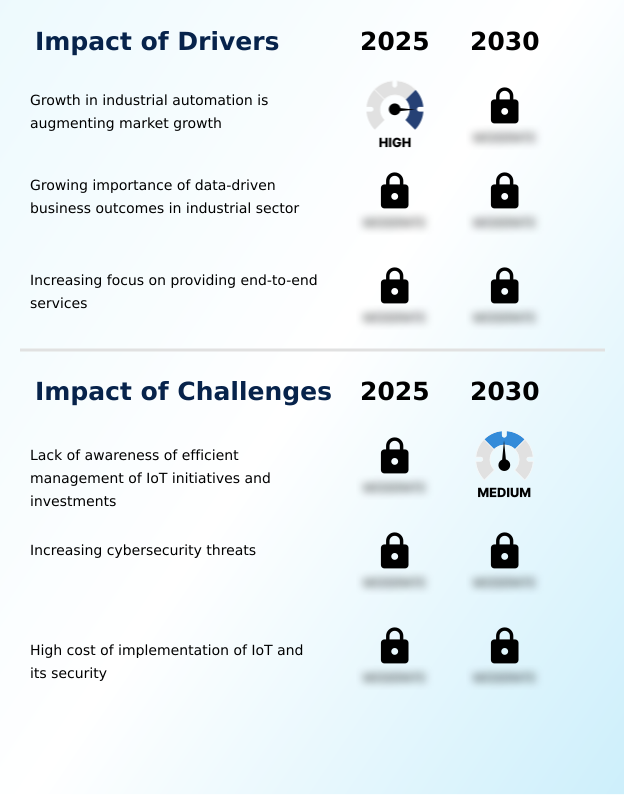
- The growth in industrial automation is a key driver augmenting the expansion of the industrial IoT market.
- Market growth is primarily driven by the expanding scope of industrial automation and the strategic imperative for data-driven outcomes.
- The adoption of full-stack industrial automation solutions, which integrate hardware like actuators with sophisticated software, is delivering a 20% average increase in operational efficiency.
- The growing importance of real-time data processing for business outcomes is another key driver, as companies that effectively leverage it improve decision accuracy by over 30%. Additionally, the increasing focus on providing IIoT-enabled services simplifies adoption for enterprises.
- This model, supported by a robust IIoT architecture and OT network segmentation, ensures scalable and secure deployments, accelerating the transition toward fully connected industrial assets and smarter manufacturing ecosystems.
What are the market trends shaping the Industrial Internet Of Things (iot) Industry?
- The increasing adoption of edge computing in industrial IoT is an emerging market trend. This shift is driven by the need for faster data processing and reduced latency in industrial applications.
- Key trends are reshaping the industrial internet of things (IoT) market, with a significant shift toward decentralized intelligence and enhanced security. The increasing adoption of edge computing and firmware-level security is critical, as it enables real-time analytics in production, with deployments showing up to a 60% reduction in data processing latency.
- Another powerful trend is the integration of blockchain and industrial data integration, which provides a tamper-proof ledger for supply chains, improving traceability and reducing disputes by over 25%. Furthermore, predictive maintenance using ML is becoming a standard, leveraging continuous data from time-sensitive networking (tsn) to forecast equipment failures with more than 90% accuracy.
- These advancements in industrial gateway technology and data acquisition are foundational to building resilient and efficient operational ecosystems.
What challenges does the Industrial Internet Of Things (iot) Industry face during its growth?
- A key challenge affecting industry growth is the lack of awareness regarding the efficient management of IoT initiatives and investments.
- Despite strong drivers, the industrial internet of things (IoT) market faces significant challenges that can impede adoption. The high cost of implementation, encompassing everything from an industrial gateway to a comprehensive IoT cybersecurity framework, can delay ROI by up to 24 months, particularly for SMEs.
- Cybersecurity remains a primary concern, as poorly secured IIoT device management or inadequate supervisory control and data acquisition (scada) protocols can increase breach risk by nearly 50%.
- Furthermore, a persistent lack of awareness regarding efficient management of IIoT initiatives and the complexities of integrating new systems like a connected worker platform with legacy industrial control systems (ics) often leads to fragmented deployments that fail to deliver enterprise-wide value and limit scalability.
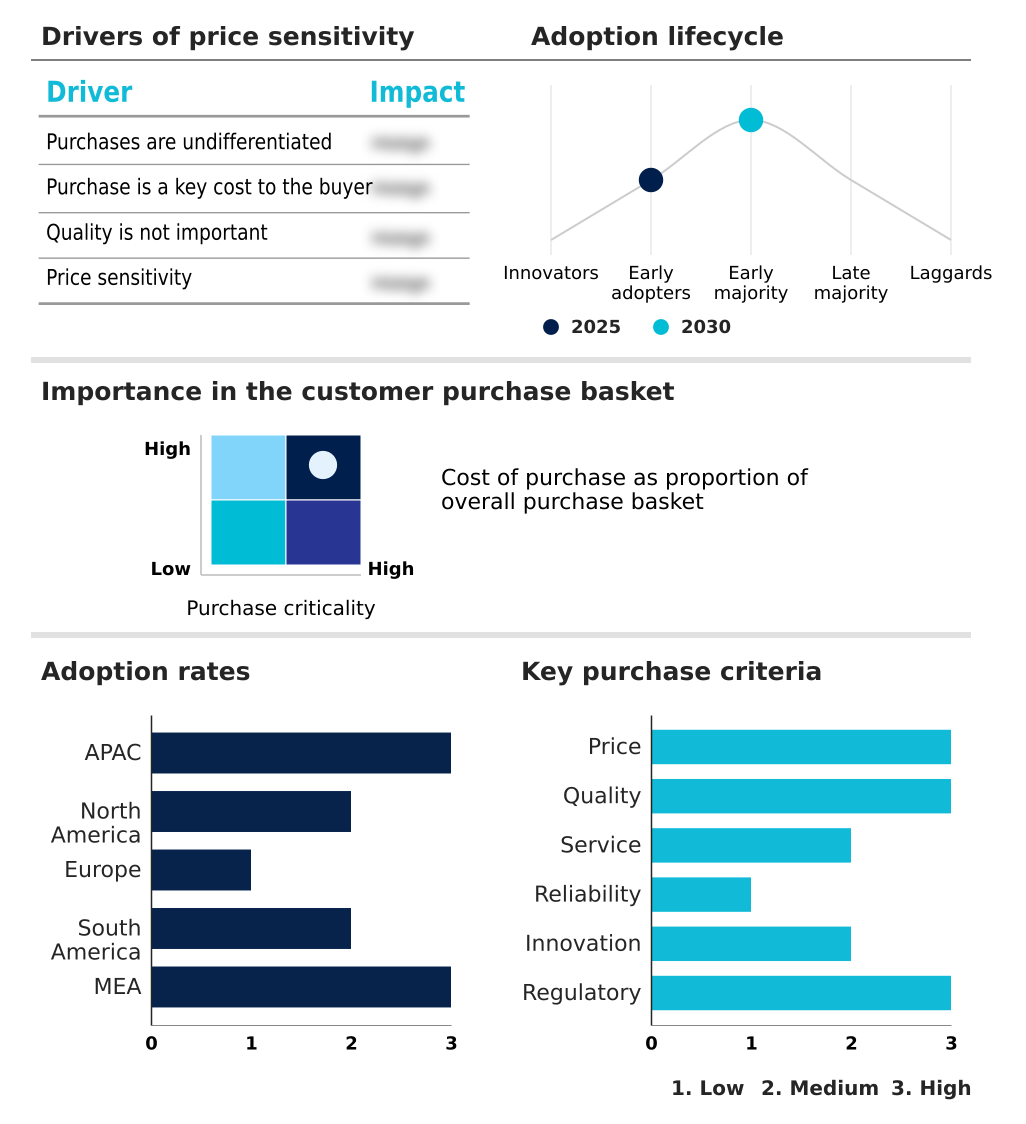
Exclusive Technavio Analysis on Customer Landscape
The industrial internet of things (iot) market forecasting report includes the adoption lifecycle of the market, covering from the innovator’s stage to the laggard’s stage. It focuses on adoption rates in different regions based on penetration. Furthermore, the industrial internet of things (iot) market report also includes key purchase criteria and drivers of price sensitivity to help companies evaluate and develop their market growth analysis strategies.
Customer Landscape of Industrial Internet Of Things (iot) Industry
Competitive Landscape
Companies are implementing various strategies, such as strategic alliances, industrial internet of things (iot) market forecast, partnerships, mergers and acquisitions, geographical expansion, and product/service launches, to enhance their presence in the industry.
ABB Ltd. - Offers IIoT platforms for connected asset monitoring and predictive maintenance, enhancing industrial automation and energy management efficiency.
The industry research and growth report includes detailed analyses of the competitive landscape of the market and information about key companies, including:
- ABB Ltd.
- Advantech Co. Ltd.
- Amazon Web Services Inc.
- Cisco Systems Inc.
- Dell Technologies Inc.
- Emerson Electric Co.
- General Electric Co.
- Hewlett Packard Enterprise Co.
- Hitachi Ltd.
- Honeywell International Inc.
- Huawei Technologies Co. Ltd.
- IBM Corp.
- Intel Corp.
- Microsoft Corp.
- Nokia Corp.
- Oracle Corp.
- PTC Inc.
- Rockwell Automation Inc.
- SAP SE
- Schneider Electric SE
- Siemens AG
- Telefonaktiebolaget Ericsson
- Yokogawa Electric Corp.
Qualitative and quantitative analysis of companies has been conducted to help clients understand the wider business environment as well as the strengths and weaknesses of key industry players. Data is qualitatively analyzed to categorize companies as pure play, category-focused, industry-focused, and diversified; it is quantitatively analyzed to categorize companies as dominant, leading, strong, tentative, and weak.
Recent Development and News in Industrial internet of things (iot) market
- In August 2025, Bosch expanded its integrated industrial IoT service portfolio, offering end-to-end solutions that include device management, cloud connectivity, analytics platforms, and lifecycle support services for manufacturing and infrastructure clients (Source: Company Press Release).
- In March 2025, Siemens AG enhanced its industrial automation portfolio with IoT-based connectivity solutions aimed at supporting smart factory initiatives and scalable digital manufacturing ecosystems across Europe and Asia (Source: Company Press Release).
- In May 2025, General Electric Co. broadened its industrial analytics and IoT integration platforms to deliver enhanced predictive insights for clients in the manufacturing and energy sectors, focusing on improving asset performance (Source: Company Press Release).
- In April 2025, Microsoft Corp. augmented its edge computing capabilities integrated with industrial IoT platforms to support real-time analytics and automation in modern manufacturing environments (Source: Company Press Release).
Dive into Technavio’s robust research methodology, blending expert interviews, extensive data synthesis, and validated models for unparalleled Industrial Internet Of Things (iot) Market insights. See full methodology.
| Market Scope | |
|---|---|
| Page number | 332 |
| Base year | 2025 |
| Historic period | 2020-2024 |
| Forecast period | 2026-2030 |
| Growth momentum & CAGR | Accelerate at a CAGR of 15.4% |
| Market growth 2026-2030 | USD 232784.4 million |
| Market structure | Fragmented |
| YoY growth 2025-2026(%) | 13.4% |
| Key countries | China, Japan, India, South Korea, Australia, Indonesia, US, Canada, Mexico, Germany, UK, France, Italy, Spain, The Netherlands, Brazil, Argentina, Chile, Saudi Arabia, UAE, South Africa, Israel and Turkey |
| Competitive landscape | Leading Companies, Market Positioning of Companies, Competitive Strategies, and Industry Risks |
Research Analyst Overview
- The industrial internet of things (IoT) market is fundamentally reshaping industrial operations by creating interconnected cyber-physical systems that drive efficiency and intelligence. The core of this transformation lies in the deployment of smart sensors and industrial gateways, which facilitate data acquisition for advanced data analytics.
- Technologies such as edge computing, machine learning, and digital twins are no longer aspirational but are becoming standard components of modern IIoT architecture. A significant trend is the convergence of IT and operational technology (OT), which necessitates a robust IoT cybersecurity framework to protect industrial control systems (ICS).
- The move toward predictive maintenance, powered by real-time data from industrial-grade sensors, is a critical value driver, with some manufacturers achieving up to a 30% reduction in unplanned downtime.
- For the boardroom, this shift requires a strategic re-evaluation of capital allocation, moving from reactive maintenance budgets to proactive investments in automation, robotics, and a secure connected worker platform to support a digitally fluent workforce.
What are the Key Data Covered in this Industrial Internet Of Things (iot) Market Research and Growth Report?
-
What is the expected growth of the Industrial Internet Of Things (iot) Market between 2026 and 2030?
-
USD 232.78 billion, at a CAGR of 15.4%
-
-
What segmentation does the market report cover?
-
The report is segmented by End-user (Manufacturing, Automotive and transportation, Healthcare, Energy and utilities, and Others), Component (Hardware, Software, and Services), Connectivity (Wired, and Wireless), Deployment (On-cloud, and On-premises) and Geography (APAC, North America, Europe, South America, Middle East and Africa)
-
-
Which regions are analyzed in the report?
-
APAC, North America, Europe, South America and Middle East and Africa
-
-
What are the key growth drivers and market challenges?
-
Growth in industrial automation is augmenting market growth, Lack of awareness of efficient management of IoT initiatives and investments
-
-
Who are the major players in the Industrial Internet Of Things (iot) Market?
-
ABB Ltd., Advantech Co. Ltd., Amazon Web Services Inc., Cisco Systems Inc., Dell Technologies Inc., Emerson Electric Co., General Electric Co., Hewlett Packard Enterprise Co., Hitachi Ltd., Honeywell International Inc., Huawei Technologies Co. Ltd., IBM Corp., Intel Corp., Microsoft Corp., Nokia Corp., Oracle Corp., PTC Inc., Rockwell Automation Inc., SAP SE, Schneider Electric SE, Siemens AG, Telefonaktiebolaget Ericsson and Yokogawa Electric Corp.
-
Market Research Insights
- The industrial internet of things (IoT) market dynamics are shaped by the strategic adoption of advanced technologies to drive operational value. Firms leveraging a cohesive IIoT architecture report a 25% improvement in asset performance management (APM) compared to legacy systems.
- The implementation of smart factory frameworks has been shown to cut unscheduled downtime by up to 40% through enhanced IIoT for supply chain visibility and connected logistics. Furthermore, a focus on digital manufacturing and IIoT-enabled services is critical, as organizations that integrate these services achieve a 15% greater return on their technology investments.
- The push for IIoT protocols standardization is also influencing the market, enabling better interoperability across industrial sensor networks and supporting scalable deployments in sectors like energy management systems and smart grid technology.
We can help! Our analysts can customize this industrial internet of things (iot) market research report to meet your requirements.
 RIA -
RIA - 
