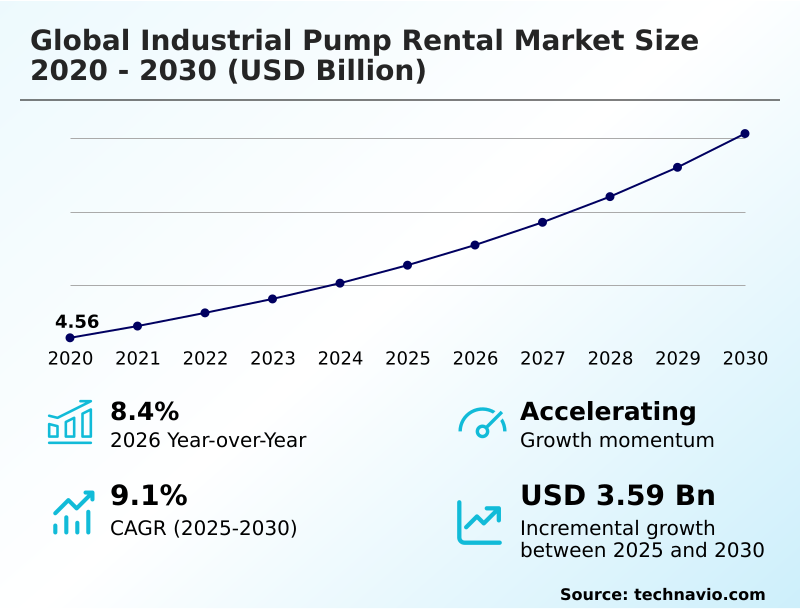
Industrial Pump Rental Market Size 2026-2030
The industrial pump rental market size is valued to increase by USD 3.59 billion, at a CAGR of 9.1% from 2025 to 2030. Increasing benefits of pump rental services will drive the industrial pump rental market.
Major Market Trends & Insights
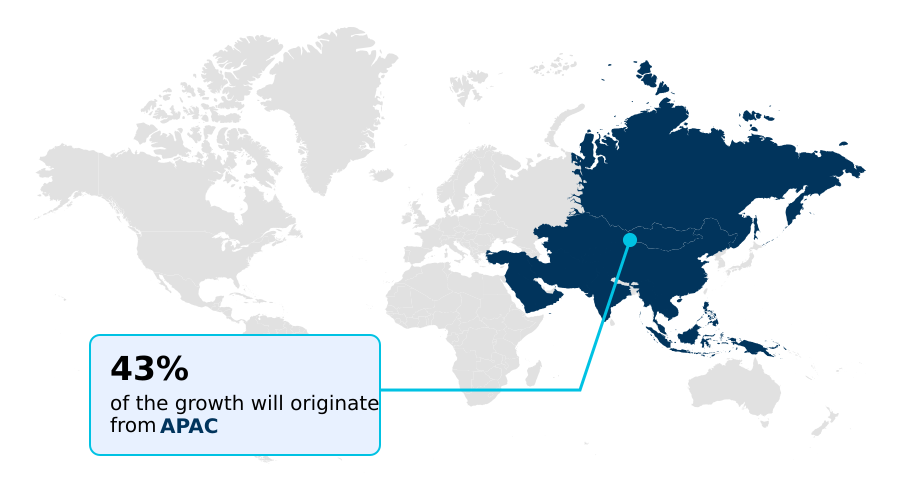
- APAC dominated the market and accounted for a 42.8% growth during the forecast period.
- By End-user - Industrial segment was valued at USD 4.27 billion in 2024
- By Type - Centrifugal pumps segment accounted for the largest market revenue share in 2024
Market Size & Forecast
- Market Opportunities: USD 5.57 billion
- Market Future Opportunities: USD 3.59 billion
- CAGR from 2025 to 2030 : 9.1%
Market Summary
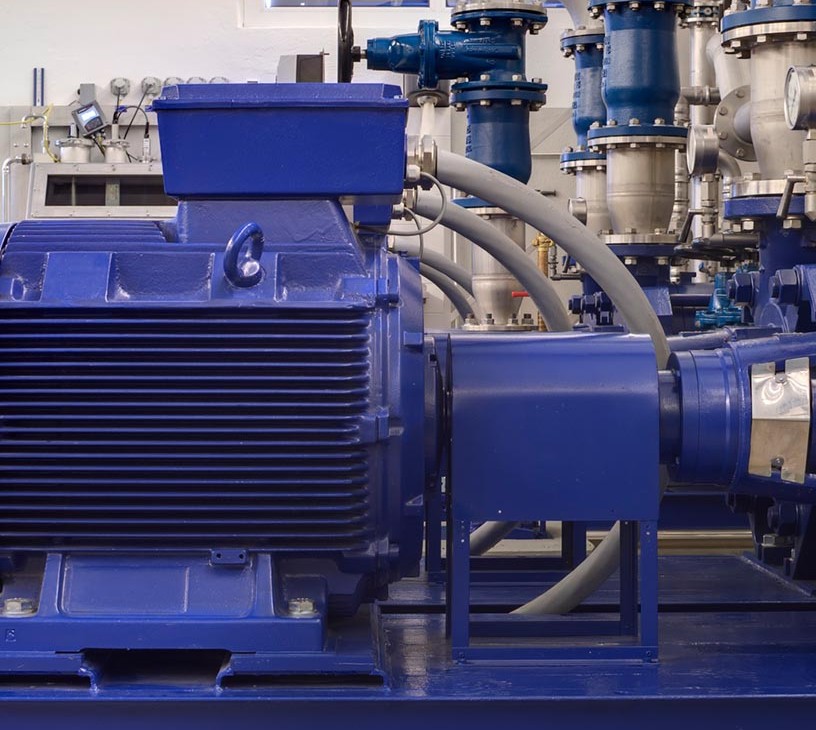
- The industrial pump rental market is defined by its critical role in sustaining operations across diverse sectors through the provision of temporary pumping solutions. Demand is driven by the need for cost-effective, flexible access to specialized equipment such as centrifugal pumps and positive displacement pumps for applications ranging from construction dewatering to complex fluid management in refineries.
- A key trend involves the integration of remote monitoring systems and predictive maintenance analytics, enabling proactive service and minimizing downtime. This shift enhances the value proposition beyond mere equipment supply to offering integrated fluid management.
- For instance, in a large-scale municipal infrastructure upgrade, renting a fleet of pumps equipped with real-time performance tracking allows project managers to optimize energy consumption and schedule maintenance without disrupting public services, showcasing the move towards comprehensive, technology-driven service models.
- Challenges persist in logistics and managing a diverse, high-value fleet, but the market's trajectory is toward providing more intelligent, reliable, and efficient solutions.
What will be the Size of the Industrial Pump Rental Market during the forecast period?
Get Key Insights on Market Forecast (PDF) Get Free Sample
How is the Industrial Pump Rental Market Segmented?
The industrial pump rental industry research report provides comprehensive data (region-wise segment analysis), with forecasts and estimates in "USD million" for the period 2026-2030, as well as historical data from 2020-2024 for the following segments.
- End-user
- Industrial
- Water utility
- Construction
- Type
- Centrifugal pumps
- Positive displacement pumps
- Others
- Application
- Oil and gas
- Chemical
- Mining
- Power
- Others
- Geography
- APAC
- China
- Japan
- India
- Europe
- Germany
- UK
- France
- North America
- US
- Canada
- Mexico
- Middle East and Africa
- Saudi Arabia
- UAE
- South Africa
- South America
- Brazil
- Argentina
- Rest of World (ROW)
- APAC
By End-user Insights
The industrial segment is estimated to witness significant growth during the forecast period.
The industrial segment is driven by the need for reliable fluid management solutions in manufacturing and heavy engineering. Industries increasingly rely on rental services for maintenance shutdowns and emergency operations, utilizing temporary pumping infrastructure and industrial fluid transfer systems.
These services provide cost-effective access to advanced equipment like trash pumps and axial flow pumps, avoiding high capital expenditure.
This approach ensures operational continuity and efficiency, with rental providers offering specialized wastewater management solutions and mobile dewatering pump rental for infrastructure sites.
Adopting rental models for industrial processing pump hire enables companies to achieve up to a 15% reduction in project delays associated with equipment failure, showcasing the value of turnkey pumping solutions and pipeline hydrostatic testing pumps.
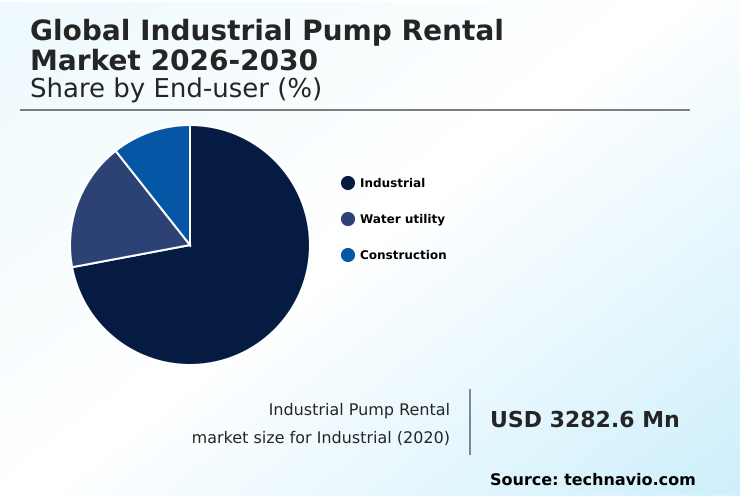
The Industrial segment was valued at USD 4.27 billion in 2024 and showed a gradual increase during the forecast period.

Regional Analysis
APAC is estimated to contribute 42.8% to the growth of the global market during the forecast period.Technavio’s analysts have elaborately explained the regional trends and drivers that shape the market during the forecast period.
See How Industrial Pump Rental Market Demand is Rising in APAC Get Free Sample
The geographic landscape of the industrial pump rental market is expanding, with APAC leading growth at a rate approximately 1.5% higher than North America, driven by massive infrastructure and industrial projects.
In this region, demand for site dewatering services and emergency flood response pumps is surging. Countries like China and India are significant contributors, leveraging pump rental for infrastructure projects.
The adoption of modular pump designs and solids handling pumps is critical in managing diverse site conditions.
Advanced digital fleet management systems are being deployed, enhancing operational visibility by over 30% for companies managing rental pump technical support across vast territories.
These systems are crucial for coordinating high-volume water transfer and pump rental for plant shutdowns, ensuring equipment like explosion-proof pump systems and hydraulic submersible pumps are available for chemical plant pump rental and other specialized applications.
Market Dynamics
Our researchers analyzed the data with 2025 as the base year, along with the key drivers, trends, and challenges. A holistic analysis of drivers will help companies refine their marketing strategies to gain a competitive advantage.
- Strategic decision-making in the industrial pump rental market requires a detailed understanding of both financial and operational variables. Evaluating the cost of renting industrial water pumps for construction is a critical first step, but it must be weighed against the long-term benefits of centrifugal pump rental for dewatering projects, which offer superior efficiency.
- When selecting positive displacement pumps for chemical transfer, factors beyond price, such as material compatibility and precision, are paramount. Best practices for emergency flood control pump rental emphasize rapid deployment and reliability. Technologically, the integration of remote monitoring systems for temporary pump installations is no longer a luxury but a necessity for operational oversight.
- For instance, choosing an energy-efficient pump rental for wastewater treatment plants can yield operational savings that are double those from a standard unit. Industrial pump rental for oil and gas refinery maintenance demands specialized, certified equipment. Similarly, slurry pump rental solutions for mining applications must handle highly abrasive materials effectively.
- High-pressure pump rental for pipeline testing ensures infrastructure integrity, while managing groundwater control with rental wellpoint systems is fundamental to site safety. The complexity of temporary bypass pumping for municipal sewer repair highlights the need for expert providers. Choosing a rental pump for high-viscosity fluid handling or a rental pump selection for power plant cooling systems requires deep technical knowledge.
- The impact of predictive maintenance on pump rental costs is significant, often reducing total expenditure. Adherence to environmental compliance for temporary water discharge pumps is non-negotiable. Many challenges in large-scale industrial fluid transfer projects are mitigated by engaging providers of turnkey pump rental solutions for plant turnarounds.
- Finally, comparing diesel vs electric industrial pump rental involves a trade-off between mobility and emissions, while rapid deployment pump rental for disaster response prioritizes speed above all.

What are the key market drivers leading to the rise in the adoption of Industrial Pump Rental Industry?
- The increasing benefits of pump rental services, such as reduced capital expenditure and enhanced operational flexibility, are a key driver for market growth.
- A significant driver for market growth is the rising shift toward outsourcing equipment, which allows companies to reduce capital expenditure and access a wide range of industrial pump rental services.
- This trend is particularly evident in construction, where demand for construction dewatering equipment and bypass pumping services is high. Companies using these rental services report up to 25% lower upfront costs compared to purchasing.
- The need for temporary pumping solutions is also fueled by investments in residential and commercial projects. Rental providers offer crucial support for site dewatering services and groundwater control systems, utilizing equipment such as mobile pumping units.
- The flexibility to access a diverse fleet, including specialized systems for municipal water management and oil and gas pump rental, without ownership burdens, makes renting a strategically sound option for many organizations.
What are the market trends shaping the Industrial Pump Rental Industry?
- Service delivery innovation, driven by digital integration and enhanced customer experience, is an emerging trend within the industrial pump rental market.
- Innovation in service delivery is a pivotal trend, with companies focusing on expanding their offerings beyond basic equipment. The market is seeing a surge in demand for rental pump for tunneling and power generation cooling pumps, driven by large-scale infrastructure projects.
- This trend is supported by the integration of advanced technologies, where the use of pump performance optimization techniques has been shown to reduce energy consumption by up to 12%. Rental providers are now offering comprehensive services including pump rental installation support and management of mobile pump fleet management.
- This shift towards integrated fluid management is transforming providers into full-service partners, delivering specialized fluid control and sustainable pumping solutions. High-capacity pumping units and wellpoint dewatering systems are becoming standard offerings, addressing the complex needs of modern industrial and construction projects.
What challenges does the Industrial Pump Rental Industry face during its growth?
- Operational challenges, including complex logistics and equipment maintenance, represent a key constraint affecting growth in the industrial pump rental services market.
- Operational challenges remain a primary constraint, as companies navigate complex logistics and the high costs associated with maintaining a diverse fleet. Capital expenditure constraints are significant, with the initial investment for a single high-pressure pump system running into tens of thousands of dollars, making fleet expansion a slow process.
- This is compounded by changing regulatory norms, which can increase compliance costs by over 10% annually. Managing a fleet of centrifugal pumps and chemical resistant pumps for applications like agricultural irrigation pumps and mining dewatering solutions requires constant vigilance. Ensuring the availability of sewage bypass systems and emergency pumping contractors on short notice adds another layer of complexity.
- These factors, combined with the need for cost-effective pumping solutions, challenge providers to optimize their operations continuously.
Exclusive Technavio Analysis on Customer Landscape
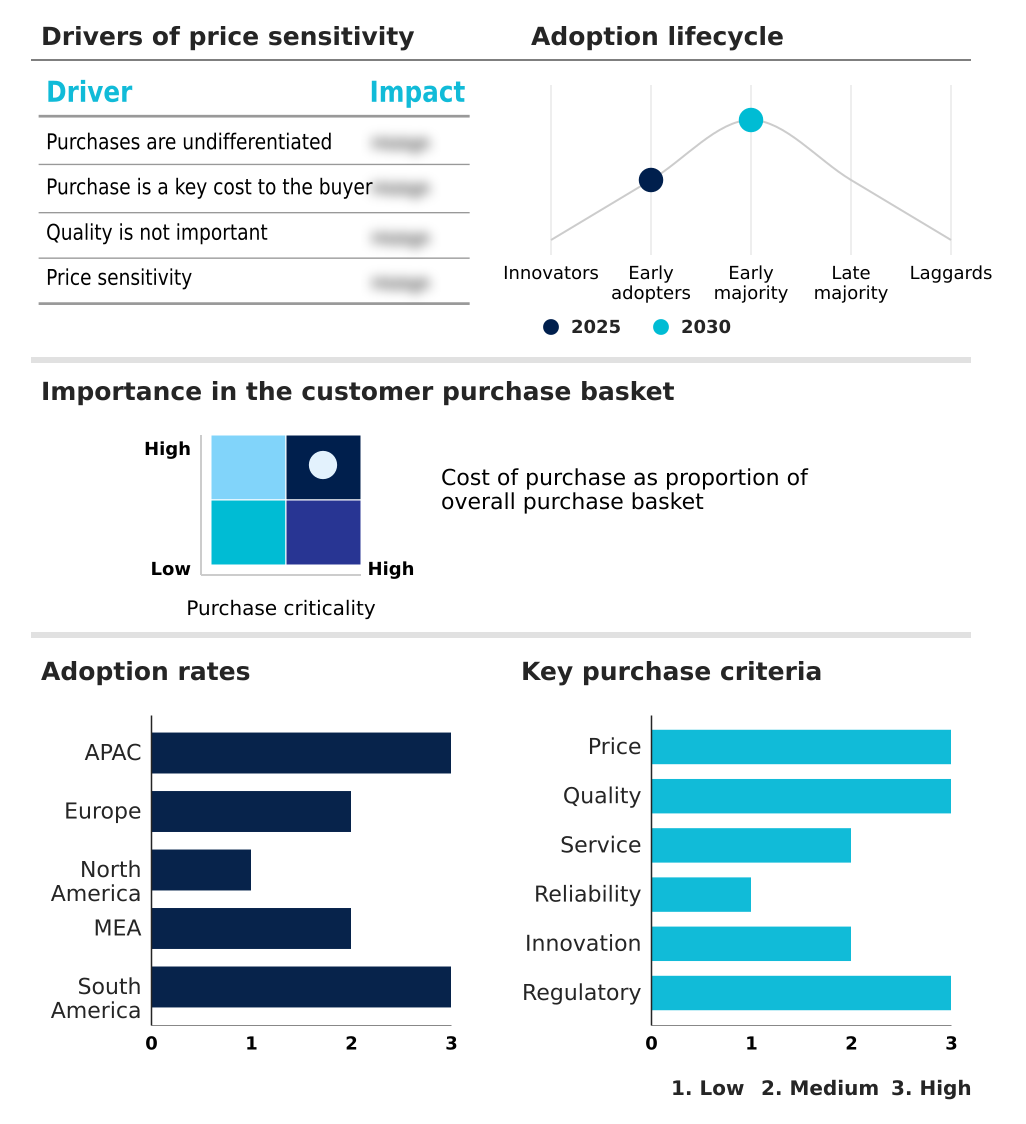
The industrial pump rental market forecasting report includes the adoption lifecycle of the market, covering from the innovator’s stage to the laggard’s stage. It focuses on adoption rates in different regions based on penetration. Furthermore, the industrial pump rental market report also includes key purchase criteria and drivers of price sensitivity to help companies evaluate and develop their market growth analysis strategies.
Customer Landscape of Industrial Pump Rental Industry
Competitive Landscape
Companies are implementing various strategies, such as strategic alliances, industrial pump rental market forecast, partnerships, mergers and acquisitions, geographical expansion, and product/service launches, to enhance their presence in the industry.
Atlas Copco AB - Key offerings include a diverse portfolio of industrial pumps, providing versatile and specialized fluid handling solutions for various industrial applications and operational needs.
The industry research and growth report includes detailed analyses of the competitive landscape of the market and information about key companies, including:
- Atlas Copco AB
- Barco Pump
- Boels Rental.
- Global Pump
- HERC HOLDINGS INC.
- Holland Pump
- Kiloutou
- LOXAM GROUP.
- MWI Pumps
- Rain For Rent Inc
- Ramirent Oyj
- Selwood Ltd.
- Siltbuster Ltd.
- Speedy Hire Plc.
- Sunbelt Rentals Inc.
- Thompson Pump
- United Rentals Inc.
- Van der Kamp BV
- Workdry International Ltd
- Xylem Inc.
Qualitative and quantitative analysis of companies has been conducted to help clients understand the wider business environment as well as the strengths and weaknesses of key industry players. Data is qualitatively analyzed to categorize companies as pure play, category-focused, industry-focused, and diversified; it is quantitatively analyzed to categorize companies as dominant, leading, strong, tentative, and weak.
Recent Development and News in Industrial pump rental market
- In May 2025, United Rentals Inc. announced the acquisition of a regional pump rental specialist, enhancing its fleet of high-pressure pump systems and expanding its footprint in the oil and gas sector.
- In April 2025, Xylem Inc. launched a new line of rental pumps featuring advanced sealing mechanisms and integrated remote monitoring technologies, designed for wastewater management solutions.
- In January 2025, Atlas Copco AB formed a strategic partnership with a leading technology firm to integrate digital fleet management and predictive maintenance analytics into its temporary pumping infrastructure.
- In September 2024, Sunbelt Rentals Inc. opened three new service hubs dedicated to emergency water control and temporary water infrastructure, improving rapid deployment capabilities for disaster response.
Dive into Technavio’s robust research methodology, blending expert interviews, extensive data synthesis, and validated models for unparalleled Industrial Pump Rental Market insights. See full methodology.
| Market Scope | |
|---|---|
| Page number | 306 |
| Base year | 2025 |
| Historic period | 2020-2024 |
| Forecast period | 2026-2030 |
| Growth momentum & CAGR | Accelerate at a CAGR of 9.1% |
| Market growth 2026-2030 | USD 3586.5 million |
| Market structure | Fragmented |
| YoY growth 2025-2026(%) | 8.4% |
| Key countries | China, Japan, India, South Korea, Australia, Indonesia, Germany, UK, France, Italy, Spain, The Netherlands, US, Canada, Mexico, Saudi Arabia, UAE, South Africa, Israel, Turkey, Brazil, Argentina and Chile |
| Competitive landscape | Leading Companies, Market Positioning of Companies, Competitive Strategies, and Industry Risks |
Research Analyst Overview
- The industrial pump rental market is undergoing a significant transformation driven by technological integration and evolving end-user demands for efficiency and reliability. The core of the market revolves around a diverse fleet, including centrifugal pumps and positive displacement pumps, tailored for applications like site dewatering services and industrial fluid transfer.
- Advanced offerings now incorporate remote monitoring technologies and predictive maintenance analytics, enabling pump performance optimization and real-time data tracking. This shift is critical for managing high-pressure pump systems and hydraulic submersible pumps effectively. Innovations in materials, such as wear-resistant coatings, corrosion-resistant materials, and advanced sealing mechanisms, are extending the life of equipment like trash pumps and solids handling pumps.
- For boardroom decisions, the adoption of digital fleet management for mobile pumping units provides a clear line of sight into asset utilization, achieving an 18% improvement in fleet efficiency. Specialized equipment like explosion-proof pump systems, wellpoint dewatering kits, axial flow pumps, and chemical resistant pumps are crucial for niche applications, supported by pump system diagnostics.
- The market is moving towards modular pump designs and automated flow control to address complex needs in bypass pumping services, slurry handling equipment, and wastewater management solutions, all while using energy-efficient motors to manage temporary pumping infrastructure and emergency water control scenarios.
What are the Key Data Covered in this Industrial Pump Rental Market Research and Growth Report?
-
What is the expected growth of the Industrial Pump Rental Market between 2026 and 2030?
-
USD 3.59 billion, at a CAGR of 9.1%
-
-
What segmentation does the market report cover?
-
The report is segmented by End-user (Industrial, Water utility, and Construction), Type (Centrifugal pumps, Positive displacement pumps, and Others), Application (Oil and gas, Chemical, Mining, Power, and Others) and Geography (APAC, Europe, North America, Middle East and Africa, South America)
-
-
Which regions are analyzed in the report?
-
APAC, Europe, North America, Middle East and Africa and South America
-
-
What are the key growth drivers and market challenges?
-
Increasing benefits of pump rental services, Operational challenges in pump rental services
-
-
Who are the major players in the Industrial Pump Rental Market?
-
Atlas Copco AB, Barco Pump, Boels Rental., Global Pump, HERC HOLDINGS INC., Holland Pump, Kiloutou, LOXAM GROUP., MWI Pumps, Rain For Rent Inc, Ramirent Oyj, Selwood Ltd., Siltbuster Ltd., Speedy Hire Plc., Sunbelt Rentals Inc., Thompson Pump, United Rentals Inc., Van der Kamp BV, Workdry International Ltd and Xylem Inc.
-
Market Research Insights
- The dynamics of the industrial pump rental market are shaped by a strategic shift towards operational efficiency and cost control. Companies offering industrial pump rental services are seeing increased demand, with clients reporting an average of 20% savings on capital expenditure by opting for temporary pumping solutions over outright purchase.
- The adoption of specialized fluid control for applications like wastewater bypass pumping has improved project timelines by up to 15%. Furthermore, mining dewatering solutions and fluid handling for refineries are critical services where providers deliver not just equipment but also rental pump installation support, ensuring seamless integration.
- This service-oriented model, which includes 24/7 pump rental services and turnkey pumping solutions, is becoming a standard expectation, driving competition based on reliability and technical expertise.
We can help! Our analysts can customize this industrial pump rental market research report to meet your requirements.
 RIA -
RIA - 
