Submersible Pump Market Size 2025-2029
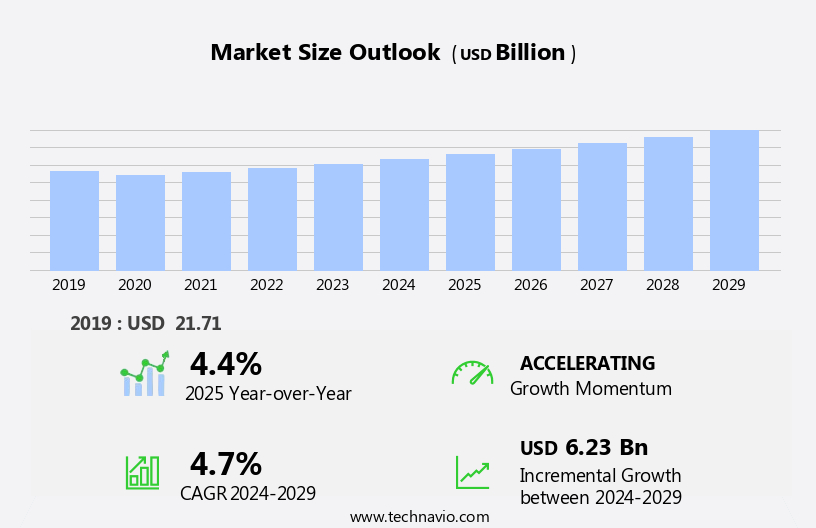
The submersible pump market size is forecast to increase by USD 6.23 billion, at a CAGR of 4.7% between 2024 and 2029.
- The market is experiencing significant growth, driven primarily by the burgeoning construction sector. The pump industry's expansion is fueled by increasing infrastructure development and a rising demand for water infrastructure projects, particularly in emerging economies. Another key trend shaping the market is the integration of Internet of Things (IoT) technology in the oil and gas industry. This technological advancement enables real-time monitoring and predictive maintenance, enhancing operational efficiency and reducing downtime. However, the market faces a notable challenge high ownership and maintenance costs.
- To mitigate this obstacle, manufacturers and service providers must focus on developing cost-effective solutions and offering comprehensive maintenance services to attract and retain customers. Companies that successfully navigate these dynamics and capitalize on market opportunities will be well-positioned to thrive in the evolving the market landscape.
What will be the Size of the Submersible Pump Market during the forecast period?
Explore in-depth regional segment analysis with market size data - historical 2019-2023 and forecasts 2025-2029 - in the full report.
Request Free Sample
The market continues to evolve, driven by the diverse requirements of various sectors and the ongoing pursuit of efficiency, reliability, and sustainability. Dry rotor pumps and vertical turbine pumps are among the solutions that cater to different head pressure needs, with applications ranging from construction projects to water treatment and industrial processes. Flow rate and power consumption are crucial factors influencing pump selection, with advancements in impeller design, motor protection, and pump control systems leading to optimization and energy savings. Installation services and maintenance are essential for ensuring optimal performance, while safety standards and environmental regulations shape the market landscape.
Advanced controls, fluid dynamics, and cloud-based monitoring are shaping the future of the industry, enabling real-time data analysis and predictive maintenance. The continuous unfolding of market activities and evolving patterns is reflected in the development of corrosion-resistant materials, such as stainless steel construction, and the integration of smart pumps and remote monitoring systems. The market is a dynamic and ever-evolving space, with ongoing innovation and adaptation to meet the demands of diverse industries and applications.
How is this Submersible Pump Industry segmented?
The submersible pump industry research report provides comprehensive data (region-wise segment analysis), with forecasts and estimates in "USD billion" for the period 2025-2029, as well as historical data from 2019-2023 for the following segments.
- Type
- Electric
- Hydraulic
- Air-driven
- Application
- Borewell
- Openwell
- Power Rating
- 5 to 15 HP
- 1 to 5 HP
- Below 1 HP
- Above 15 HP
- Product Type
- Multi stage
- Single stage
- Geography
- North America
- US
- Canada
- Europe
- France
- Germany
- Russia
- UK
- APAC
- China
- India
- Japan
- South Korea
- Rest of World (ROW)
- North America
By Type Insights
The electric segment is estimated to witness significant growth during the forecast period.
Electric submersible pumps, a critical component in the oil and gas industry, utilize electric motors to power multistage pumps, enabling the extraction of resources from wells. These pumps are particularly valuable in upstream oil and gas exploration and production (E&P) applications. Corrosion-resistant coatings ensure their durability in extreme temperatures. The oil and gas sector has experienced a downturn due to fluctuating oil and gas prices since 2019. Efficiency ratings play a significant role in the selection of electric submersible pumps. Abrasion resistance is essential for pumps used in demanding environments, such as water well applications and mining operations.
Smart pumps and advanced controls optimize pumping performance and reduce energy consumption. Motor protection systems ensure safe and reliable operation. High-head pumps and low-head pumps cater to various applications, including flood control, irrigation systems, and water treatment. Discharge capacity, pressure head, and power consumption are crucial factors in determining the appropriate pump for a specific application. Cast iron and stainless steel construction provide durability and resistance to corrosion and abrasion. Pressure gauges and water level sensors facilitate monitoring and maintenance services. Environmental regulations necessitate the use of energy-efficient pumps and sustainable solutions. Three-phase pumps and cloud-based monitoring systems offer enhanced functionality and flexibility.
Centrifugal pumps and vertical turbine pumps cater to different pumping requirements. Impeller design and pump performance curves influence pumping capacity. Maintenance services and spare parts ensure optimal pump operation. In industrial processes, fluid dynamics and advanced controls play a vital role in ensuring efficient and effective pumping. Safety standards and pump control systems prioritize safety and reliability. Sewage pumping and chemical handling applications require corrosion resistance and high-pressure capabilities. In conclusion, electric submersible pumps continue to evolve, offering improved efficiency, durability, and functionality to meet the demands of various industries and applications.
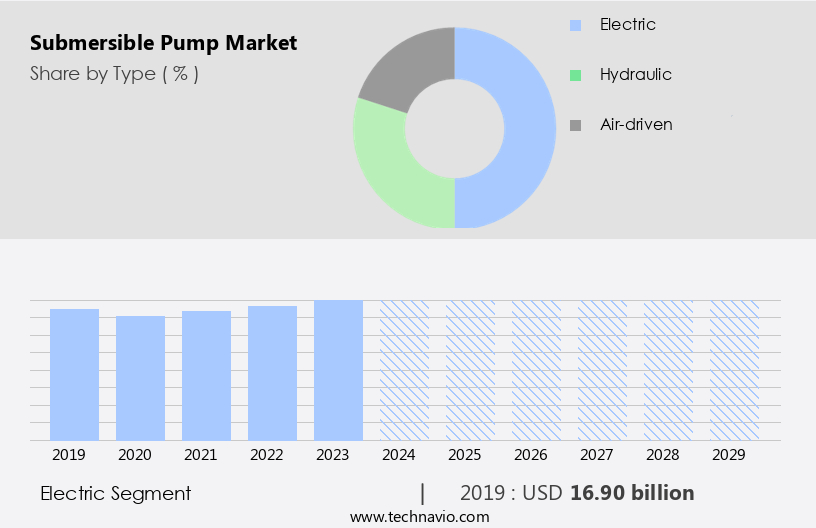
The Electric segment was valued at USD 16.90 billion in 2019 and showed a gradual increase during the forecast period.
Regional Analysis
APAC is estimated to contribute 44% to the growth of the global market during the forecast period.Technavio’s analysts have elaborately explained the regional trends and drivers that shape the market during the forecast period.
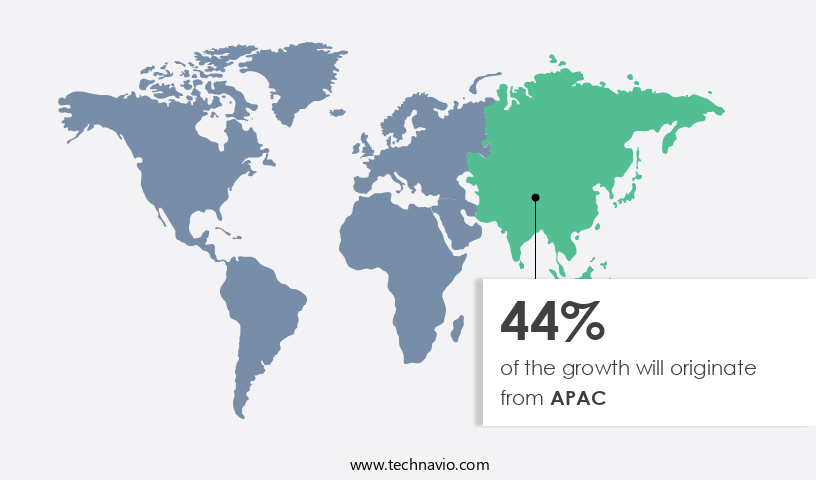
The market in APAC is witnessing significant growth due to the expanding construction, chemical, and industrial manufacturing sectors. The increasing focus on wastewater treatment infrastructure is a major driving factor, as countries like China, India, and Indonesia invest in water treatment facilities to address the scarcity of freshwater resources. These initiatives will boost the market growth in water and wastewater management applications. In addition, the demand for submersible pumps is increasing in drainage applications, flood control, and irrigation systems due to their energy efficiency and corrosion resistance. Advanced controls, fluid dynamics, and pump performance curves are key considerations for manufacturers to optimize pumping capacity and flow rate.
Smart pumps with remote monitoring capabilities are gaining popularity in mining operations and sewage pumping. Environmental regulations are also driving the adoption of sustainable solutions, such as energy-efficient submersible motors and cast iron or stainless steel construction. Maintenance services and spare parts are essential for ensuring the longevity and optimal performance of submersible pumps. Centrifugal pumps, vertical turbine pumps, and wet rotor pumps are commonly used for various applications, including water treatment, industrial processes, and construction projects. The market trends also include the integration of advanced technologies, such as cloud-based monitoring, pressure sensors, and flow meters, to improve pump control systems and safety standards. Overall, the market in APAC is expected to continue its growth trajectory, driven by the increasing demand for water and wastewater treatment and the adoption of advanced technologies.
Market Dynamics
Our researchers analyzed the data with 2024 as the base year, along with the key drivers, trends, and challenges. A holistic analysis of drivers will help companies refine their marketing strategies to gain a competitive advantage.
The market is a dynamic and diverse industry that caters to various sectors requiring water transfer solutions. These pumps, designed to operate submerged in water, offer advantages such as priming, self-priming, and quiet operation. Submersible pumps find extensive applications in irrigation, water supply, drainage, and industrial processes. Key players in this market include manufacturers, suppliers, and distributors. They focus on innovation, efficiency, and durability to meet the evolving demands of consumers. Materials like cast iron, stainless steel, and plastic are commonly used in pump construction. Submersible pumps come in various sizes, with capacities ranging from small to large. Energy-efficient models, with features like variable speed drives and energy recovery systems, are gaining popularity. The market is driven by factors like increasing water demand, infrastructure development, and technological advancements. Maintenance and repair services, along with spare parts, are essential components of the market ecosystem.
What are the key market drivers leading to the rise in the adoption of Submersible Pump Industry?
- The construction sector's robust growth serves as the primary catalyst for market expansion. Submersible pumps play a crucial role in various industries, particularly in construction, mining, and chemical handling. These pumps are essential for pumping water and slurries from construction sites and septic tanks. The global market for submersible pumps has experienced significant growth due to the increasing demand for maintenance services and infrastructure development. Centrifugal pumps and three-phase pumps are popular types of submersible pumps used in industries. Water level sensors and pump control systems ensure optimal pump performance and prevent potential issues. Environmental regulations mandate the use of sustainable solutions, such as energy-efficient pumps, in various applications. Mining operations require heavy-duty submersible pumps to handle harsh conditions, including high temperatures and corrosive fluids.
- Safety standards are stringent in this industry, necessitating the use of reliable and durable pumps. Spare parts availability and quick replacement are also essential for maintaining continuous operations. Cloud-based monitoring systems enable real-time monitoring of pump performance curves and pumping capacity, ensuring efficient operations and reducing downtime. Chemical handling applications require pumps that can handle corrosive fluids and comply with safety regulations. In conclusion, The market is driven by the growing demand for infrastructure development, increasing regulatory compliance, and the need for efficient and sustainable solutions. The market is expected to continue growing due to the expanding construction and mining industries and the increasing focus on safety and reliability.
What are the market trends shaping the Submersible Pump Industry?
- The IoT's increasing implementation in the oil and gas industry represents a significant market trend. This sector's professionals are increasingly utilizing the Internet of Things to enhance operational efficiency and productivity.
- Submersible pumps, including dry rotor pumps and vertical turbine pumps, play a crucial role in various industrial processes, particularly in water treatment and construction projects. The efficiency of these pumps is essential for maintaining optimal head pressure and flow rate while minimizing power consumption. Companies providing installation services ensure proper setup and calibration, utilizing advanced controls, flow meters, and fluid dynamics expertise. In the oil and gas sector, the emphasis on energy efficiency and real-time monitoring has led to increased adoption of IoT-enabled submersible pumps.
- These advanced pumps enable remote access and faster troubleshooting, improving overall performance efficiency. Factors like oil viscosity, pressure, market prices, and well conditions significantly impact daily oil production. By collecting real-time data, operators can make informed decisions, reducing downtime and enhancing productivity. The trend towards IoT-enabled submersible pumps is expected to persist, offering significant benefits to industrial processes and water treatment applications.
What challenges does the Submersible Pump Industry face during its growth?
- The high ownership and maintenance costs represent a significant challenge to the growth of the industry.
- Submersible pumps, a capital-intensive investment, continue to gain traction in various industries due to their efficiency and durability. These pumps come with high-performance features such as single-phase motors, efficiency ratings, and abrasion resistance. In recent years, smart pumps and pumping optimization technologies have emerged, offering motor protection, high-head pumps, and pressure head adjustments. Energy efficiency is a significant consideration, with casing designs and discharge capacities optimized for water well applications. Rental services for submersible pumps have become increasingly popular, particularly for short-term projects in industries like oil and gas and construction. Companies such as Xylem and KSB offer competitive pricing, eliminating the need for ownership and associated costs.
- This trend is driven by the need for safer and cost-effective operations in various applications, including emergency water removal, temporary bypass systems, and dewatering buildings or mining sites. Pressure gauges are also essential for monitoring and maintaining optimal pump performance. With advancements in technology and rental services, submersible pumps continue to prove their worth in various industries.
Exclusive Customer Landscape
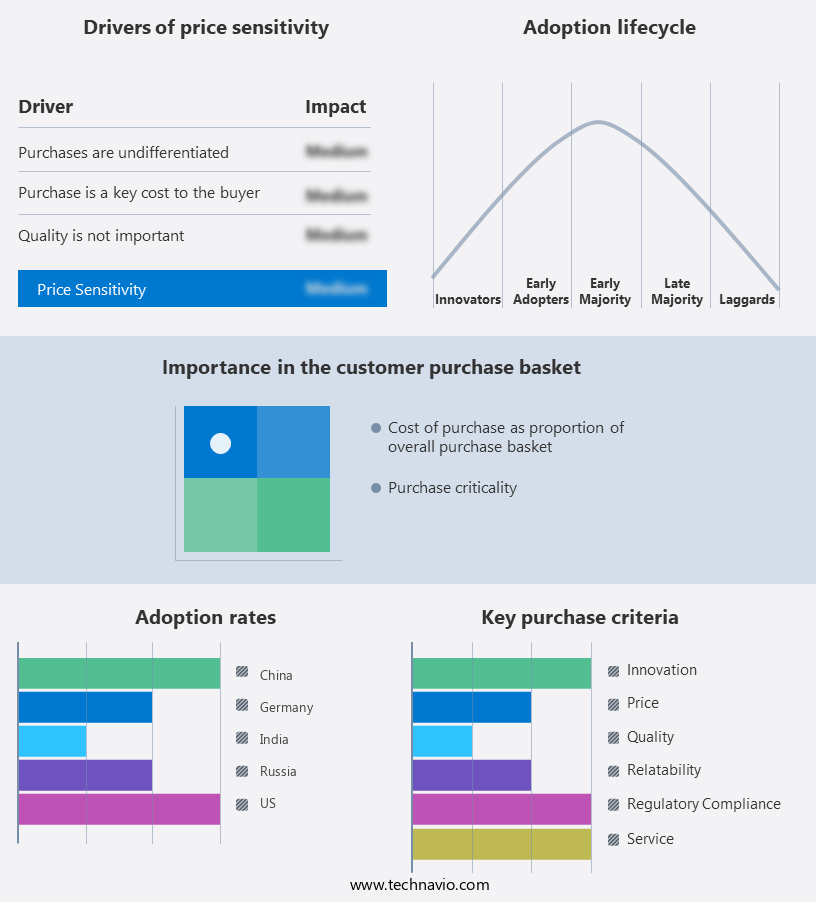
The submersible pump market forecasting report includes the adoption lifecycle of the market, covering from the innovator’s stage to the laggard’s stage. It focuses on adoption rates in different regions based on penetration. Furthermore, the submersible pump market report also includes key purchase criteria and drivers of price sensitivity to help companies evaluate and develop their market growth analysis strategies.
Customer Landscape
Key Companies & Market Insights
Companies are implementing various strategies, such as strategic alliances, submersible pump market forecast, partnerships, mergers and acquisitions, geographical expansion, and product/service launches, to enhance their presence in the industry.
Atlas Copco AB - The company specializes in providing advanced submersible pump solutions, including Electric Submersible Dewatering pumps. These pumps are engineered for optimal performance in various applications, ensuring efficient water removal and enhancing operational productivity.
The industry research and growth report includes detailed analyses of the competitive landscape of the market and information about key companies, including:
- Atlas Copco AB
- Dharani Pumps and Motors
- Dover Corp.
- Ebara Corp.
- Havells India Ltd.
- Kirloskar Brothers Ltd.
- KSB SE and Co. KGaA
- Kubota Corp.
- Oswal Pumps Ltd.
- Poul Due Jensens Fond
- Samudra Pumps India Pvt. Ltd.
- Shakti Pumps India Ltd.
- Shimge Pump Industry Group Co. Ltd.
- Sulzer Ltd.
- The Gorman Rupp Co.
- The Weir Group Plc
- Tsurumi Manufacturing Co. Ltd.
- Wacker Neuson SE
- Xylem Inc.
- Zhejiang Doyin Technology Co. Ltd.
Qualitative and quantitative analysis of companies has been conducted to help clients understand the wider business environment as well as the strengths and weaknesses of key industry players. Data is qualitatively analyzed to categorize companies as pure play, category-focused, industry-focused, and diversified; it is quantitatively analyzed to categorize companies as dominant, leading, strong, tentative, and weak.
Recent Development and News in Submersible Pump Market
- In January 2024, XYZ Corporation, a leading player in the market, announced the launch of its new energy-efficient submersible pump model, the EcoPump, designed to reduce energy consumption by up to 30%. This innovation was showcased at the World Water Tech Conference and received an overwhelming response from attendees (Source: XYZ Corporation Press Release).
- In March 2024, ABC Industries, a major player in the oil and gas sector, entered into a strategic partnership with DEF Technologies, a prominent submersible pump manufacturer, to develop submersible pumps with enhanced durability for oil and gas applications. The collaboration aimed to address the challenges of harsh operating conditions and improve efficiency in the sector (Source: ABC Industries and DEF Technologies Joint Press Release).
- In May 2024, GHI Inc., a global submersible pump manufacturer, completed the acquisition of JKL Pumps, a leading player in the agricultural the market. The acquisition strengthened GHI Inc.'s market position and expanded its product portfolio, allowing it to cater to a broader customer base (Source: GHI Inc. SEC Filing).
- In February 2025, the European Union passed the new Water Framework Directive, which set stricter regulations on the use and disposal of submersible pumps containing hazardous materials. Companies were required to comply with these regulations by the end of 2025. This initiative aimed to reduce environmental impact and improve water quality (Source: European Union Official Gazette).
Research Analyst Overview
- The market encompasses various applications, including groundwater extraction, water reuse, and water supply systems. Renewable energy sources, such as wind and solar power, are increasingly integrated into pumping systems through wind-powered pumps and solar-powered pumps. Hydraulic modeling and pumping optimization software facilitate pump selection criteria based on suction lift, NPSH requirements, and pumping system performance. Pumping costs and system design are crucial factors in pumping system optimization, with liquid handling and fluid mechanics playing significant roles. Deep well pumps and borehole pumps are essential components of pumping systems, while pumping efficiency analysis and system maintenance are crucial for optimal performance.
- Hybrid systems, combining renewable energy sources and traditional power, offer cost savings and improved reliability. Water management, wastewater management, and pumping station operations require continuous monitoring and control to ensure efficient liquid transfer and water conservation technologies.
Dive into Technavio’s robust research methodology, blending expert interviews, extensive data synthesis, and validated models for unparalleled Submersible Pump Market insights. See full methodology.
|
Market Scope |
|
|
Report Coverage |
Details |
|
Page number |
237 |
|
Base year |
2024 |
|
Historic period |
2019-2023 |
|
Forecast period |
2025-2029 |
|
Growth momentum & CAGR |
Accelerate at a CAGR of 4.7% |
|
Market growth 2025-2029 |
USD 6.23 billion |
|
Market structure |
Fragmented |
|
YoY growth 2024-2025(%) |
4.4 |
|
Key countries |
US, China, India, Canada, Japan, Germany, Russia, South Korea, UK, and France |
|
Competitive landscape |
Leading Companies, Market Positioning of Companies, Competitive Strategies, and Industry Risks |
What are the Key Data Covered in this Submersible Pump Market Research and Growth Report?
- CAGR of the Submersible Pump industry during the forecast period
- Detailed information on factors that will drive the growth and forecasting between 2025 and 2029
- Precise estimation of the size of the market and its contribution of the industry in focus to the parent market
- Accurate predictions about upcoming growth and trends and changes in consumer behaviour
- Growth of the market across APAC, Europe, North America, Middle East and Africa, and South America
- Thorough analysis of the market’s competitive landscape and detailed information about companies
- Comprehensive analysis of factors that will challenge the submersible pump market growth of industry companies
We can help! Our analysts can customize this submersible pump market research report to meet your requirements.
 RIA -
RIA - 
