Industrial Safety Gates Market Analysis, Size, and Forecast 2026-2030: APAC (China, India, and Japan), North America (US, Canada, and Mexico), Europe (Germany, UK, and France), South America (Brazil, Argentina, and Colombia), Middle East and Africa (South Africa, Saudi Arabia, and UAE), and Rest of World (ROW)

Industrial Safety Gates Market Analysis, Size, and Forecast 2026-2030:
APAC (China, India, and Japan), North America (US, Canada, and Mexico), Europe (Germany, UK, and France), South America (Brazil, Argentina, and Colombia), Middle East and Africa (South Africa, Saudi Arabia, and UAE), and Rest of World (ROW)

Published: Dec 2025 309 Pages SKU: IRTNTR43124

Market Overview at a Glance

$172.6 Mn
Market Opportunity
5.7%
CAGR 2025 - 2030
50.9%
APAC Growth
$254.9 Mn
Swing gates segment 2024

Industrial Safety Gates Market Size 2026-2030

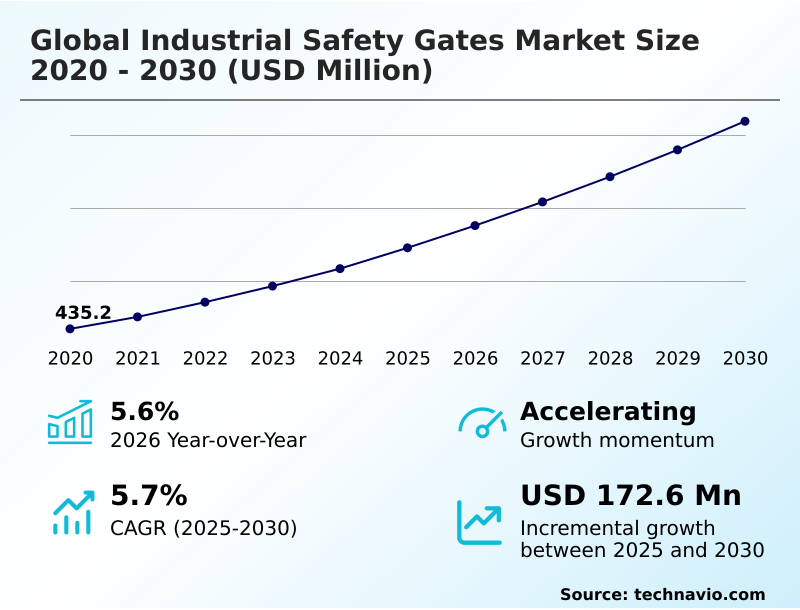
The industrial safety gates market size is valued to increase by USD 172.6 million, at a CAGR of 5.7% from 2025 to 2030. Proliferation of stringent occupational safety regulations and heightened enforcement will drive the industrial safety gates market.

Major Market Trends & Insights

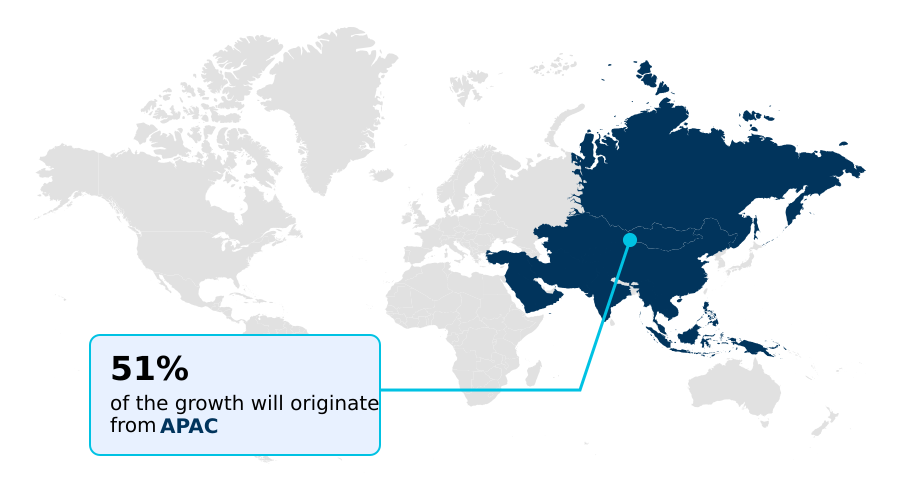
  • APAC dominated the market and accounted for a 50.9% growth during the forecast period.
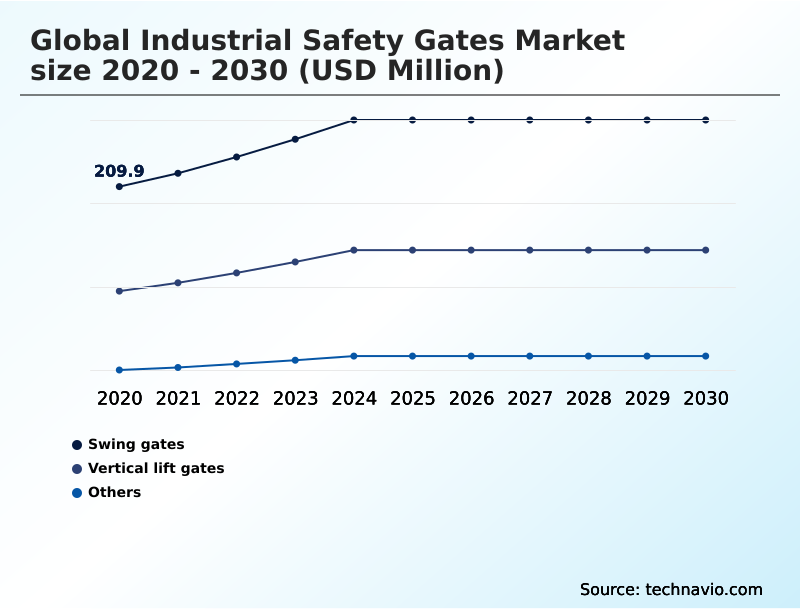
  • By Product - Swing gates segment was valued at USD 254.9 million in 2024
  • By Distribution Channel - Direct sales segment accounted for the largest market revenue share in 2024

Market Size & Forecast

  • Market Opportunities: USD 283.1 million
  • Market Future Opportunities: USD 172.6 million
  • CAGR from 2025 to 2030 : 5.7%

Market Summary

  • The industrial safety gates market is fundamentally shaped by the twin imperatives of regulatory compliance and operational efficiency. Demand is driven by stringent occupational health and safety regulations that mandate physical barriers to mitigate fall hazards and control access to dangerous machinery. As industries embrace automation, the nature of these hazards evolves, necessitating more sophisticated solutions.
  • For instance, in a modern logistics center, the deployment of autonomous mobile robots requires integrated safety systems where interlocking gates work in concert with area scanners to prevent collisions in shared human-robot workspaces. This moves the role of a safety gate beyond a simple mechanical barrier to an active component in a facility’s safety logic.
  • Trends reflect this shift, with a growing emphasis on smart gates featuring IIoT connectivity for remote monitoring and predictive maintenance. Simultaneously, the market is challenged by the need to provide cost-effective, scalable solutions for small and medium-sized enterprises, which often lack the capital for extensive safety retrofits.
  • Manufacturers are responding with modular, customizable systems that can be adapted to diverse applications, from manufacturing and warehousing to construction sites, ensuring safety without compromising productivity.

What will be the Size of the Industrial Safety Gates Market during the forecast period?

Get Key Insights on Market Forecast (PDF) Request Free Sample

How is the Industrial Safety Gates Market Segmented?

The industrial safety gates industry research report provides comprehensive data (region-wise segment analysis), with forecasts and estimates in "USD million" for the period 2026-2030, as well as historical data from 2020-2024 for the following segments.

  • Product
    • Swing gates
    • Vertical lift gates
    • Others
  • Distribution channel
    • Direct sales
    • Indirect sales
  • Application
    • Manufacturing facilities
    • Warehouses
    • Construction Sites
    • Others
  • Type
    • Manual
    • Automatic
  • Geography
    • APAC
      • China
      • India
      • Japan
    • North America
      • US
      • Canada
      • Mexico
    • Europe
      • Germany
      • UK
      • France
    • South America
      • Brazil
      • Argentina
      • Colombia
    • Middle East and Africa
      • South Africa
      • Saudi Arabia
      • UAE
    • Rest of World (ROW)

By Product Insights

The swing gates segment is estimated to witness significant growth during the forecast period.

Swing gates, defined by their pivoting swing gate mechanism, are a cornerstone of the industrial safety market. Their intuitive operation makes them ideal for pedestrian traffic segregation and guarding access points.

The self-closing safety gate variant is particularly critical for compliance with mandates like the OSHA 1910.29 standard, as it eliminates human error by ensuring a constant barrier.

Manufacturers are innovating with improved ergonomic gate design and durable powder-coated steel construction to enhance usability and lifespan.

These gates form a fundamental part of a facility's overall facility safety infrastructure, providing reliable protection that reduces unprotected opening incidents by over 95%.

Request Free Sample

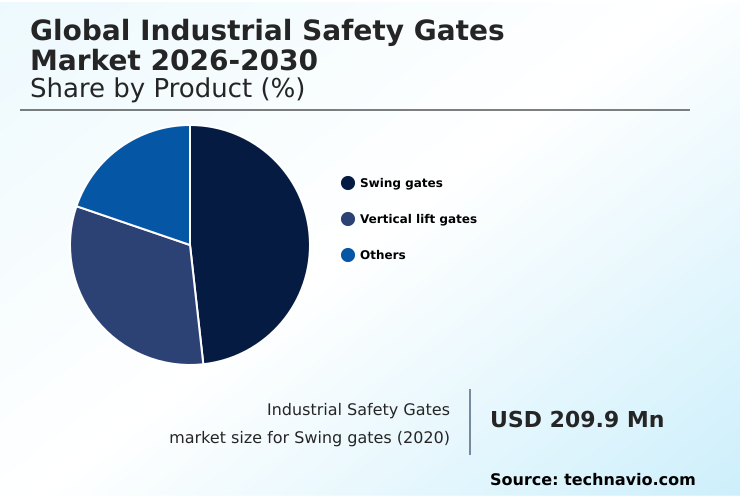
The Swing gates segment was valued at USD 254.9 million in 2024 and showed a gradual increase during the forecast period.

Request Free Sample

Regional Analysis

APAC is estimated to contribute 50.9% to the growth of the global market during the forecast period.Technavio’s analysts have elaborately explained the regional trends and drivers that shape the market during the forecast period.

See How Industrial Safety Gates Market Demand is Rising in APAC Request Free Sample

The geographic landscape is marked by diverse growth trajectories, with the APAC region demonstrating the most rapid expansion, accounting for over 50% of the market's incremental growth.

This surge is fueled by massive industrialization and infrastructure projects requiring extensive modular guarding system installations.

In contrast, mature markets like Europe and North America focus on technological upgrades, such as integrating vertical lift gate actuator technology in space-constrained automated facilities.

Across all regions, the emphasis on regulatory compliance, including adherence to standards like ANSI Z359 compliance, is a universal driver.

Demand for specialized solutions like the industrial pallet gate for mezzanine edge protection and hygienic design gate products for food and pharmaceutical sectors is rising globally, highlighting a shift towards application-specific safety.

These systems secure critical conveyor access control points and improve safety.

Market Dynamics

Our researchers analyzed the data with 2025 as the base year, along with the key drivers, trends, and challenges. A holistic analysis of drivers will help companies refine their marketing strategies to gain a competitive advantage.

  • Strategic procurement in the industrial safety gates market requires a nuanced evaluation beyond initial price. When assessing the total cost of osha compliant safety gates, decision-makers must factor in long-term reliability and the potential for avoiding penalties.
  • For instance, selecting the best safety gate for warehouse mezzanine applications involves analyzing throughput, the specific type of material handling equipment used, and ensuring the solution effectively secures compliance requirements for pallet drop zones. Similarly, understanding how to install a self-closing ladder gate properly is as crucial as the product choice itself, as improper installation can negate safety benefits.
  • For advanced manufacturing, integrating safety gates with machine plc is non-negotiable for achieving required safety performance levels. The debate over a vertical lift vs swing gate for tight spaces highlights the need for solutions tailored to facility layouts. Furthermore, choosing materials for corrosive environment gates directly impacts asset longevity.
  • Leading organizations now focus on calculating roi for automated safety gates and planning for retrofitting older machinery with safety gates, where turnkey solutions from top industrial safety gate manufacturers can streamline compliance and improve operational efficiency by more than 15% compared to ad-hoc approaches.

What are the key market drivers leading to the rise in the adoption of Industrial Safety Gates Industry?

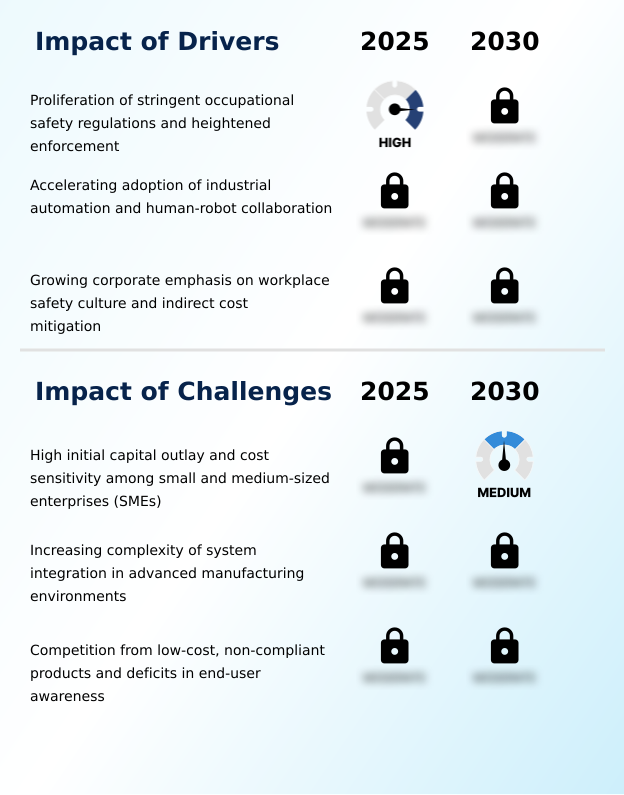
  • The proliferation of stringent occupational safety regulations, coupled with heightened enforcement by global regulatory bodies, serves as a key driver for market growth.

  • Regulatory mandates and the proliferation of automation are primary market drivers. Achieving machine guarding compliance in environments with robotic work cell guarding is non-negotiable, compelling investment in systems that provide certified fall protection.
  • As companies intensify their focus on machinery access management, the interlocking access gate becomes a critical tool for controlling entry to hazardous zones. These systems must meet a specified performance level (pl) rating to align with comprehensive risk assessments.
  • The overall move towards proactive industrial fall prevention solutions rather than reactive measures is creating sustained demand. Facilities adopting certified integrated safety systems report a 30% lower rate of safety-related downtime compared to those using basic guarding.

What are the market trends shaping the Industrial Safety Gates Industry?

  • The proliferation of smart technology and the Industrial Internet of Things (IIoT) represents a significant market trend, involving the integration of intelligent sensors and connectivity into safety gates for enhanced operational oversight.

  • Market trends are defined by the convergence of intelligent technology and operational demands. The adoption of an IIoT enabled safety device is transforming static barriers into dynamic data points, a core tenet of smart factory safety integration. This allows automated industrial gate systems to communicate directly with a safety PLC integration infrastructure, creating responsive workplace safety barrier systems.
  • The electronic interlock system is now a standard expectation in automated environments, managed by an automated gate controller to ensure machinery is halted before access is granted. This shift elevates safety from a passive measure to an active, integral component of production control, where integrated systems can boost operational visibility by over 40%.

What challenges does the Industrial Safety Gates Industry face during its growth?

  • The high initial capital outlay required for compliant systems and pronounced cost sensitivity among small and medium-sized enterprises (SMEs) present a key challenge to market growth.

  • Key challenges center on cost, complexity, and customization. The need for custom safety fabrication, particularly for specialized applications like washdown environment gates or retrofitting a high-traffic industrial doorway, can increase costs significantly. While a mezzanine safety gate offers crucial loading dock fall protection, the initial investment can be a barrier for smaller enterprises.
  • Integrating systems to achieve a specific safety integrity level (sil) adds complexity, moving beyond a simple aluminum safety barrier installation to a full engineering project. This dynamic creates a market tension where the demand for high-performance, tailored solutions often conflicts with budget constraints, slowing adoption in price-sensitive segments.

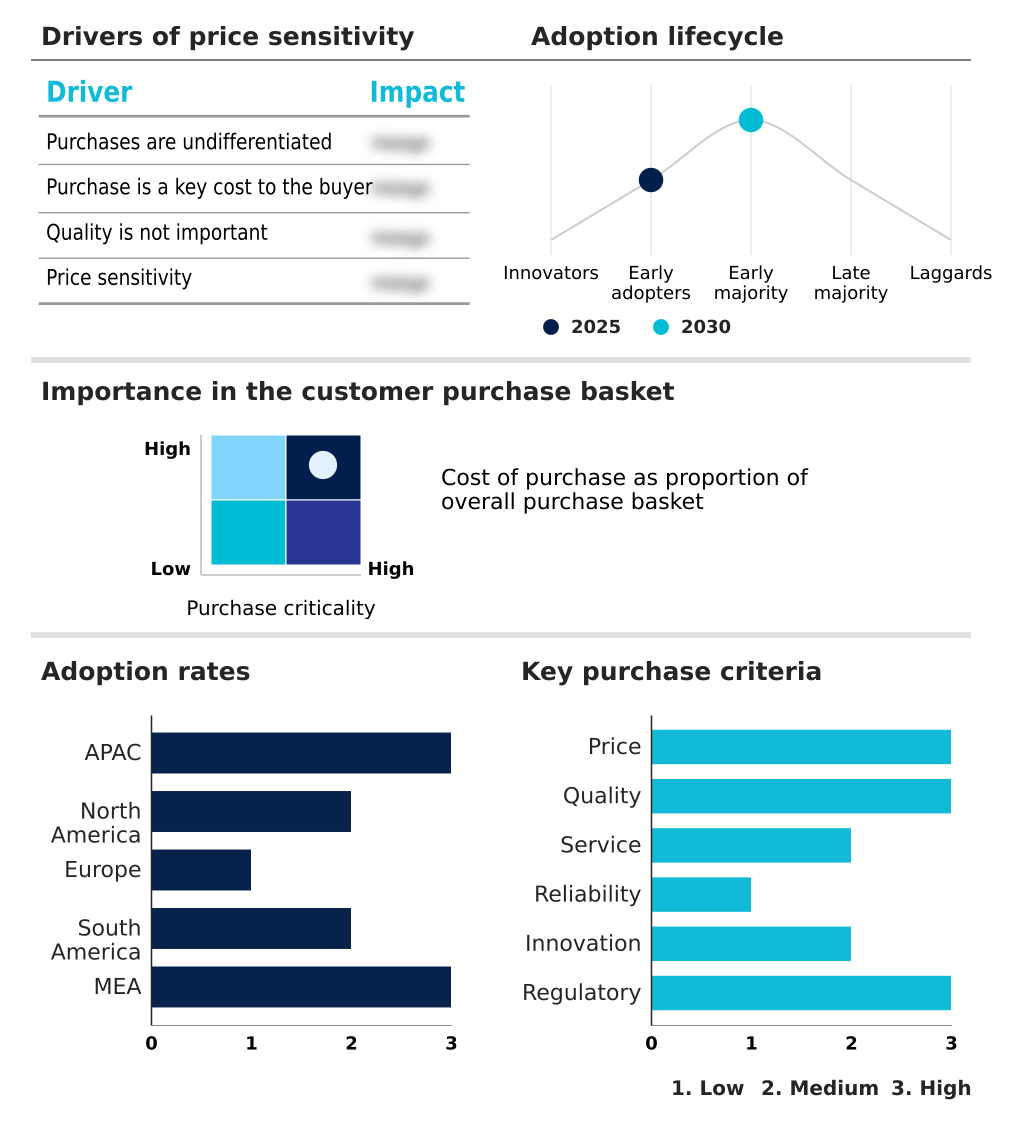
Exclusive Technavio Analysis on Customer Landscape

The industrial safety gates market forecasting report includes the adoption lifecycle of the market, covering from the innovator’s stage to the laggard’s stage. It focuses on adoption rates in different regions based on penetration. Furthermore, the industrial safety gates market report also includes key purchase criteria and drivers of price sensitivity to help companies evaluate and develop their market growth analysis strategies.

Customer Landscape of Industrial Safety Gates Industry

Competitive Landscape

Companies are implementing various strategies, such as strategic alliances, industrial safety gates market forecast, partnerships, mergers and acquisitions, geographical expansion, and product/service launches, to enhance their presence in the industry.

Abbey Gates - Focused on modular fall protection systems and self-closing safety gate solutions engineered for regulatory compliance on elevated work surfaces and rooftops.

The industry research and growth report includes detailed analyses of the competitive landscape of the market and information about key companies, including:

  • Abbey Gates
  • Ametco Manufacturing Corp.
  • ASSA ABLOY AB
  • Avians Technology Pvt Ltd.
  • Avon Barrier Corp. Ltd.
  • Benko Products Inc.
  • FAAC Spa
  • Fabenco Inc.
  • Frontier Pitts Ltd.
  • Intrepid Industries Inc.
  • Kee Safety Inc.
  • Mezzanine Safeti Gates Inc.
  • Proactive Group Australia
  • Procter Brothers Ltd.
  • PS Industries Inc.
  • Safety Rail Co. LLC
  • Tymetal
  • U.S. Netting Inc.
  • Wilcox Door Service

Qualitative and quantitative analysis of companies has been conducted to help clients understand the wider business environment as well as the strengths and weaknesses of key industry players. Data is qualitatively analyzed to categorize companies as pure play, category-focused, industry-focused, and diversified; it is quantitatively analyzed to categorize companies as dominant, leading, strong, tentative, and weak.

Recent Development and News in Industrial safety gates market

  • In September, 2024, a leading European safety solutions provider announced a strategic partnership with a robotics integrator to develop pre-certified safety cells featuring integrated smart gates for the automotive EV sector.
  • In November, 2024, a North American manufacturer specializing in fall protection launched a new line of IIoT-enabled mezzanine safety gates, allowing facility managers to monitor usage and operational status remotely via a cloud dashboard.
  • In January, 2025, a major industrial conglomerate completed its acquisition of a niche German firm known for its high-performance, SIL-rated automated vertical lift gates, signaling a strategic move into advanced machine guarding.
  • In April, 2025, the US Occupational Safety and Health Administration (OSHA) announced a new Regional Emphasis Program for the food processing industry, focusing on machine guarding and hygienic design, increasing scrutiny on compliant access control.

Dive into Technavio’s robust research methodology, blending expert interviews, extensive data synthesis, and validated models for unparalleled Industrial Safety Gates Market insights. See full methodology.

Market Scope
Page number 309
Base year 2025
Historic period 2020-2024
Forecast period 2026-2030
Growth momentum & CAGR Accelerate at a CAGR of 5.7%
Market growth 2026-2030 USD 172.6 million
Market structure Fragmented
YoY growth 2025-2026(%) 5.6%
Key countries China, India, Japan, South Korea, Australia, Indonesia, US, Canada, Mexico, Germany, UK, France, Italy, The Netherlands, Spain, Brazil, Argentina, Colombia, South Africa, Saudi Arabia, UAE, Israel and Turkey
Competitive landscape Leading Companies, Market Positioning of Companies, Competitive Strategies, and Industry Risks

Request Free Sample

Research Analyst Overview

  • The industrial safety gates market is evolving from providing simple physical barriers to offering integrated safety systems, a shift compelling boardroom-level strategic reassessment. Core to this is the imperative for machine guarding compliance and achieving certified fall protection, driven by stringent regulations like the OSHA 1910.29 standard and ANSI Z359 compliance.
  • Investment decisions are increasingly focused on solutions like a self-closing safety gate or a specialized mezzanine safety gate that offer demonstrable ROI through accident prevention. The rise of automation necessitates advanced electronic interlock system technology and seamless safety plc integration.
  • Modern facilities demand a modular guarding system using materials from durable powder-coated steel construction to lightweight aluminum safety barrier options and even hygienic design gate variants. The technology is advancing with the interlocking access gate, automated gate controller, and IIoT enabled safety device, all rated for a specific performance level (pl) rating or safety integrity level (sil).
  • Whether deploying a swing gate mechanism or a vertical lift gate actuator for an industrial pallet gate, the focus is on a holistic safety architecture.

What are the Key Data Covered in this Industrial Safety Gates Market Research and Growth Report?

  • What is the expected growth of the Industrial Safety Gates Market between 2026 and 2030?

    • USD 172.6 million, at a CAGR of 5.7%

  • What segmentation does the market report cover?

    • The report is segmented by Product (Swing gates, Vertical lift gates, and Others), Distribution Channel (Direct sales, and Indirect sales), Application (Manufacturing facilities, Warehouses, Construction Sites, and Others), Type (Manual, and Automatic) and Geography (APAC, North America, Europe, South America, Middle East and Africa)

  • Which regions are analyzed in the report?

    • APAC, North America, Europe, South America and Middle East and Africa

  • What are the key growth drivers and market challenges?

    • Proliferation of stringent occupational safety regulations and heightened enforcement, High initial capital outlay and cost sensitivity among small and medium-sized enterprises (SMEs)

  • Who are the major players in the Industrial Safety Gates Market?

    • Abbey Gates, Ametco Manufacturing Corp., ASSA ABLOY AB, Avians Technology Pvt Ltd., Avon Barrier Corp. Ltd., Benko Products Inc., FAAC Spa, Fabenco Inc., Frontier Pitts Ltd., Intrepid Industries Inc., Kee Safety Inc., Mezzanine Safeti Gates Inc., Proactive Group Australia, Procter Brothers Ltd., PS Industries Inc., Safety Rail Co. LLC, Tymetal, U.S. Netting Inc. and Wilcox Door Service

Market Research Insights

  • Market dynamics are increasingly shaped by the integration of automated industrial gate systems into broader facility safety infrastructure. Companies implementing smart factory safety integration report that networked gates can reduce safety-related production stoppages by up to 20% compared to non-integrated systems.
  • The shift towards ergonomic gate design also shows tangible benefits, with facilities seeing a 15% reduction in minor incidents related to operator strain or awkward access. As businesses deploy more high-traffic industrial doorway solutions, the focus on durability and custom safety fabrication for specific washdown environment gates or other unique needs intensifies.
  • This is driven by a clear business case: a comprehensive approach to machinery access management, combining physical barriers with intelligent controls, delivers a significantly higher return on investment through enhanced uptime and risk mitigation than piecemeal safety implementations.

We can help! Our analysts can customize this industrial safety gates market research report to meet your requirements.

Get in touch

1. Executive Summary

1.1 Market overview

Executive Summary - Chart on Market Overview
Executive Summary - Data Table on Market Overview
Executive Summary - Chart on Global Market Characteristics
Executive Summary - Chart on Market by Geography
Executive Summary - Chart on Market Segmentation by Product
Executive Summary - Chart on Market Segmentation by Distribution Channel
Executive Summary - Chart on Market Segmentation by Application
Executive Summary - Chart on Market Segmentation by Type
Executive Summary - Chart on Incremental Growth
Executive Summary - Data Table on Incremental Growth
Executive Summary - Chart on Company Market Positioning

2. Technavio Analysis

2.1 Analysis of price sensitivity, lifecycle, customer purchase basket, adoption rates, and purchase criteria

2.2 Criticality of inputs and Factors of differentiation

Chart on Overview on criticality of inputs and factors of differentiation

2.3 Factors of disruption

Chart on Overview on factors of disruption

2.4 Impact of drivers and challenges

Chart on Impact of drivers and challenges in 2025 and 2030

3. Market Landscape

3.1 Market ecosystem

Chart on Parent Market
Data Table on - Parent Market

3.2 Market characteristics

Chart on Market characteristics analysis

3.3 Value chain analysis

Chart on Value chain analysis

4. Market Sizing

4.1 Market definition

Data Table on Offerings of companies included in the market definition

4.2 Market segment analysis

Market segments

4.3 Market size 2025

4.4 Market outlook: Forecast for 2025-2030

Chart on Global - Market size and forecast 2025-2030 ($ million)
Data Table on Global - Market size and forecast 2025-2030 ($ million)
Chart on Global Market: Year-over-year growth 2025-2030 (%)
Data Table on Global Market: Year-over-year growth 2025-2030 (%)

5. Historic Market Size

5.1 Global Industrial Safety Gates Market 2020 - 2024

Historic Market Size - Data Table on Global Industrial Safety Gates Market 2020 - 2024 ($ million)

5.2 Product segment analysis 2020 - 2024

Historic Market Size - Product Segment 2020 - 2024 ($ million)

5.3 Distribution Channel segment analysis 2020 - 2024

Historic Market Size - Distribution Channel Segment 2020 - 2024 ($ million)

5.4 Application segment analysis 2020 - 2024

Historic Market Size - Application Segment 2020 - 2024 ($ million)

5.5 Type segment analysis 2020 - 2024

Historic Market Size - Type Segment 2020 - 2024 ($ million)

5.6 Geography segment analysis 2020 - 2024

Historic Market Size - Geography Segment 2020 - 2024 ($ million)

5.7 Country segment analysis 2020 - 2024

Historic Market Size - Country Segment 2020 - 2024 ($ million)

6. Qualitative Analysis

6.1 Impact of AI on the Global Industrial Safety Gates Market

7. Five Forces Analysis

7.1 Five forces summary

Five forces analysis - Comparison between 2025 and 2030

7.2 Bargaining power of buyers

Bargaining power of buyers - Impact of key factors 2025 and 2030

7.3 Bargaining power of suppliers

Bargaining power of suppliers - Impact of key factors in 2025 and 2030

7.4 Threat of new entrants

Threat of new entrants - Impact of key factors in 2025 and 2030

7.5 Threat of substitutes

Threat of substitutes - Impact of key factors in 2025 and 2030

7.6 Threat of rivalry

Threat of rivalry - Impact of key factors in 2025 and 2030

7.7 Market condition

Chart on Market condition - Five forces 2025 and 2030

8. Market Segmentation by Product

8.1 Market segments

Chart on Product - Market share 2025-2030 (%)
Data Table on Product - Market share 2025-2030 (%)

8.2 Comparison by Product

Chart on Comparison by Product
Data Table on Comparison by Product

8.3 Swing gates - Market size and forecast 2025-2030

Chart on Swing gates - Market size and forecast 2025-2030 ($ million)
Data Table on Swing gates - Market size and forecast 2025-2030 ($ million)
Chart on Swing gates - Year-over-year growth 2025-2030 (%)
Data Table on Swing gates - Year-over-year growth 2025-2030 (%)

8.4 Vertical lift gates - Market size and forecast 2025-2030

Chart on Vertical lift gates - Market size and forecast 2025-2030 ($ million)
Data Table on Vertical lift gates - Market size and forecast 2025-2030 ($ million)
Chart on Vertical lift gates - Year-over-year growth 2025-2030 (%)
Data Table on Vertical lift gates - Year-over-year growth 2025-2030 (%)

8.5 Others - Market size and forecast 2025-2030

Chart on Others - Market size and forecast 2025-2030 ($ million)
Data Table on Others - Market size and forecast 2025-2030 ($ million)
Chart on Others - Year-over-year growth 2025-2030 (%)
Data Table on Others - Year-over-year growth 2025-2030 (%)

8.6 Market opportunity by Product

Market opportunity by Product ($ million)
Data Table on Market opportunity by Product ($ million)

9. Market Segmentation by Distribution Channel

9.1 Market segments

Chart on Distribution Channel - Market share 2025-2030 (%)
Data Table on Distribution Channel - Market share 2025-2030 (%)

9.2 Comparison by Distribution Channel

Chart on Comparison by Distribution Channel
Data Table on Comparison by Distribution Channel

9.3 Direct sales - Market size and forecast 2025-2030

Chart on Direct sales - Market size and forecast 2025-2030 ($ million)
Data Table on Direct sales - Market size and forecast 2025-2030 ($ million)
Chart on Direct sales - Year-over-year growth 2025-2030 (%)
Data Table on Direct sales - Year-over-year growth 2025-2030 (%)

9.4 Indirect sales - Market size and forecast 2025-2030

Chart on Indirect sales - Market size and forecast 2025-2030 ($ million)
Data Table on Indirect sales - Market size and forecast 2025-2030 ($ million)
Chart on Indirect sales - Year-over-year growth 2025-2030 (%)
Data Table on Indirect sales - Year-over-year growth 2025-2030 (%)

9.5 Market opportunity by Distribution Channel

Market opportunity by Distribution Channel ($ million)
Data Table on Market opportunity by Distribution Channel ($ million)

10. Market Segmentation by Application

10.1 Market segments

Chart on Application - Market share 2025-2030 (%)
Data Table on Application - Market share 2025-2030 (%)

10.2 Comparison by Application

Chart on Comparison by Application
Data Table on Comparison by Application

10.3 Manufacturing facilities - Market size and forecast 2025-2030

Chart on Manufacturing facilities - Market size and forecast 2025-2030 ($ million)
Data Table on Manufacturing facilities - Market size and forecast 2025-2030 ($ million)
Chart on Manufacturing facilities - Year-over-year growth 2025-2030 (%)
Data Table on Manufacturing facilities - Year-over-year growth 2025-2030 (%)

10.4 Warehouses - Market size and forecast 2025-2030

Chart on Warehouses - Market size and forecast 2025-2030 ($ million)
Data Table on Warehouses - Market size and forecast 2025-2030 ($ million)
Chart on Warehouses - Year-over-year growth 2025-2030 (%)
Data Table on Warehouses - Year-over-year growth 2025-2030 (%)

10.5 Construction Sites - Market size and forecast 2025-2030

Chart on Construction Sites - Market size and forecast 2025-2030 ($ million)
Data Table on Construction Sites - Market size and forecast 2025-2030 ($ million)
Chart on Construction Sites - Year-over-year growth 2025-2030 (%)
Data Table on Construction Sites - Year-over-year growth 2025-2030 (%)

10.6 Others - Market size and forecast 2025-2030

Chart on Others - Market size and forecast 2025-2030 ($ million)
Data Table on Others - Market size and forecast 2025-2030 ($ million)
Chart on Others - Year-over-year growth 2025-2030 (%)
Data Table on Others - Year-over-year growth 2025-2030 (%)

10.7 Market opportunity by Application

Market opportunity by Application ($ million)
Data Table on Market opportunity by Application ($ million)

11. Market Segmentation by Type

11.1 Market segments

Chart on Type - Market share 2025-2030 (%)
Data Table on Type - Market share 2025-2030 (%)

11.2 Comparison by Type

Chart on Comparison by Type
Data Table on Comparison by Type

11.3 Manual - Market size and forecast 2025-2030

Chart on Manual - Market size and forecast 2025-2030 ($ million)
Data Table on Manual - Market size and forecast 2025-2030 ($ million)
Chart on Manual - Year-over-year growth 2025-2030 (%)
Data Table on Manual - Year-over-year growth 2025-2030 (%)

11.4 Automatic - Market size and forecast 2025-2030

Chart on Automatic - Market size and forecast 2025-2030 ($ million)
Data Table on Automatic - Market size and forecast 2025-2030 ($ million)
Chart on Automatic - Year-over-year growth 2025-2030 (%)
Data Table on Automatic - Year-over-year growth 2025-2030 (%)

11.5 Market opportunity by Type

Market opportunity by Type ($ million)
Data Table on Market opportunity by Type ($ million)

12. Customer Landscape

12.1 Customer landscape overview

Analysis of price sensitivity, lifecycle, customer purchase basket, adoption rates, and purchase criteria

13. Geographic Landscape

13.1 Geographic segmentation

Chart on Market share by geography 2025-2030 (%)
Data Table on Market share by geography 2025-2030 (%)

13.2 Geographic comparison

Chart on Geographic comparison
Data Table on Geographic comparison

13.3 APAC - Market size and forecast 2025-2030

Chart on APAC - Market size and forecast 2025-2030 ($ million)
Data Table on APAC - Market size and forecast 2025-2030 ($ million)
Chart on APAC - Year-over-year growth 2025-2030 (%)
Data Table on APAC - Year-over-year growth 2025-2030 (%)
Chart on Regional Comparison - APAC
Data Table on Regional Comparison - APAC

13.3.1 China - Market size and forecast 2025-2030

Chart on China - Market size and forecast 2025-2030 ($ million)
Data Table on China - Market size and forecast 2025-2030 ($ million)
Chart on China - Year-over-year growth 2025-2030 (%)
Data Table on China - Year-over-year growth 2025-2030 (%)

13.3.2 India - Market size and forecast 2025-2030

Chart on India - Market size and forecast 2025-2030 ($ million)
Data Table on India - Market size and forecast 2025-2030 ($ million)
Chart on India - Year-over-year growth 2025-2030 (%)
Data Table on India - Year-over-year growth 2025-2030 (%)

13.3.3 Japan - Market size and forecast 2025-2030

Chart on Japan - Market size and forecast 2025-2030 ($ million)
Data Table on Japan - Market size and forecast 2025-2030 ($ million)
Chart on Japan - Year-over-year growth 2025-2030 (%)
Data Table on Japan - Year-over-year growth 2025-2030 (%)

13.3.4 South Korea - Market size and forecast 2025-2030

Chart on South Korea - Market size and forecast 2025-2030 ($ million)
Data Table on South Korea - Market size and forecast 2025-2030 ($ million)
Chart on South Korea - Year-over-year growth 2025-2030 (%)
Data Table on South Korea - Year-over-year growth 2025-2030 (%)

13.3.5 Australia - Market size and forecast 2025-2030

Chart on Australia - Market size and forecast 2025-2030 ($ million)
Data Table on Australia - Market size and forecast 2025-2030 ($ million)
Chart on Australia - Year-over-year growth 2025-2030 (%)
Data Table on Australia - Year-over-year growth 2025-2030 (%)

13.3.6 Indonesia - Market size and forecast 2025-2030

Chart on Indonesia - Market size and forecast 2025-2030 ($ million)
Data Table on Indonesia - Market size and forecast 2025-2030 ($ million)
Chart on Indonesia - Year-over-year growth 2025-2030 (%)
Data Table on Indonesia - Year-over-year growth 2025-2030 (%)

13.4 North America - Market size and forecast 2025-2030

Chart on North America - Market size and forecast 2025-2030 ($ million)
Data Table on North America - Market size and forecast 2025-2030 ($ million)
Chart on North America - Year-over-year growth 2025-2030 (%)
Data Table on North America - Year-over-year growth 2025-2030 (%)
Chart on Regional Comparison - North America
Data Table on Regional Comparison - North America

13.4.1 US - Market size and forecast 2025-2030

Chart on US - Market size and forecast 2025-2030 ($ million)
Data Table on US - Market size and forecast 2025-2030 ($ million)
Chart on US - Year-over-year growth 2025-2030 (%)
Data Table on US - Year-over-year growth 2025-2030 (%)

13.4.2 Canada - Market size and forecast 2025-2030

Chart on Canada - Market size and forecast 2025-2030 ($ million)
Data Table on Canada - Market size and forecast 2025-2030 ($ million)
Chart on Canada - Year-over-year growth 2025-2030 (%)
Data Table on Canada - Year-over-year growth 2025-2030 (%)

13.4.3 Mexico - Market size and forecast 2025-2030

Chart on Mexico - Market size and forecast 2025-2030 ($ million)
Data Table on Mexico - Market size and forecast 2025-2030 ($ million)
Chart on Mexico - Year-over-year growth 2025-2030 (%)
Data Table on Mexico - Year-over-year growth 2025-2030 (%)

13.5 Europe - Market size and forecast 2025-2030

Chart on Europe - Market size and forecast 2025-2030 ($ million)
Data Table on Europe - Market size and forecast 2025-2030 ($ million)
Chart on Europe - Year-over-year growth 2025-2030 (%)
Data Table on Europe - Year-over-year growth 2025-2030 (%)
Chart on Regional Comparison - Europe
Data Table on Regional Comparison - Europe

13.5.1 Germany - Market size and forecast 2025-2030

Chart on Germany - Market size and forecast 2025-2030 ($ million)
Data Table on Germany - Market size and forecast 2025-2030 ($ million)
Chart on Germany - Year-over-year growth 2025-2030 (%)
Data Table on Germany - Year-over-year growth 2025-2030 (%)

13.5.2 UK - Market size and forecast 2025-2030

Chart on UK - Market size and forecast 2025-2030 ($ million)
Data Table on UK - Market size and forecast 2025-2030 ($ million)
Chart on UK - Year-over-year growth 2025-2030 (%)
Data Table on UK - Year-over-year growth 2025-2030 (%)

13.5.3 France - Market size and forecast 2025-2030

Chart on France - Market size and forecast 2025-2030 ($ million)
Data Table on France - Market size and forecast 2025-2030 ($ million)
Chart on France - Year-over-year growth 2025-2030 (%)
Data Table on France - Year-over-year growth 2025-2030 (%)

13.5.4 Italy - Market size and forecast 2025-2030

Chart on Italy - Market size and forecast 2025-2030 ($ million)
Data Table on Italy - Market size and forecast 2025-2030 ($ million)
Chart on Italy - Year-over-year growth 2025-2030 (%)
Data Table on Italy - Year-over-year growth 2025-2030 (%)

13.5.5 The Netherlands - Market size and forecast 2025-2030

Chart on The Netherlands - Market size and forecast 2025-2030 ($ million)
Data Table on The Netherlands - Market size and forecast 2025-2030 ($ million)
Chart on The Netherlands - Year-over-year growth 2025-2030 (%)
Data Table on The Netherlands - Year-over-year growth 2025-2030 (%)

13.5.6 Spain - Market size and forecast 2025-2030

Chart on Spain - Market size and forecast 2025-2030 ($ million)
Data Table on Spain - Market size and forecast 2025-2030 ($ million)
Chart on Spain - Year-over-year growth 2025-2030 (%)
Data Table on Spain - Year-over-year growth 2025-2030 (%)

13.6 South America - Market size and forecast 2025-2030

Chart on South America - Market size and forecast 2025-2030 ($ million)
Data Table on South America - Market size and forecast 2025-2030 ($ million)
Chart on South America - Year-over-year growth 2025-2030 (%)
Data Table on South America - Year-over-year growth 2025-2030 (%)
Chart on Regional Comparison - South America
Data Table on Regional Comparison - South America

13.6.1 Brazil - Market size and forecast 2025-2030

Chart on Brazil - Market size and forecast 2025-2030 ($ million)
Data Table on Brazil - Market size and forecast 2025-2030 ($ million)
Chart on Brazil - Year-over-year growth 2025-2030 (%)
Data Table on Brazil - Year-over-year growth 2025-2030 (%)

13.6.2 Argentina - Market size and forecast 2025-2030

Chart on Argentina - Market size and forecast 2025-2030 ($ million)
Data Table on Argentina - Market size and forecast 2025-2030 ($ million)
Chart on Argentina - Year-over-year growth 2025-2030 (%)
Data Table on Argentina - Year-over-year growth 2025-2030 (%)

13.6.3 Colombia - Market size and forecast 2025-2030

Chart on Colombia - Market size and forecast 2025-2030 ($ million)
Data Table on Colombia - Market size and forecast 2025-2030 ($ million)
Chart on Colombia - Year-over-year growth 2025-2030 (%)
Data Table on Colombia - Year-over-year growth 2025-2030 (%)

13.7 Middle East and Africa - Market size and forecast 2025-2030

Chart on Middle East and Africa - Market size and forecast 2025-2030 ($ million)
Data Table on Middle East and Africa - Market size and forecast 2025-2030 ($ million)
Chart on Middle East and Africa - Year-over-year growth 2025-2030 (%)
Data Table on Middle East and Africa - Year-over-year growth 2025-2030 (%)
Chart on Regional Comparison - Middle East and Africa
Data Table on Regional Comparison - Middle East and Africa

13.7.1 South Africa - Market size and forecast 2025-2030

Chart on South Africa - Market size and forecast 2025-2030 ($ million)
Data Table on South Africa - Market size and forecast 2025-2030 ($ million)
Chart on South Africa - Year-over-year growth 2025-2030 (%)
Data Table on South Africa - Year-over-year growth 2025-2030 (%)

13.7.2 Saudi Arabia - Market size and forecast 2025-2030

Chart on Saudi Arabia - Market size and forecast 2025-2030 ($ million)
Data Table on Saudi Arabia - Market size and forecast 2025-2030 ($ million)
Chart on Saudi Arabia - Year-over-year growth 2025-2030 (%)
Data Table on Saudi Arabia - Year-over-year growth 2025-2030 (%)

13.7.3 UAE - Market size and forecast 2025-2030

Chart on UAE - Market size and forecast 2025-2030 ($ million)
Data Table on UAE - Market size and forecast 2025-2030 ($ million)
Chart on UAE - Year-over-year growth 2025-2030 (%)
Data Table on UAE - Year-over-year growth 2025-2030 (%)

13.7.4 Israel - Market size and forecast 2025-2030

Chart on Israel - Market size and forecast 2025-2030 ($ million)
Data Table on Israel - Market size and forecast 2025-2030 ($ million)
Chart on Israel - Year-over-year growth 2025-2030 (%)
Data Table on Israel - Year-over-year growth 2025-2030 (%)

13.7.5 Turkey - Market size and forecast 2025-2030

Chart on Turkey - Market size and forecast 2025-2030 ($ million)
Data Table on Turkey - Market size and forecast 2025-2030 ($ million)
Chart on Turkey - Year-over-year growth 2025-2030 (%)
Data Table on Turkey - Year-over-year growth 2025-2030 (%)

13.8 Market opportunity by geography

Market opportunity by geography ($ million)
Data Tables on Market opportunity by geography ($ million)

14. Drivers, Challenges, and Opportunity

14.1 Market drivers

Proliferation of stringent occupational safety regulations and heightened enforcement
Accelerating adoption of industrial automation and human-robot collaboration
Growing corporate emphasis on workplace safety culture and indirect cost mitigation

14.2 Market challenges

High initial capital outlay and cost sensitivity among small and medium-sized enterprises (SMEs)
Increasing complexity of system integration in advanced manufacturing environments
Competition from low-cost, non-compliant products and deficits in end-user awareness

14.3 Impact of drivers and challenges

Impact of drivers and challenges in 2025 and 2030

14.4 Market opportunities

Proliferation of smart technology and industrial internet of things (IIoT) integration
Growing demand for modular, ergonomic, and customizable gate solutions
Intensifying regulatory scrutiny and shift towards comprehensive safety ecosystems

15. Competitive Landscape

15.1 Overview

15.2

Overview on criticality of inputs and factors of differentiation

15.3 Landscape disruption

Overview on factors of disruption

15.4 Industry risks

Impact of key risks on business

16. Competitive Analysis

16.1 Companies profiled

Companies covered

16.2 Company ranking index

16.3 Market positioning of companies

Matrix on companies position and classification

16.4 Abbey Gates

Abbey Gates - Overview
Abbey Gates - Product / Service
Abbey Gates - Key offerings
SWOT

16.5 Ametco Manufacturing Corp.

Ametco Manufacturing Corp. - Overview
Ametco Manufacturing Corp. - Product / Service
Ametco Manufacturing Corp. - Key offerings
SWOT

16.6 ASSA ABLOY AB

ASSA ABLOY AB - Overview
ASSA ABLOY AB - Business segments
ASSA ABLOY AB - Key news
ASSA ABLOY AB - Key offerings
ASSA ABLOY AB - Segment focus
SWOT

16.7 Avians Technology Pvt Ltd.

Avians Technology Pvt Ltd. - Overview
Avians Technology Pvt Ltd. - Product / Service
Avians Technology Pvt Ltd. - Key offerings
SWOT

16.8 Benko Products Inc.

Benko Products Inc. - Overview
Benko Products Inc. - Product / Service
Benko Products Inc. - Key offerings
SWOT

16.9 Fabenco Inc.

Fabenco Inc. - Overview
Fabenco Inc. - Product / Service
Fabenco Inc. - Key offerings
SWOT

16.10 Frontier Pitts Ltd.

Frontier Pitts Ltd. - Overview
Frontier Pitts Ltd. - Product / Service
Frontier Pitts Ltd. - Key offerings
SWOT

16.11 Kee Safety Inc.

Kee Safety Inc. - Overview
Kee Safety Inc. - Product / Service
Kee Safety Inc. - Key offerings
SWOT

16.12 Mezzanine Safeti Gates Inc.

Mezzanine Safeti Gates Inc. - Overview
Mezzanine Safeti Gates Inc. - Product / Service
Mezzanine Safeti Gates Inc. - Key offerings
SWOT

16.13 Procter Brothers Ltd.

Procter Brothers Ltd. - Overview
Procter Brothers Ltd. - Product / Service
Procter Brothers Ltd. - Key offerings
SWOT

16.14 PS Industries Inc.

PS Industries Inc. - Overview
PS Industries Inc. - Product / Service
PS Industries Inc. - Key offerings
SWOT

16.15 Safety Rail Co. LLC

Safety Rail Co. LLC - Overview
Safety Rail Co. LLC - Product / Service
Safety Rail Co. LLC - Key offerings
SWOT

16.16 Tymetal

Tymetal - Overview
Tymetal - Product / Service
Tymetal - Key offerings
SWOT

16.17 U.S. Netting Inc.

U.S. Netting Inc. - Overview
U.S. Netting Inc. - Product / Service
U.S. Netting Inc. - Key offerings
SWOT

16.18 Wilcox Door Service

Wilcox Door Service - Overview
Wilcox Door Service - Product / Service
Wilcox Door Service - Key offerings
SWOT

17. Appendix

17.1 Scope of the report

Market definition
Objectives
Notes and caveats

17.2 Inclusions and exclusions checklist

Inclusions checklist
Exclusions checklist

17.3 Currency conversion rates for US$

17.4 Research methodology

17.5 Data procurement

Information sources

17.6 Data validation

17.7 Validation techniques employed for market sizing

17.8 Data synthesis

17.9 360 degree market analysis

17.10 List of abbreviations

Research Methodology

Technavio presents a detailed picture of the market by way of study, synthesis, and summation of data from multiple sources. The analysts have presented the various facets of the market with a particular focus on identifying the key industry influencers. The data thus presented is comprehensive, reliable, and the result of extensive research, both primary and secondary.

INFORMATION SOURCES

Primary sources

  • Manufacturers and suppliers
  • Channel partners
  • Industry experts
  • Strategic decision makers

Secondary sources

  • Industry journals and periodicals
  • Government data
  • Financial reports of key industry players
  • Historical data
  • Press releases

DATA ANALYSIS

Data Synthesis

  • Collation of data
  • Estimation of key figures
  • Analysis of derived insights

Data Validation

  • Triangulation with data models
  • Reference against proprietary databases
  • Corroboration with industry experts

REPORT WRITING

Qualitative

  • Market drivers
  • Market challenges
  • Market trends
  • Five forces analysis

Quantitative

  • Market size and forecast
  • Market segmentation
  • Geographical insights
  • Competitive landscape

Interested in this report?

Get your sample now to see our research methodology and insights!

Download Now

Frequently Asked Questions

Industrial Safety Gates market growth will increase by USD 172.6 million during 2026-2030 .

The Industrial Safety Gates market is expected to grow at a CAGR of 5.7% during 2026-2030 .

Industrial Safety Gates market is segmented by Product (Swing gates, Vertical lift gates, Others) Distribution channel (Direct sales, Indirect sales) Application (Manufacturing facilities, Warehouses, Construction Sites, Others) Type (Manual, Automatic)

Abbey Gates, Ametco Manufacturing Corp., ASSA ABLOY AB, Avians Technology Pvt Ltd., Avon Barrier Corp. Ltd., Benko Products Inc., FAAC Spa, Fabenco Inc., Frontier Pitts Ltd., Intrepid Industries Inc., Kee Safety Inc., Mezzanine Safeti Gates Inc., Proactive Group Australia, Procter Brothers Ltd., PS Industries Inc., Safety Rail Co. LLC, Tymetal, U.S. Netting Inc., Wilcox Door Service are a few of the key vendors in the Industrial Safety Gates market.

APAC will register the highest growth rate of 50.9% among the other regions. Therefore, the Industrial Safety Gates market in APAC is expected to garner significant business opportunities for the vendors during the forecast period.

China, India, Japan, South Korea, Australia, Indonesia, US, Canada, Mexico, Germany, UK, France, Italy, The Netherlands, Spain, Brazil, Argentina, Colombia, South Africa, Saudi Arabia, UAE, Israel, Turkey

  • Proliferation of stringent occupational safety regulations and heightened enforcement is the driving factor this market.

The Industrial Safety Gates market vendors should focus on grabbing business opportunities from the Product segment as it accounted for the largest market share in the base year.