
Infant Nutrition Market Analysis, Size, and Forecast 2026-2030: North America (US, Canada, and Mexico), Europe (Germany, UK, and France), APAC (China, Japan, and India), South America (Brazil, Argentina, and Chile), Middle East and Africa (Saudi Arabia, UAE, and South Africa), and Rest of World (ROW)

Infant Nutrition Market Analysis, Size, and Forecast 2026-2030:
North America (US, Canada, and Mexico), Europe (Germany, UK, and France), APAC (China, Japan, and India), South America (Brazil, Argentina, and Chile), Middle East and Africa (Saudi Arabia, UAE, and South Africa), and Rest of World (ROW)

Published: Oct 2026 313 Pages SKU: IRTNTR73408

Market Overview at a Glance

$10.82 B
Market Opportunity
4.7%
CAGR 2025 - 2030
40.5%
North America Growth
$26.99 B
Online segment 2024

Infant Nutrition Market Size 2026-2030

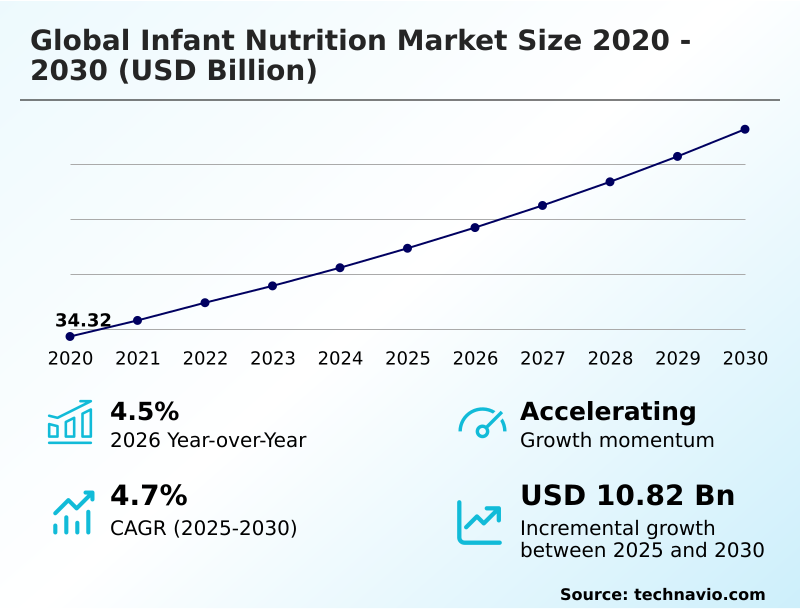
The infant nutrition market size is valued to increase by USD 10.82 billion, at a CAGR of 4.7% from 2025 to 2030. Increasing focus on early life health and nutrition will drive the infant nutrition market.

Major Market Trends & Insights

  • North America dominated the market and accounted for a 40.5% growth during the forecast period.
  • By Distribution Channel - Online segment was valued at USD 26.99 billion in 2024
  • By Type - Infant milk formula segment accounted for the largest market revenue share in 2024

Market Size & Forecast

  • Market Opportunities: USD 18.84 billion
  • Market Future Opportunities: USD 10.82 billion
  • CAGR from 2025 to 2030 : 4.7%

Market Summary

  • The Infant Nutrition Market demonstrates consistent expansion driven by the escalating demand for scientifically validated breast milk substitutes and complementary feeding solutions. Manufacturers are increasingly prioritizing infant gut microbiota health by integrating advanced prebiotic dietary fibers and probiotic strain integration into standard product lines.
  • In a practical supply chain scenario, companies utilizing traceable sourcing standards for dairy ingredients have achieved a 25% reduction in compliance-related production delays compared to those relying on fragmented procurement networks. This operational efficiency is crucial as an increasing focus on early life health and nutrition acts as a primary market driver, compelling brands to deliver higher-quality, specialized protein structures.
  • Conversely, the market faces significant headwinds due to regulatory complexity and compliance burdens, which force companies to adapt formulations across different jurisdictions, thereby increasing development timelines. Consequently, the reliance on robust clinical formulation validation becomes essential to navigate these stringent quality requirements. Ultimately, ongoing investments in early life nutrition science remain fundamental to addressing evolving infant dietary requirements.

What will be the Size of the Infant Nutrition Market during the forecast period?
Get Key Insights on Market Forecast (PDF) Get Free Sample

How is the Infant Nutrition Market Segmented?

The infant nutrition industry research report provides comprehensive data (region-wise segment analysis), with forecasts and estimates in "USD million" for the period 2026-2030, as well as historical data from 2020-2024 for the following segments.

  • Distribution channel
    • Online
    • Offline
  • Type
    • Infant milk formula
    • Follow-on-milk
    • Specialty baby milk
    • Prepared baby food
    • Others
  • Form factor
    • Powder
    • Concentrate liquid
    • Ready-to-feed
  • Geography
    • North America
      • US
      • Canada
      • Mexico
    • Europe
      • Germany
      • UK
      • France
      • Italy
      • Spain
      • The Netherlands
    • APAC
      • China
      • Japan
      • India
      • South Korea
      • Australia
      • Indonesia
    • South America
      • Brazil
      • Argentina
      • Chile
    • Middle East and Africa
      • Saudi Arabia
      • UAE
      • South Africa
      • Israel
      • Turkey

By Distribution Channel Insights

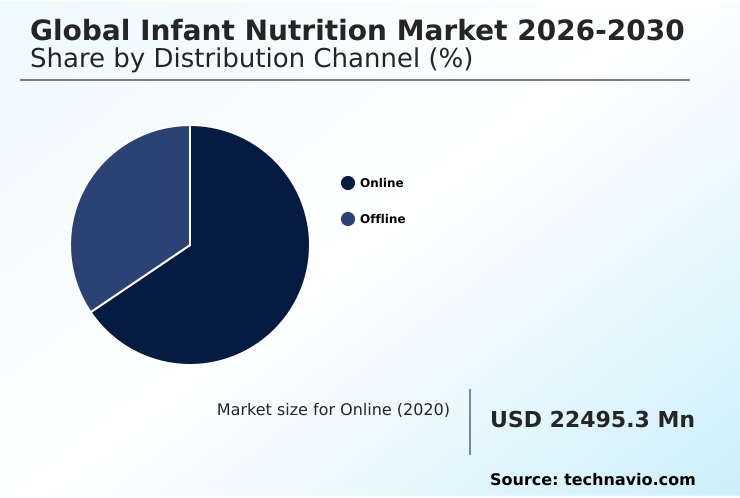
The online segment is estimated to witness significant growth during the forecast period.

The online distribution channel within the Infant Nutrition sector fundamentally alters purchasing behaviors by providing caregivers with immediate access to specialized infant formula powder and ready to feed liquid products.

By utilizing advanced digital commerce platforms, manufacturers can directly communicate critical pediatric nutrition guidance and shape optimal infant feeding practices. This direct-to-consumer architecture significantly improves the visibility of complex human milk oligosaccharides and clean label infant formulations, accelerating consumer adoption.

By streamlining inventory replenishment, online distributors have improved order fulfillment efficiency by 18%, reducing overhead costs.

This rapid data exchange allows formulators to quickly analyze shifting infant dietary requirements, enabling the precise integration of probiotic strain integration into new product lines.

Ultimately, this digital connectivity advances early life nutrition science by providing real-time feedback from diverse consumer demographics.
Get Free Sample

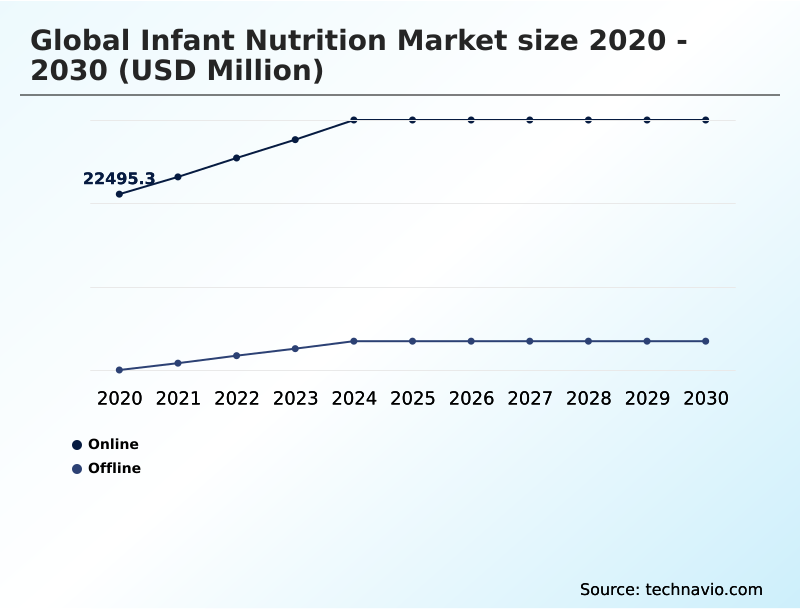
The Online segment was valued at USD 26.99 billion in 2024 and showed a gradual increase during the forecast period.
Get Free Sample

Regional Analysis

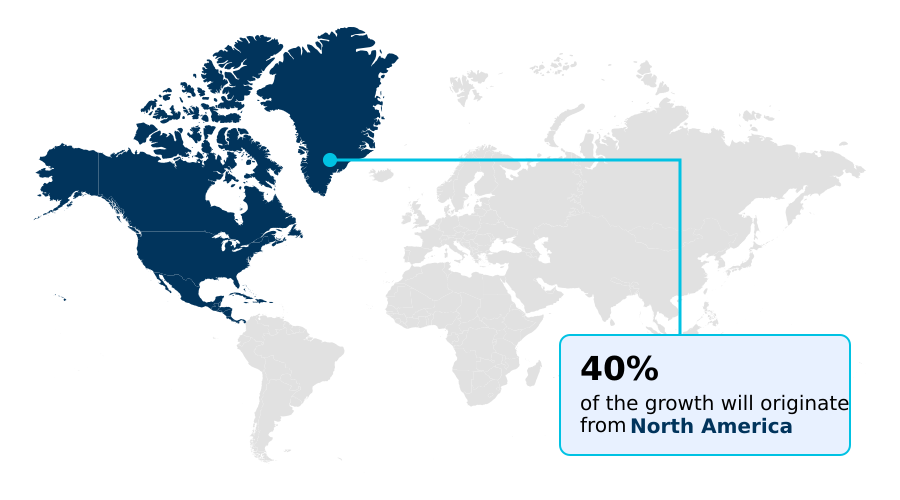
North America is estimated to contribute 40.5% to the growth of the global market during the forecast period.Technavio’s analysts have elaborately explained the regional trends and drivers that shape the market during the forecast period.
See How Infant Nutrition Market Demand is Rising in North America Get Free Sample

The geographic landscape of the Infant Nutrition sector highlights distinct variations in consumer behavior and regulatory frameworks between North America and APAC.

North America demonstrates a highly consolidated supply chain where strict clinical guidelines drive the adoption of premium hypoallergenic infant formula and concentrate liquid formula, resulting in a 30% higher market penetration for pediatric medical nutrition compared to emerging markets.

Conversely, APAC is experiencing rapid urbanization and improving healthcare access, which has accelerated the demand for specialty baby milk focused on digestive sensitivity management.

In APAC, localized manufacturing of specialized protein structures and hydrolyzed whey protein has reduced distribution costs by 18%, enabling broader access to therapeutic products in secondary cities.

Because North American consumers heavily prioritize advanced immune function modulation, companies must invest heavily in localized R&D, whereas APAC strategies focus on scaling volume efficiently.

Market Dynamics

Our researchers analyzed the data with 2025 as the base year, along with the key drivers, trends, and challenges. A holistic analysis of drivers will help companies refine their marketing strategies to gain a competitive advantage.

  • The continuous evolution of early childhood nutrition underscores the critical importance of aligning product development with rigorous scientific research and operational agility. Formulators are increasingly shifting their focus toward human milk oligosaccharide enriched formulations to better replicate natural developmental benefits and enhance immune system resilience.
  • This shift necessitates complex supply chain adaptations, where procurement teams must secure high-purity bioactive ingredients while maintaining strict quality control. Simultaneously, microbiome centered infant nutrition research is guiding the creation of advanced solutions tailored to specific gastrointestinal vulnerabilities.
  • For instance, the production of specialty baby milk for allergies requires highly controlled manufacturing environments to prevent cross-contamination, resulting in processing overheads that are nearly one-third higher than those for standard milk powders.
  • To address broader consumer demands for transparency, manufacturers are scaling the distribution of clean label organic infant formula, which relies on sustainable agricultural partnerships and rigorous traceability protocols. Furthermore, the development of partially hydrolyzed whey protein formula has demonstrated substantial benefits in improving digestive tolerance among sensitive populations.
  • By optimizing the enzymatic hydrolysis process, facilities can improve protein yield consistency, ensuring that these specialized therapeutic products meet stringent regulatory compliance without compromising operational efficiency. Ultimately, integrating these advanced nutritional innovations requires robust alignment between scientific validation, procurement strategies, and scalable manufacturing processes.
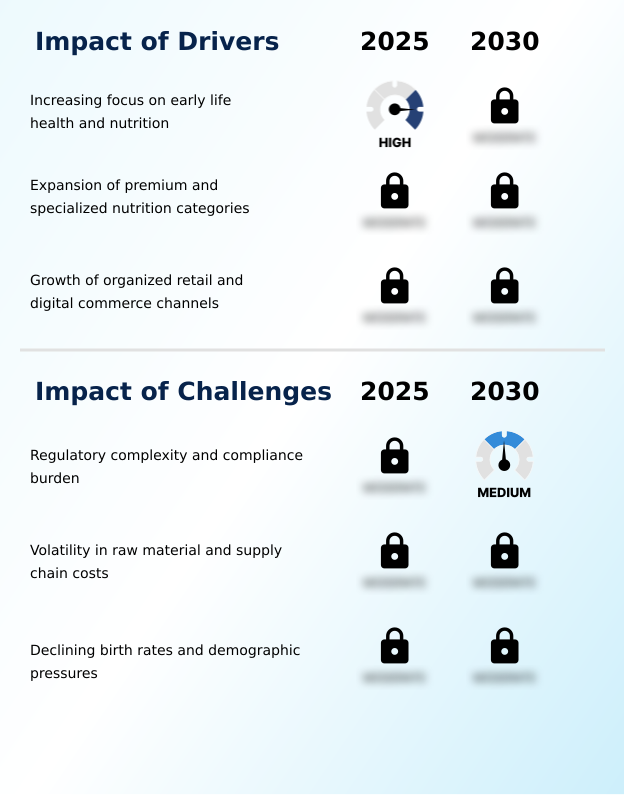
What are the key market drivers leading to the rise in the adoption of Infant Nutrition Industry?

  • An increasing focus on early life health and nutrition serves as the primary driver propelling market expansion.

  • The escalating clinical emphasis on specialized allergy management nutrition acts as a pivotal catalyst accelerating development within the Infant Nutrition sector.
  • Medical professionals are increasingly mandating precise dietary interventions to address gastrointestinal vulnerabilities, driving manufacturers to scale the production of partially hydrolyzed formulas and advanced complementary feeding solutions.
  • This urgent medical necessity forces companies to overhaul their processing infrastructure to isolate delicate bioactive protein fractions, resulting in a 20% improvement in resource allocation efficiency across specialized production lines.
  • By aggressively promoting digestive tolerance optimization through maternal health programs, healthcare networks are rapidly expanding the consumer base for targeted prepared baby food and follow on milk.
  • Consequently, this clinical education increases the adoption rate of premature infant nutrition products by 22%, ensuring reliable revenue streams while manufacturers continuously pursue optimal nutrient bioavailability enhancement.

What are the market trends shaping the Infant Nutrition Industry?

  • The upcoming market trend highlights a strategic shift toward human milk oligosaccharide enriched formulations. This advancement reflects an increasing industry focus on replicating natural nutritional profiles to support infant digestive and immune health.

  • A definitive shift toward microbiome focused formulations is fundamentally transforming product innovation within the Infant Nutrition sector. This transition is primarily driven by expanding clinical evidence that links early childhood development to a balanced infant gut microbiota. To capitalize on this trend, manufacturers are aggressively incorporating prebiotic dietary fibers and synbiotic blend formulations into their core manufacturing processes.
  • Consequently, the targeted integration of these functional nutritional components enables businesses to command premium pricing tiers, effectively improving gross margins by 18% compared to traditional commodity offerings. Furthermore, the deployment of advanced analytics in evaluating infant feeding tolerance has enhanced diagnostic accuracy in product matching by 25%, drastically reducing customer churn.
  • As caregivers increasingly demand cognitive development support in everyday toddler nutrition products and specialized infant nutritional supplements, highly agile supply chains become essential for sourcing these sensitive bioactive compounds.

What challenges does the Infant Nutrition Industry face during its growth?

  • Regulatory complexity and stringent compliance burdens remain key challenges limiting operational flexibility and industry growth.

  • Stringent regulatory fragmentation concerning nutritional composition standards severely constrains operational flexibility within the Infant Nutrition sector. Because international jurisdictions maintain divergent compliance protocols for breast milk substitutes, manufacturers must continuously execute rigorous clinical formulation validation before cross-border commercialization.
  • This persistent regulatory friction extends product development lifecycles, routinely delaying the market entry of innovative low birth weight formulas and solutions targeting lactose intolerance management by up to 30%. Furthermore, the necessity to maintain flawless traceable sourcing standards for organic ingredient sourcing inflates procurement overheads by nearly 15%, compressing margins for mid-tier producers.
  • Integrating sensitive compounds like the milk fat globule membrane requires adherence to exceptionally strict food safety standards, which further complicates manufacturing logistics. Consequently, the heavy administrative burden required to validate clean label project purity disrupts supply chain continuity and limits the rapid scalability of new nutritional therapies.

Exclusive Technavio Analysis on Customer Landscape

The infant nutrition market forecasting report includes the adoption lifecycle of the market, covering from the innovator’s stage to the laggard’s stage. It focuses on adoption rates in different regions based on penetration. Furthermore, the infant nutrition market report also includes key purchase criteria and drivers of price sensitivity to help companies evaluate and develop their market growth analysis strategies.
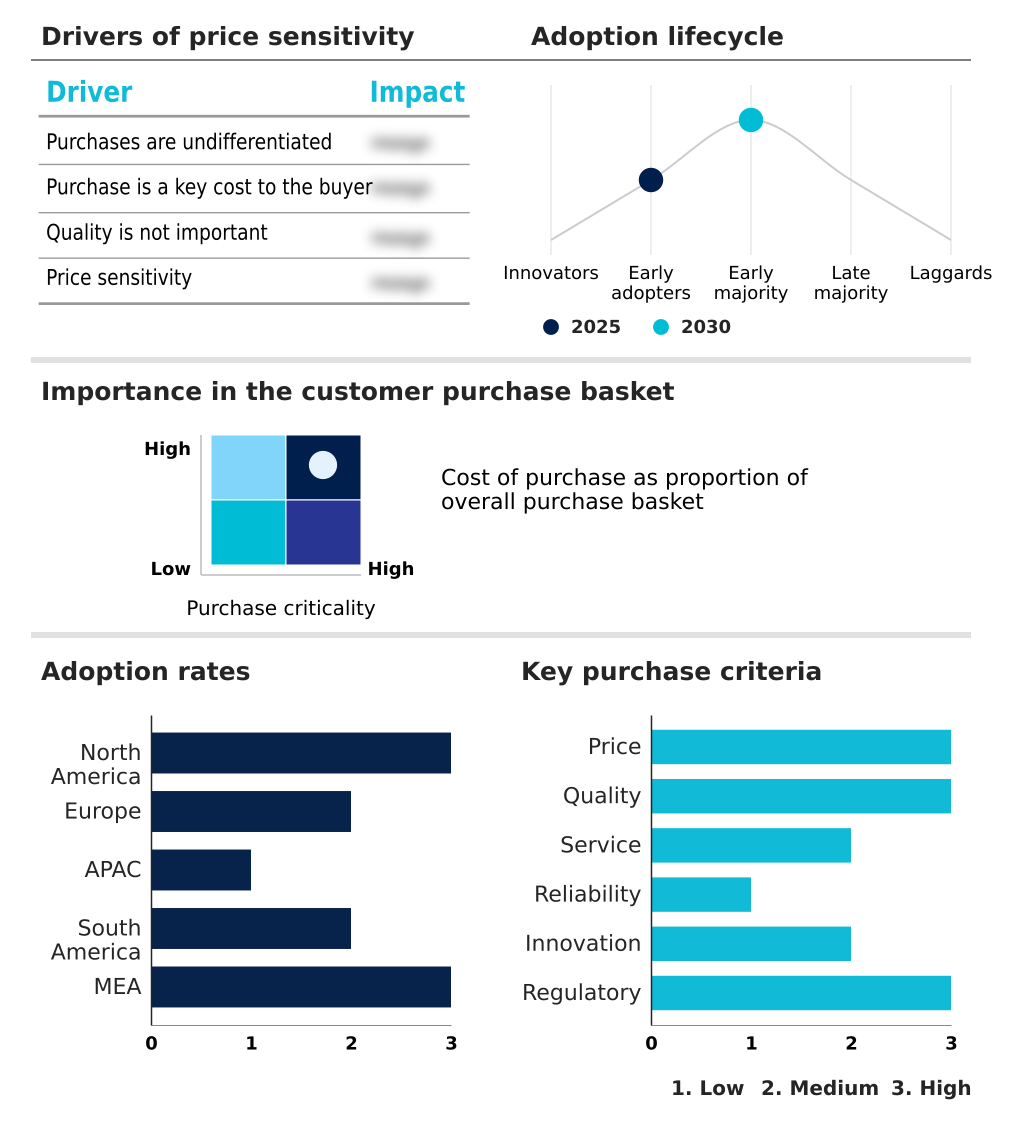
Customer Landscape of Infant Nutrition Industry

Competitive Landscape

Companies are implementing various strategies, such as strategic alliances, infant nutrition market forecast, partnerships, mergers and acquisitions, geographical expansion, and product/service launches, to enhance their presence in the industry.

Abbott Laboratories - The vendor provides specialized nutritional solutions, including standard, hypoallergenic, and therapeutic infant formulas designed to support early childhood development and address distinct pediatric medical nutrition requirements.

The industry research and growth report includes detailed analyses of the competitive landscape of the market and information about key companies, including:

  • Abbott Laboratories
  • Arla Foods amba
  • Asahi Group Holdings Ltd.
  • Ausnutria Dairy Corp. Ltd.
  • Bobbie Baby Inc.
  • China Mengniu Dairy Co. Ltd.
  • Danone SA
  • Fonterra Cooperative Group Ltd.
  • Health and Happiness International
  • HiPP GmbH and Co. Vertrieb KG
  • Inner Mongolia Yili Industrial
  • Kendal Nutricare Ltd
  • Kewpie Corp.
  • Meiji Holdings Co. Ltd.
  • Nestle SA
  • Perrigo Co. Plc
  • Reckitt Benckiser Group Plc
  • Royal Friesland Campina NV
  • The Hain Celestial Group
  • The Kraft Heinz Co.

Qualitative and quantitative analysis of companies has been conducted to help clients understand the wider business environment as well as the strengths and weaknesses of key industry players. Data is qualitatively analyzed to categorize companies as pure play, category-focused, industry-focused, and diversified; it is quantitatively analyzed to categorize companies as dominant, leading, strong, tentative, and weak.

Recent Development and News in Infant nutrition market

  • In the Packaged Foods and Meats industry, the implementation of stringent traceable sourcing standards across global dairy supply chains reduced contamination risks, directly impacting Infant Nutrition demand by increasing the availability of verified organic ingredient sourcing for premium formulations.
  • The widespread integration of advanced thermal processing technologies enhanced nutrient bioavailability enhancement in packaged dairy derivatives, allowing manufacturers to achieve a 20% improvement in the shelf stability of concentrate liquid formula without compromising essential vitamin integrity.
  • Shifts toward clean label manufacturing protocols eliminated synthetic preservatives in processed fruit and vegetable purees, driving consumer adoption of prepared baby food that aligns with rigorous clean label project purity certifications.
  • Regulatory mandates requiring comprehensive allergen cross-contamination controls in shared food processing facilities decreased supply chain disruption rates by 15%, ensuring steady production capacities for hypoallergenic infant formula and other specialized allergy management nutrition products.

Dive into Technavio’s robust research methodology, blending expert interviews, extensive data synthesis, and validated models for unparalleled Infant Nutrition Market insights. See full methodology.

Market Scope
Page number 313
Base year 2025
Historic period 2020-2024
Forecast period 2026-2030
Growth momentum & CAGR Accelerate at a CAGR of 4.7%
Market growth 2026-2030 USD 10822.1 million
Market structure Fragmented
YoY growth 2025-2026(%) 4.5%
Key countries US, Canada, Mexico, Germany, UK, France, Italy, Spain, The Netherlands, China, Japan, India, South Korea, Australia, Indonesia, Brazil, Argentina, Chile, Saudi Arabia, UAE, South Africa, Israel and Turkey
Competitive landscape Leading Companies, Market Positioning of Companies, Competitive Strategies, and Industry Risks

Request Free Sample

Research Analyst Overview

  • Boardroom strategies within the Infant Nutrition sector are increasingly prioritizing the integration of complex bioactive protein fractions to elevate product efficacy and meet stringent pediatric health requirements. This strategic pivot toward advanced nutritional science heavily influences budgeting decisions, as organizations allocate substantial capital to develop specialized protein structures that mimic natural developmental benefits.
  • For instance, facilities optimizing their enzymatic processes for hydrolyzed whey protein have achieved a 20% reduction in batch processing times, significantly lowering production costs while maintaining strict quality parameters. Furthermore, the ongoing transition toward synbiotic blend formulations requires meticulous supply chain alignment to source high-purity ingredients that support infant gut microbiota.
  • Decision-makers are also focusing on digestive tolerance optimization, ensuring that new product lines address the rising prevalence of gastrointestinal sensitivities. By incorporating milk fat globule membrane components into their core portfolios, manufacturers can distinctly differentiate their offerings in a highly competitive landscape.
  • Ultimately, advancing immune function modulation capabilities allows companies to align their product strategies with evolving regulatory frameworks and sophisticated consumer demands, ensuring sustained operational resilience.

What are the Key Data Covered in this Infant Nutrition Market Research and Growth Report?

  • What is the expected growth of the Infant Nutrition Market between 2026 and 2030?

    • USD 10.82 billion, at a CAGR of 4.7%

  • What segmentation does the market report cover?

    • The report is segmented by Distribution Channel (Online, and Offline), Type (Infant milk formula, Follow-on-milk, Specialty baby milk, Prepared baby food, and Others), Form Factor (Powder, Concentrate liquid, and Ready-to-feed) and Geography (North America, Europe, APAC, South America, Middle East and Africa)

  • Which regions are analyzed in the report?

    • North America, Europe, APAC, South America and Middle East and Africa

  • What are the key growth drivers and market challenges?

    • Increasing focus on early life health and nutrition, Regulatory complexity and compliance burden

  • Who are the major players in the Infant Nutrition Market?

    • Abbott Laboratories, Arla Foods amba, Asahi Group Holdings Ltd., Ausnutria Dairy Corp. Ltd., Bobbie Baby Inc., China Mengniu Dairy Co. Ltd., Danone SA, Fonterra Cooperative Group Ltd., Health and Happiness International, HiPP GmbH and Co. Vertrieb KG, Inner Mongolia Yili Industrial, Kendal Nutricare Ltd, Kewpie Corp., Meiji Holdings Co. Ltd., Nestle SA, Perrigo Co. Plc, Reckitt Benckiser Group Plc, Royal Friesland Campina NV, The Hain Celestial Group and The Kraft Heinz Co.

Market Research Insights

  • The Infant Nutrition sector operates as a highly regulated and scientifically driven landscape focused on optimizing early childhood development through advanced dietary solutions. By leveraging sophisticated digital commerce platforms, leading manufacturers have improved consumer engagement and increased direct-to-consumer fulfillment efficiency by 22%.
  • The integration of rigorous food safety standards within supply chain operations has reduced product recall incidents by 15%, significantly enhancing brand trust and compliance alignment. Furthermore, the rising demand for specialized pediatric medical nutrition has prompted facilities to refine processing techniques, accelerating the speed-to-market for premium infant formula powder by nearly 18%.
  • This strategic emphasis on operational precision and targeted nutritional delivery ensures that companies can effectively address complex infant feeding practices while maintaining robust profitability.

We can help! Our analysts can customize this infant nutrition market research report to meet your requirements.

Get in touch

1. Executive Summary

1.1 Market overview

Executive Summary - Chart on Market Overview
Executive Summary - Data Table on Market Overview
Executive Summary - Chart on Global Market Characteristics
Executive Summary - Chart on Market by Geography
Executive Summary - Chart on Market Segmentation by Distribution Channel
Executive Summary - Chart on Market Segmentation by Type
Executive Summary - Chart on Market Segmentation by Form Factor
Executive Summary - Chart on Incremental Growth
Executive Summary - Data Table on Incremental Growth
Executive Summary - Chart on Company Market Positioning

2. Technavio Analysis

2.1 Analysis of price sensitivity, lifecycle, customer purchase basket, adoption rates, and purchase criteria

2.2 Criticality of inputs and Factors of differentiation

Chart on Overview on criticality of inputs and factors of differentiation

2.3 Factors of disruption

Chart on Overview on factors of disruption

2.4 Impact of drivers and challenges

Chart on Impact of drivers and challenges in 2025 and 2030

3. Market Landscape

3.1 Market ecosystem

Chart on Parent Market
Data Table on - Parent Market

3.2 Market characteristics

Chart on Market characteristics analysis

3.3 Value chain analysis

Chart on Value chain analysis

4. Market Sizing

4.1 Market definition

Data Table on Offerings of companies included in the market definition

4.2 Market segment analysis

Market segments

4.3 Market size 2025

4.4 Market outlook: Forecast for 2025-2030

Chart on Global - Market size and forecast 2025-2030 ($ million)
Data Table on Global - Market size and forecast 2025-2030 ($ million)
Chart on Global Market: Year-over-year growth 2025-2030 (%)
Data Table on Global Market: Year-over-year growth 2025-2030 (%)

5. Historic Market Size

5.1 Global Infant Nutrition Market 2020 - 2024

Historic Market Size - Data Table on Global Infant Nutrition Market 2020 - 2024 ($ million)

5.2 Distribution Channel segment analysis 2020 - 2024

Historic Market Size - Distribution Channel Segment 2020 - 2024 ($ million)

5.3 Type segment analysis 2020 - 2024

Historic Market Size - Type Segment 2020 - 2024 ($ million)

5.4 Form Factor segment analysis 2020 - 2024

Historic Market Size - Form Factor Segment 2020 - 2024 ($ million)

5.5 Geography segment analysis 2020 - 2024

Historic Market Size - Geography Segment 2020 - 2024 ($ million)

5.6 Country segment analysis 2020 - 2024

Historic Market Size - Country Segment 2020 - 2024 ($ million)

6. Qualitative Analysis

6.1 Impact of AI on global infant nutrition market

6.2 Impact of geopolitical conflicts on global infant nutrition market

7. Five Forces Analysis

7.1 Five forces summary

Five forces analysis - Comparison between 2025 and 2030

7.2 Bargaining power of buyers

Bargaining power of buyers - Impact of key factors 2025 and 2030

7.3 Bargaining power of suppliers

Bargaining power of suppliers - Impact of key factors in 2025 and 2030

7.4 Threat of new entrants

Threat of new entrants - Impact of key factors in 2025 and 2030

7.5 Threat of substitutes

Threat of substitutes - Impact of key factors in 2025 and 2030

7.6 Threat of rivalry

Threat of rivalry - Impact of key factors in 2025 and 2030

7.7 Market condition

Chart on Market condition - Five forces 2025 and 2030

8. Market Segmentation by Distribution Channel

8.1 Market segments

Chart on Distribution Channel - Market share 2025-2030 (%)
Data Table on Distribution Channel - Market share 2025-2030 (%)

8.2 Comparison by Distribution Channel

Chart on Comparison by Distribution Channel
Data Table on Comparison by Distribution Channel

8.3 Online - Market size and forecast 2025-2030

Chart on Online - Market size and forecast 2025-2030 ($ million)
Data Table on Online - Market size and forecast 2025-2030 ($ million)
Chart on Online - Year-over-year growth 2025-2030 (%)
Data Table on Online - Year-over-year growth 2025-2030 (%)

8.4 Offline - Market size and forecast 2025-2030

Chart on Offline - Market size and forecast 2025-2030 ($ million)
Data Table on Offline - Market size and forecast 2025-2030 ($ million)
Chart on Offline - Year-over-year growth 2025-2030 (%)
Data Table on Offline - Year-over-year growth 2025-2030 (%)

8.5 Market opportunity by Distribution Channel

Market opportunity by Distribution Channel ($ million)
Data Table on Market opportunity by Distribution Channel ($ million)

9. Market Segmentation by Type

9.1 Market segments

Chart on Type - Market share 2025-2030 (%)
Data Table on Type - Market share 2025-2030 (%)

9.2 Comparison by Type

Chart on Comparison by Type
Data Table on Comparison by Type

9.3 Infant milk formula - Market size and forecast 2025-2030

Chart on Infant milk formula - Market size and forecast 2025-2030 ($ million)
Data Table on Infant milk formula - Market size and forecast 2025-2030 ($ million)
Chart on Infant milk formula - Year-over-year growth 2025-2030 (%)
Data Table on Infant milk formula - Year-over-year growth 2025-2030 (%)

9.4 Follow-on-milk - Market size and forecast 2025-2030

Chart on Follow-on-milk - Market size and forecast 2025-2030 ($ million)
Data Table on Follow-on-milk - Market size and forecast 2025-2030 ($ million)
Chart on Follow-on-milk - Year-over-year growth 2025-2030 (%)
Data Table on Follow-on-milk - Year-over-year growth 2025-2030 (%)

9.5 Specialty baby milk - Market size and forecast 2025-2030

Chart on Specialty baby milk - Market size and forecast 2025-2030 ($ million)
Data Table on Specialty baby milk - Market size and forecast 2025-2030 ($ million)
Chart on Specialty baby milk - Year-over-year growth 2025-2030 (%)
Data Table on Specialty baby milk - Year-over-year growth 2025-2030 (%)

9.6 Prepared baby food - Market size and forecast 2025-2030

Chart on Prepared baby food - Market size and forecast 2025-2030 ($ million)
Data Table on Prepared baby food - Market size and forecast 2025-2030 ($ million)
Chart on Prepared baby food - Year-over-year growth 2025-2030 (%)
Data Table on Prepared baby food - Year-over-year growth 2025-2030 (%)

9.7 Others - Market size and forecast 2025-2030

Chart on Others - Market size and forecast 2025-2030 ($ million)
Data Table on Others - Market size and forecast 2025-2030 ($ million)
Chart on Others - Year-over-year growth 2025-2030 (%)
Data Table on Others - Year-over-year growth 2025-2030 (%)

9.8 Market opportunity by Type

Market opportunity by Type ($ million)
Data Table on Market opportunity by Type ($ million)

10. Market Segmentation by Form Factor

10.1 Market segments

Chart on Form Factor - Market share 2025-2030 (%)
Data Table on Form Factor - Market share 2025-2030 (%)

10.2 Comparison by Form Factor

Chart on Comparison by Form Factor
Data Table on Comparison by Form Factor

10.3 Powder - Market size and forecast 2025-2030

Chart on Powder - Market size and forecast 2025-2030 ($ million)
Data Table on Powder - Market size and forecast 2025-2030 ($ million)
Chart on Powder - Year-over-year growth 2025-2030 (%)
Data Table on Powder - Year-over-year growth 2025-2030 (%)

10.4 Concentrate liquid - Market size and forecast 2025-2030

Chart on Concentrate liquid - Market size and forecast 2025-2030 ($ million)
Data Table on Concentrate liquid - Market size and forecast 2025-2030 ($ million)
Chart on Concentrate liquid - Year-over-year growth 2025-2030 (%)
Data Table on Concentrate liquid - Year-over-year growth 2025-2030 (%)

10.5 Ready-to-feed - Market size and forecast 2025-2030

Chart on Ready-to-feed - Market size and forecast 2025-2030 ($ million)
Data Table on Ready-to-feed - Market size and forecast 2025-2030 ($ million)
Chart on Ready-to-feed - Year-over-year growth 2025-2030 (%)
Data Table on Ready-to-feed - Year-over-year growth 2025-2030 (%)

10.6 Market opportunity by Form Factor

Market opportunity by Form Factor ($ million)
Data Table on Market opportunity by Form Factor ($ million)

11. Customer Landscape

11.1 Customer landscape overview

Analysis of price sensitivity, lifecycle, customer purchase basket, adoption rates, and purchase criteria

12. Geographic Landscape

12.1 Geographic segmentation

Chart on Market share by geography 2025-2030 (%)
Data Table on Market share by geography 2025-2030 (%)

12.2 Geographic comparison

Chart on Geographic comparison
Data Table on Geographic comparison

12.3 North America - Market size and forecast 2025-2030

Chart on North America - Market size and forecast 2025-2030 ($ million)
Data Table on North America - Market size and forecast 2025-2030 ($ million)
Chart on North America - Year-over-year growth 2025-2030 (%)
Data Table on North America - Year-over-year growth 2025-2030 (%)
Chart on Regional Comparison - North America
Data Table on Regional Comparison - North America

12.3.1 US - Market size and forecast 2025-2030

Chart on US - Market size and forecast 2025-2030 ($ million)
Data Table on US - Market size and forecast 2025-2030 ($ million)
Chart on US - Year-over-year growth 2025-2030 (%)
Data Table on US - Year-over-year growth 2025-2030 (%)

12.3.2 Canada - Market size and forecast 2025-2030

Chart on Canada - Market size and forecast 2025-2030 ($ million)
Data Table on Canada - Market size and forecast 2025-2030 ($ million)
Chart on Canada - Year-over-year growth 2025-2030 (%)
Data Table on Canada - Year-over-year growth 2025-2030 (%)

12.3.3 Mexico - Market size and forecast 2025-2030

Chart on Mexico - Market size and forecast 2025-2030 ($ million)
Data Table on Mexico - Market size and forecast 2025-2030 ($ million)
Chart on Mexico - Year-over-year growth 2025-2030 (%)
Data Table on Mexico - Year-over-year growth 2025-2030 (%)

12.4 Europe - Market size and forecast 2025-2030

Chart on Europe - Market size and forecast 2025-2030 ($ million)
Data Table on Europe - Market size and forecast 2025-2030 ($ million)
Chart on Europe - Year-over-year growth 2025-2030 (%)
Data Table on Europe - Year-over-year growth 2025-2030 (%)
Chart on Regional Comparison - Europe
Data Table on Regional Comparison - Europe

12.4.1 Germany - Market size and forecast 2025-2030

Chart on Germany - Market size and forecast 2025-2030 ($ million)
Data Table on Germany - Market size and forecast 2025-2030 ($ million)
Chart on Germany - Year-over-year growth 2025-2030 (%)
Data Table on Germany - Year-over-year growth 2025-2030 (%)

12.4.2 UK - Market size and forecast 2025-2030

Chart on UK - Market size and forecast 2025-2030 ($ million)
Data Table on UK - Market size and forecast 2025-2030 ($ million)
Chart on UK - Year-over-year growth 2025-2030 (%)
Data Table on UK - Year-over-year growth 2025-2030 (%)

12.4.3 France - Market size and forecast 2025-2030

Chart on France - Market size and forecast 2025-2030 ($ million)
Data Table on France - Market size and forecast 2025-2030 ($ million)
Chart on France - Year-over-year growth 2025-2030 (%)
Data Table on France - Year-over-year growth 2025-2030 (%)

12.4.4 Italy - Market size and forecast 2025-2030

Chart on Italy - Market size and forecast 2025-2030 ($ million)
Data Table on Italy - Market size and forecast 2025-2030 ($ million)
Chart on Italy - Year-over-year growth 2025-2030 (%)
Data Table on Italy - Year-over-year growth 2025-2030 (%)

12.4.5 Spain - Market size and forecast 2025-2030

Chart on Spain - Market size and forecast 2025-2030 ($ million)
Data Table on Spain - Market size and forecast 2025-2030 ($ million)
Chart on Spain - Year-over-year growth 2025-2030 (%)
Data Table on Spain - Year-over-year growth 2025-2030 (%)

12.4.6 The Netherlands - Market size and forecast 2025-2030

Chart on The Netherlands - Market size and forecast 2025-2030 ($ million)
Data Table on The Netherlands - Market size and forecast 2025-2030 ($ million)
Chart on The Netherlands - Year-over-year growth 2025-2030 (%)
Data Table on The Netherlands - Year-over-year growth 2025-2030 (%)

12.5 APAC - Market size and forecast 2025-2030

Chart on APAC - Market size and forecast 2025-2030 ($ million)
Data Table on APAC - Market size and forecast 2025-2030 ($ million)
Chart on APAC - Year-over-year growth 2025-2030 (%)
Data Table on APAC - Year-over-year growth 2025-2030 (%)
Chart on Regional Comparison - APAC
Data Table on Regional Comparison - APAC

12.5.1 China - Market size and forecast 2025-2030

Chart on China - Market size and forecast 2025-2030 ($ million)
Data Table on China - Market size and forecast 2025-2030 ($ million)
Chart on China - Year-over-year growth 2025-2030 (%)
Data Table on China - Year-over-year growth 2025-2030 (%)

12.5.2 Japan - Market size and forecast 2025-2030

Chart on Japan - Market size and forecast 2025-2030 ($ million)
Data Table on Japan - Market size and forecast 2025-2030 ($ million)
Chart on Japan - Year-over-year growth 2025-2030 (%)
Data Table on Japan - Year-over-year growth 2025-2030 (%)

12.5.3 India - Market size and forecast 2025-2030

Chart on India - Market size and forecast 2025-2030 ($ million)
Data Table on India - Market size and forecast 2025-2030 ($ million)
Chart on India - Year-over-year growth 2025-2030 (%)
Data Table on India - Year-over-year growth 2025-2030 (%)

12.5.4 South Korea - Market size and forecast 2025-2030

Chart on South Korea - Market size and forecast 2025-2030 ($ million)
Data Table on South Korea - Market size and forecast 2025-2030 ($ million)
Chart on South Korea - Year-over-year growth 2025-2030 (%)
Data Table on South Korea - Year-over-year growth 2025-2030 (%)

12.5.5 Australia - Market size and forecast 2025-2030

Chart on Australia - Market size and forecast 2025-2030 ($ million)
Data Table on Australia - Market size and forecast 2025-2030 ($ million)
Chart on Australia - Year-over-year growth 2025-2030 (%)
Data Table on Australia - Year-over-year growth 2025-2030 (%)

12.5.6 Indonesia - Market size and forecast 2025-2030

Chart on Indonesia - Market size and forecast 2025-2030 ($ million)
Data Table on Indonesia - Market size and forecast 2025-2030 ($ million)
Chart on Indonesia - Year-over-year growth 2025-2030 (%)
Data Table on Indonesia - Year-over-year growth 2025-2030 (%)

12.6 South America - Market size and forecast 2025-2030

Chart on South America - Market size and forecast 2025-2030 ($ million)
Data Table on South America - Market size and forecast 2025-2030 ($ million)
Chart on South America - Year-over-year growth 2025-2030 (%)
Data Table on South America - Year-over-year growth 2025-2030 (%)
Chart on Regional Comparison - South America
Data Table on Regional Comparison - South America

12.6.1 Brazil - Market size and forecast 2025-2030

Chart on Brazil - Market size and forecast 2025-2030 ($ million)
Data Table on Brazil - Market size and forecast 2025-2030 ($ million)
Chart on Brazil - Year-over-year growth 2025-2030 (%)
Data Table on Brazil - Year-over-year growth 2025-2030 (%)

12.6.2 Argentina - Market size and forecast 2025-2030

Chart on Argentina - Market size and forecast 2025-2030 ($ million)
Data Table on Argentina - Market size and forecast 2025-2030 ($ million)
Chart on Argentina - Year-over-year growth 2025-2030 (%)
Data Table on Argentina - Year-over-year growth 2025-2030 (%)

12.6.3 Chile - Market size and forecast 2025-2030

Chart on Chile - Market size and forecast 2025-2030 ($ million)
Data Table on Chile - Market size and forecast 2025-2030 ($ million)
Chart on Chile - Year-over-year growth 2025-2030 (%)
Data Table on Chile - Year-over-year growth 2025-2030 (%)

12.7 Middle East and Africa - Market size and forecast 2025-2030

Chart on Middle East and Africa - Market size and forecast 2025-2030 ($ million)
Data Table on Middle East and Africa - Market size and forecast 2025-2030 ($ million)
Chart on Middle East and Africa - Year-over-year growth 2025-2030 (%)
Data Table on Middle East and Africa - Year-over-year growth 2025-2030 (%)
Chart on Regional Comparison - Middle East and Africa
Data Table on Regional Comparison - Middle East and Africa

12.7.1 Saudi Arabia - Market size and forecast 2025-2030

Chart on Saudi Arabia - Market size and forecast 2025-2030 ($ million)
Data Table on Saudi Arabia - Market size and forecast 2025-2030 ($ million)
Chart on Saudi Arabia - Year-over-year growth 2025-2030 (%)
Data Table on Saudi Arabia - Year-over-year growth 2025-2030 (%)

12.7.2 UAE - Market size and forecast 2025-2030

Chart on UAE - Market size and forecast 2025-2030 ($ million)
Data Table on UAE - Market size and forecast 2025-2030 ($ million)
Chart on UAE - Year-over-year growth 2025-2030 (%)
Data Table on UAE - Year-over-year growth 2025-2030 (%)

12.7.3 South Africa - Market size and forecast 2025-2030

Chart on South Africa - Market size and forecast 2025-2030 ($ million)
Data Table on South Africa - Market size and forecast 2025-2030 ($ million)
Chart on South Africa - Year-over-year growth 2025-2030 (%)
Data Table on South Africa - Year-over-year growth 2025-2030 (%)

12.7.4 Israel - Market size and forecast 2025-2030

Chart on Israel - Market size and forecast 2025-2030 ($ million)
Data Table on Israel - Market size and forecast 2025-2030 ($ million)
Chart on Israel - Year-over-year growth 2025-2030 (%)
Data Table on Israel - Year-over-year growth 2025-2030 (%)

12.7.5 Turkey - Market size and forecast 2025-2030

Chart on Turkey - Market size and forecast 2025-2030 ($ million)
Data Table on Turkey - Market size and forecast 2025-2030 ($ million)
Chart on Turkey - Year-over-year growth 2025-2030 (%)
Data Table on Turkey - Year-over-year growth 2025-2030 (%)

12.8 Market opportunity by geography

Market opportunity by geography ($ million)
Data Tables on Market opportunity by geography ($ million)

13. Drivers, Challenges, and Opportunity

13.1 Market drivers

Increasing focus on early life health and nutrition
Expansion of premium and specialized nutrition categories
Growth of organized retail and digital commerce channels

13.2 Market challenges

Regulatory complexity and compliance burden
Volatility in raw material and supply chain costs
Declining birth rates and demographic pressures

13.3 Impact of drivers and challenges

Impact of drivers and challenges in 2025 and 2030

13.4 Market opportunities

Shift toward human milk oligosaccharide enriched formulations
Rising adoption of microbiome focused product development
Expansion of clean label and ingredient transparency positioning

14. Competitive Landscape

14.1 Overview

14.2

Overview on criticality of inputs and factors of differentiation

14.3 Landscape disruption

Overview on factors of disruption

14.4 Industry risks

Impact of key risks on business

15. Competitive Analysis

15.1 Companies profiled

Companies covered

15.2 Company ranking index

15.3 Market positioning of companies

Matrix on companies position and classification

15.4 Abbott Laboratories

Abbott Laboratories - Overview
Abbott Laboratories - Business segments
Abbott Laboratories - Key news
Abbott Laboratories - Key offerings
Abbott Laboratories - Segment focus
SWOT

15.5 Asahi Group Holdings Ltd.

Asahi Group Holdings Ltd. - Overview
Asahi Group Holdings Ltd. - Business segments
Asahi Group Holdings Ltd. - Key offerings
Asahi Group Holdings Ltd. - Segment focus
SWOT

15.6 Ausnutria Dairy Corp. Ltd.

Ausnutria Dairy Corp. Ltd. - Overview
Ausnutria Dairy Corp. Ltd. - Business segments
Ausnutria Dairy Corp. Ltd. - Key offerings
Ausnutria Dairy Corp. Ltd. - Segment focus
SWOT

15.7 China Mengniu Dairy Co. Ltd.

China Mengniu Dairy Co. Ltd. - Overview
China Mengniu Dairy Co. Ltd. - Business segments
China Mengniu Dairy Co. Ltd. - Key offerings
China Mengniu Dairy Co. Ltd. - Segment focus
SWOT

15.8 Danone SA

Danone SA - Overview
Danone SA - Business segments
Danone SA - Key news
Danone SA - Key offerings
Danone SA - Segment focus
SWOT

15.9 Fonterra Cooperative Group Ltd.

Fonterra Cooperative Group Ltd. - Overview
Fonterra Cooperative Group Ltd. - Business segments
Fonterra Cooperative Group Ltd. - Key news
Fonterra Cooperative Group Ltd. - Key offerings
Fonterra Cooperative Group Ltd. - Segment focus
SWOT

15.10 Health and Happiness International

Health and Happiness International - Overview
Health and Happiness International - Business segments
Health and Happiness International - Key offerings
Health and Happiness International - Segment focus
SWOT

15.11 Inner Mongolia Yili Industrial

Inner Mongolia Yili Industrial - Overview
Inner Mongolia Yili Industrial - Product / Service
Inner Mongolia Yili Industrial - Key offerings
SWOT

15.12 Kewpie Corp.

Kewpie Corp. - Overview
Kewpie Corp. - Business segments
Kewpie Corp. - Key offerings
Kewpie Corp. - Segment focus
SWOT

15.13 Meiji Holdings Co. Ltd.

Meiji Holdings Co. Ltd. - Overview
Meiji Holdings Co. Ltd. - Business segments
Meiji Holdings Co. Ltd. - Key offerings
Meiji Holdings Co. Ltd. - Segment focus
SWOT

15.14 Nestle SA

Nestle SA - Overview
Nestle SA - Business segments
Nestle SA - Key news
Nestle SA - Key offerings
Nestle SA - Segment focus
SWOT

15.15 Perrigo Co. Plc

Perrigo Co. Plc - Overview
Perrigo Co. Plc - Business segments
Perrigo Co. Plc - Key offerings
Perrigo Co. Plc - Segment focus
SWOT

15.16 Reckitt Benckiser Group Plc

Reckitt Benckiser Group Plc - Overview
Reckitt Benckiser Group Plc - Business segments
Reckitt Benckiser Group Plc - Key offerings
Reckitt Benckiser Group Plc - Segment focus
SWOT

15.17 The Hain Celestial Group

The Hain Celestial Group - Overview
The Hain Celestial Group - Business segments
The Hain Celestial Group - Key news
The Hain Celestial Group - Key offerings
The Hain Celestial Group - Segment focus
SWOT

15.18 The Kraft Heinz Co.

The Kraft Heinz Co. - Overview
The Kraft Heinz Co. - Business segments
The Kraft Heinz Co. - Key news
The Kraft Heinz Co. - Key offerings
The Kraft Heinz Co. - Segment focus
SWOT

16. Appendix

16.1 Scope of the report

Market definition
Objectives
Notes and caveats

16.2 Inclusions and exclusions checklist

Inclusions checklist
Exclusions checklist

16.3 Currency conversion rates for US$

16.4 Research methodology

16.5 Data procurement

Information sources

16.6 Data validation

16.7 Validation techniques employed for market sizing

16.8 Data synthesis

16.9 360 degree market analysis

16.10 List of abbreviations

Research Methodology

Technavio presents a detailed picture of the market by way of study, synthesis, and summation of data from multiple sources. The analysts have presented the various facets of the market with a particular focus on identifying the key industry influencers. The data thus presented is comprehensive, reliable, and the result of extensive research, both primary and secondary.

INFORMATION SOURCES

Primary sources

  • Manufacturers and suppliers
  • Channel partners
  • Industry experts
  • Strategic decision makers

Secondary sources

  • Industry journals and periodicals
  • Government data
  • Financial reports of key industry players
  • Historical data
  • Press releases

DATA ANALYSIS

Data Synthesis

  • Collation of data
  • Estimation of key figures
  • Analysis of derived insights

Data Validation

  • Triangulation with data models
  • Reference against proprietary databases
  • Corroboration with industry experts

REPORT WRITING

Qualitative

  • Market drivers
  • Market challenges
  • Market trends
  • Five forces analysis

Quantitative

  • Market size and forecast
  • Market segmentation
  • Geographical insights
  • Competitive landscape

Interested in this report?

Get your sample now to see our research methodology and insights!

Download Now

Frequently Asked Questions

Infant Nutrition market growth will increase by USD 10822.1 million during 2026-2030.

The Infant Nutrition market is expected to grow at a CAGR of 4.7% during 2026-2030.

Infant Nutrition market is segmented by Distribution channel (Online, Offline) Type (Infant milk formula, Follow-on-milk, Specialty baby milk, Prepared baby food, Others) Form factor (Powder, Concentrate liquid, Ready-to-feed)

Abbott Laboratories, Arla Foods amba, Asahi Group Holdings Ltd., Ausnutria Dairy Corp. Ltd., Bobbie Baby Inc., China Mengniu Dairy Co. Ltd., Danone SA, Fonterra Cooperative Group Ltd., Health and Happiness International, HiPP GmbH and Co. Vertrieb KG, Inner Mongolia Yili Industrial, Kendal Nutricare Ltd, Kewpie Corp., Meiji Holdings Co. Ltd., Nestle SA, Perrigo Co. Plc, Reckitt Benckiser Group Plc, Royal Friesland Campina NV, The Hain Celestial Group, The Kraft Heinz Co. are a few of the key vendors in the Infant Nutrition market.

North America will register the highest growth rate of 40.5% among the other regions. Therefore, the Infant Nutrition market in North America is expected to garner significant business opportunities for the vendors during the forecast period.

US, Canada, Mexico, Germany, UK, France, Italy, Spain, The Netherlands, China, Japan, India, South Korea, Australia, Indonesia, Brazil, Argentina, Chile, Saudi Arabia, UAE, South Africa, Israel, Turkey

  • Increasing focus on early life health and nutrition is the driving factor this market.

The Infant Nutrition market vendors should focus on grabbing business opportunities from the Distribution channel segment as it accounted for the largest market share in the base year.
RIA - Research AI Assistant
Ask RIA
