New Zealand Infrastructure Market Size 2024-2028
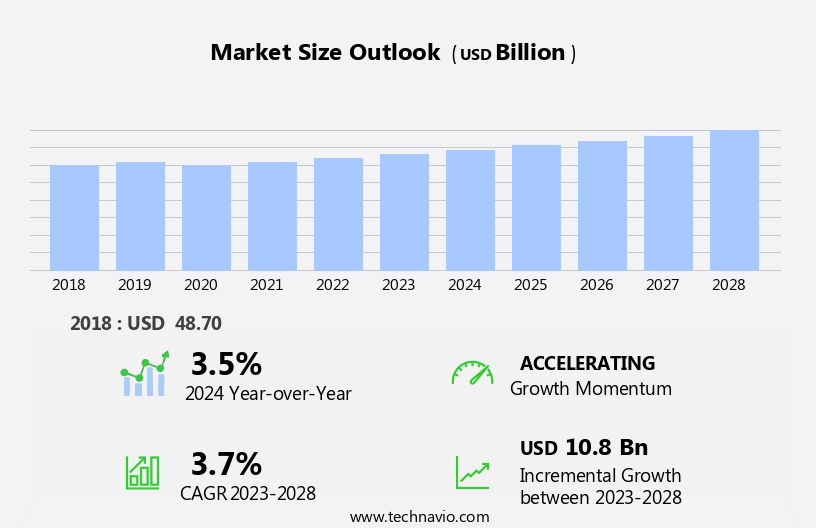
The new zealand infrastructure market size is forecast to increase by USD 10.8 billion, at a CAGR of 3.7% between 2023 and 2028.
- The market is experiencing significant momentum, driven by the country's inclination toward economic growth. This economic expansion is fueling the demand for improved and expanded infrastructure, particularly in sectors such as transportation and energy. A key trend shaping the market is the adoption of smart city technologies, which offer enhanced efficiency, sustainability, and connectivity. However, the financial viability of infrastructure projects poses a significant challenge. With increasing costs and complexities, stakeholders must navigate funding mechanisms and project management strategies to ensure the successful execution of these initiatives.
- Effective collaboration between the public and private sectors, as well as innovative financing models, will be essential for overcoming these hurdles and capitalizing on the market's growth potential. Companies seeking to capitalize on these opportunities must stay informed of regulatory developments, engage in strategic partnerships, and leverage technology to streamline operations and enhance service delivery.
What will be the size of the New Zealand Infrastructure Market during the forecast period?
Explore in-depth regional segment analysis with market size data - historical 2018-2022 and forecasts 2024-2028 - in the full report.
Request Free Sample
- In the dynamic New Zealand infrastructure market, machine learning (ML) and artificial intelligence (AI) are increasingly shaping network security solutions. Network forensics and incident response are enhanced through ML algorithms, enabling swift identification and remediation of threats. Edge computing and network slicing, including 5G network slicing, facilitate real-time data processing and improved network performance. Open networking and network orchestration allow for seamless integration of network monitoring tools, such as network traffic analysis and firewall management. Network capacity planning and penetration testing are crucial for business continuity, while network intrusion detection and vulnerability scanning ensure robust network security.
- Data mining and network programmability provide valuable insights for network optimization and automation. Network security testing and open source software play a vital role in maintaining network resilience and reducing costs. Network intrusion prevention and network performance monitoring are essential components of a comprehensive security strategy. Disaster recovery and business continuity plans are reinforced through advanced network technologies and AI-driven solutions.
How is this market segmented?
The market research report provides comprehensive data (region-wise segment analysis), with forecasts and estimates in "USD billion" for the period 2024-2028, as well as historical data from 2018-2022 for the following segments.
- Application
- Transportation
- Social
- Utilities
- Manufacturing
- Revenue Stream
- Direct investment
- Indirect investment
- Others
- Geography
- APAC
- New Zealand
- APAC
By Application Insights
The transportation segment is estimated to witness significant growth during the forecast period.
New Zealand's infrastructure sector is experiencing significant growth, with a focus on enhancing data storage, network performance, and transportation systems. The government prioritizes economic development and has identified seven Roads of National Significance (RoNS) for investment. These critical highways facilitate safe and efficient transportation of people, products, and services. The first RoNS project is underway, with one already completed. In addition, the government initiated shovel-ready plans in 2020 to fund infrastructure projects, stimulating job creation and development across the country. Network infrastructure is also a priority, with an emphasis on network standards, network regulation, and network reliability.
Cloud computing, network design, network integration, network resilience, and network optimization are key elements driving innovation. Software-defined networking (SDN) and network protocols are essential for network management and wireless infrastructure. Data security, network maintenance, data recovery, data analytics, and data centers are crucial components of digital transformation. Network virtualization, network services, managed services, network capacity, and fiber optic cables ensure network compliance and network scalability. Network latency, network monitoring, network planning, and network troubleshooting are ongoing concerns for network providers. The rollout of 5G technology and network upgrades are transforming network capabilities, enabling faster data transmission and improved connectivity.
Overall, New Zealand's infrastructure market is dynamic, with continuous advancements in technology and regulatory frameworks shaping its evolution.
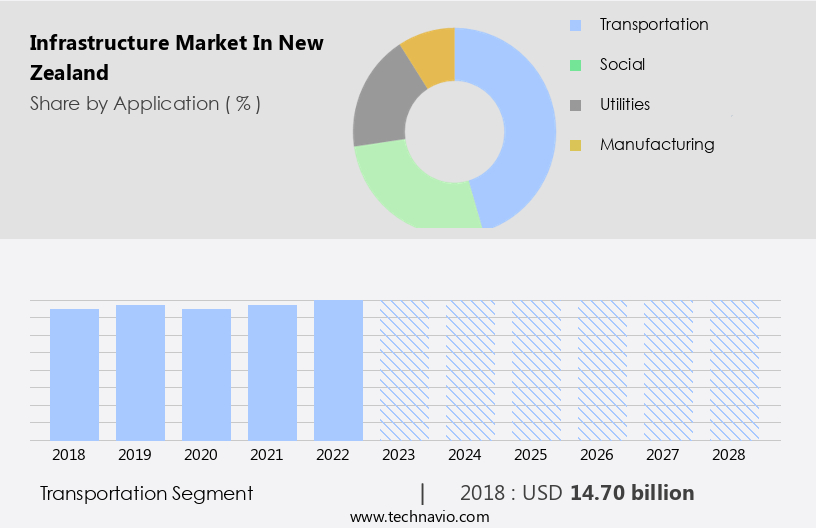
The Transportation segment was valued at USD 14.70 billion in 2018 and showed a gradual increase during the forecast period.
Market Dynamics
Our researchers analyzed the data with 2023 as the base year, along with the key drivers, trends, and challenges. A holistic analysis of drivers will help companies refine their marketing strategies to gain a competitive advantage.
What are the New Zealand Infrastructure Market drivers leading to the rise in adoption of the Industry?
- The inclination towards economic growth serves as the primary catalyst for market expansion.
- The market is experiencing significant growth due to the country's inclination towards economic expansion. With a focus on long-term prosperity, New Zealand prioritizes development in key sectors such as transportation, energy, water management, and urban development. The expanding economy, particularly in sectors like tourism, agriculture, and technology, necessitates modern and efficient infrastructure to maintain competitiveness and enhance living standards. The New Zealand government recognizes the crucial role infrastructure plays in economic growth and has made substantial investments through initiatives like the New Zealand Upgrade Programme and Infrastructure Strategy 2022.
- The demand for infrastructure continues to surge as the economy expands, making it a vital area of investment for businesses and the government alike. The market offers numerous opportunities for growth and development, making it an attractive proposition for US businesses looking to expand their operations in the Asia-Pacific region.
What are the New Zealand Infrastructure Market trends shaping the Industry?
- Smart city technologies are increasingly being adopted as the latest market trend. This includes the implementation of advanced solutions for urban infrastructure management, public safety, and efficient service delivery.
- The market is experiencing significant growth due to the adoption of smart city technologies. Cities like Auckland and Wellington are investing in IoT sensors, smart grids, intelligent transportation systems, and data analytics to enhance sustainability, efficiency, and quality of life for their residents. Key projects aim to create more resilient and interconnected urban environments, optimizing energy use, reducing traffic congestion, improving waste management, and enhancing public safety. Network performance is crucial for the successful implementation of these smart city solutions. Data storage and backup, network reliability, and network design are essential considerations for network regulation.
- Cloud computing offers a scalable and cost-effective solution for data storage and processing. Network switches play a vital role in ensuring optimal network performance and security. In conclusion, the market is undergoing a transformation as cities prioritize the integration of smart city technologies. The focus on network performance, data storage, and reliability is essential for the successful implementation of these solutions. The trend towards smarter resource management and more sustainable urban environments is driving this growth and is expected to continue in the future.
How does New Zealand Infrastructure Market faces challenges face during its growth?
- The financial viability of infrastructure projects poses a significant challenge and hinders the growth of the industry. Infrastructure development faces considerable hurdles due to the need for substantial financial resources and the uncertainty of returns on investment.
- New Zealand's infrastructure market faces substantial challenges due to the significant financial investments required for large-scale projects and the potential impact of economic instability. Projects like high-speed rail networks, urban transit systems, and energy facilities necessitate advanced technologies, increasing initial costs and adding complexity for both public and private stakeholders. Economic uncertainties, such as fluctuations in GDP growth or unexpected market downturns, can further complicate the financial landscape in the country. Network integration and optimization, including software-defined networking (SDN) and network protocols, play a crucial role in enhancing network resilience and availability. Broadband access and wireless infrastructure are essential components of modern infrastructure development.
- Data security is another critical factor, with network management and security measures necessary to protect sensitive information. Network integration, optimization, broadband access, wireless infrastructure, network protocols, and data security are key areas of focus for infrastructure development in New Zealand. Ensuring network reliability and availability is essential to the financial viability and success of these projects. By investing in these areas, stakeholders can mitigate risks and create harmonious, efficient, and immersive infrastructure networks.
Exclusive New Zealand Infrastructure Market Customer Landscape
The market forecasting report includes the adoption lifecycle of the market, covering from the innovator’s stage to the laggard’s stage. It focuses on adoption rates in different regions based on penetration. Furthermore, the report also includes key purchase criteria and drivers of price sensitivity to help companies evaluate and develop their market growth analysis strategies.
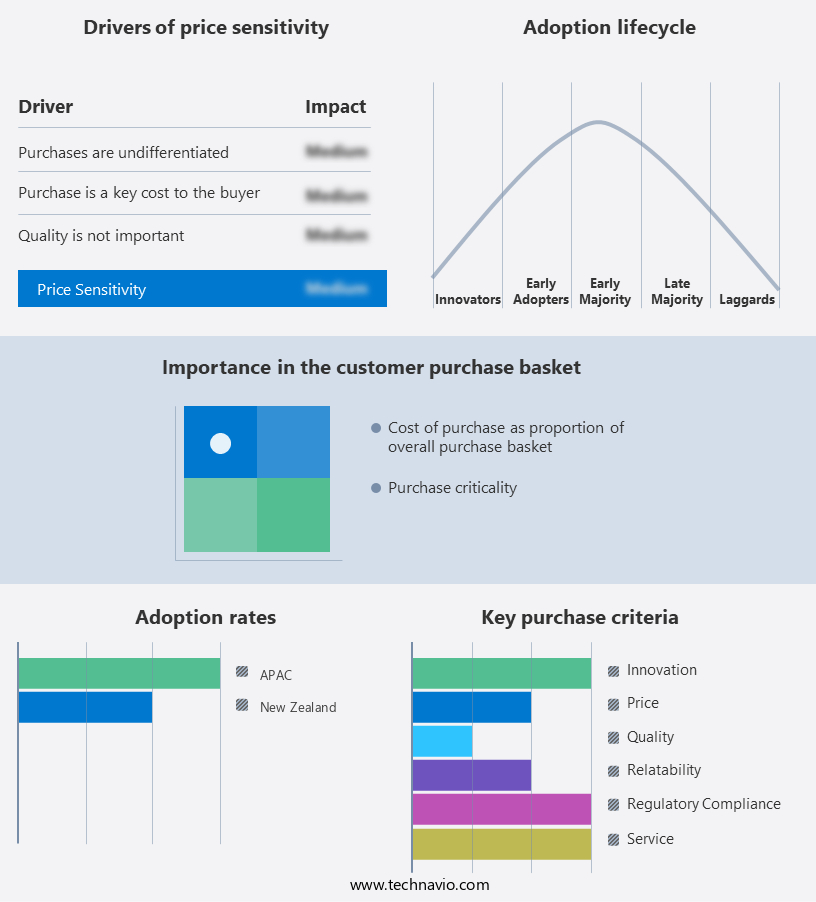
Customer Landscape
Key Companies & Market Insights
Companies are implementing various strategies, such as strategic alliances, market forecast partnerships, mergers and acquisitions, geographical expansion, and product/service launches, to enhance their presence in the market.
The market research and growth report includes detailed analyses of the competitive landscape of the market and information about key companies, including:
- Arvida Group Ltd.
- Asset Plus
- CIMIC Group Ltd.
- Citycare Group
- Downer EDI Ltd.
- Fletcher Building Ltd.
- Fulton Hogan Ltd.
- Hawkins Ltd.
- Infratil Ltd.
- Kiwi Property
- Naylor Love Enterprises Ltd.
- Obayashi Corp.
- Precinct Properties Ltd.
- Summerset Group Holdings Ltd.
- Ventia Services Group Pty Ltd.
- Vinci
Qualitative and quantitative analysis of companies has been conducted to help clients understand the wider business environment as well as the strengths and weaknesses of key market players. Data is qualitatively analyzed to categorize companies as pure play, category-focused, industry-focused, and diversified; it is quantitatively analyzed to categorize companies as dominant, leading, strong, tentative, and weak.
Recent Development and News in Infrastructure Market In New Zealand
- In February 2024, the New Zealand government announced a significant investment of NZD 12 billion (USD8.1 billion) in its Infrastructure Acceleration Fund, aiming to upgrade and develop essential infrastructure projects across the country (Beehive.Govt.Nz). This substantial investment is expected to create jobs and stimulate economic growth.
- In July 2024, Fletcher Building, New Zealand's leading construction company, entered into a strategic partnership with Australian firm, Lendlease, to collaborate on large-scale infrastructure projects. The partnership aims to leverage both companies' expertise and resources, enhancing their market position and expanding their project portfolio (Fletcher Building).
- In March 2025, the New Zealand Transport Agency (NZTA) approved the construction of the Auckland Light Rail project, a key initiative to improve public transportation in New Zealand's largest city. The project, valued at NZD 4.4 billion (USD2.9 billion), is expected to be completed by 2027 and will significantly reduce traffic congestion and improve connectivity (NZTA).
- In May 2025, Meridian Energy, New Zealand's largest renewable energy generator, announced the successful deployment of a new wind farm, the Makani Farm, in the South Island. The farm, featuring 33 wind turbines, has a total capacity of 112 MW and is expected to generate enough electricity to power approximately 55,000 households (Meridian Energy). This technological advancement reinforces New Zealand's commitment to renewable energy and reducing carbon emissions.
Research Analyst Overview
The market continues to evolve, with dynamic market dynamics shaping the landscape across various sectors. Network integration and resilience are key priorities, ensuring seamless communication and data transfer between entities. Broadband access and network optimization are crucial for businesses and individuals, driving the adoption of advanced network technologies. Software-defined networking (SDN) and network protocols enable network availability and management, while wireless infrastructure and data security ensure uninterrupted connectivity and protection against cyber threats. Network maintenance and recovery are essential for business continuity, with data analytics and cloud computing offering valuable insights and solutions. Network design and virtualization optimize network capacity and scalability, while network services and managed services provide expert support for network upgrades and fiber optic deployment.
Network regulation and compliance ensure adherence to industry standards, with network planning and troubleshooting addressing network latency and other performance issues. The ongoing unfolding of market activities reveals evolving patterns in network performance, reliability, and availability. Fiber optic cables and 5G technology are driving network capacity and data transmission speeds, while network monitoring and network capacity management ensure optimal network performance. The market remains a vibrant and ever-changing landscape, with continuous innovation and adaptation to meet the evolving needs of businesses and individuals.
Dive into Technavio’s robust research methodology, blending expert interviews, extensive data synthesis, and validated models for unparalleled Infrastructure Market in New Zealand insights. See full methodology.
|
Market Scope |
|
|
Report Coverage |
Details |
|
Page number |
137 |
|
Base year |
2023 |
|
Historic period |
2018-2022 |
|
Forecast period |
2024-2028 |
|
Growth momentum & CAGR |
Accelerate at a CAGR of 3.7% |
|
Market growth 2024-2028 |
USD 10.8 billion |
|
Market structure |
Fragmented |
|
YoY growth 2023-2024(%) |
3.5 |
|
Competitive landscape |
Leading Companies, Market Positioning of Companies, Competitive Strategies, and Industry Risks |
What are the Key Data Covered in this Market Research Report?
- CAGR of the market during the forecast period
- Detailed information on factors that will drive the market growth and forecasting between 2024 and 2028
- Precise estimation of the size of the market and its contribution of the market in focus to the parent market
- Accurate predictions about upcoming market growth and trends and changes in consumer behaviour
- Growth of the market across New Zealand
- Thorough analysis of the market’s competitive landscape and detailed information about companies
- Comprehensive analysis of factors that will challenge the growth of market companies
We can help! Our analysts can customize this market research report to meet your requirements Get in touch
 RIA -
RIA - 
