Infusion Therapy Devices Market Analysis North America, Europe, Asia, Rest of World (ROW) - US, Germany, UK, Japan, China - Size and Forecast 2024-2028

Infusion Therapy Devices Market Analysis North America, Europe, Asia, Rest of World (ROW) - US, Germany, UK, Japan, China - Size and Forecast 2024-2028

Published: Mar 2024 159 Pages SKU: IRTNTR77697

Market Overview at a Glance

$21.18 B
Market Opportunity
8.37%
CAGR
7.45
YoY growth 2023-2024(%)

Infusion Therapy Devices Market Size 2024-2028

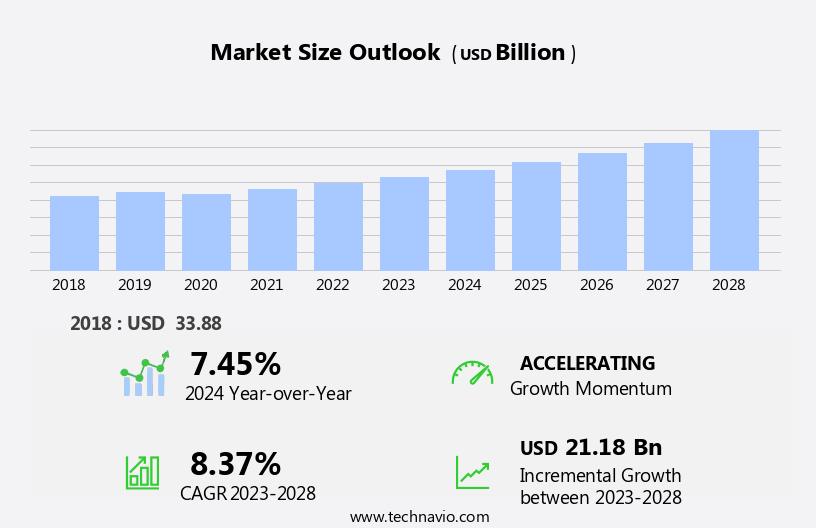
The infusion therapy devices market size is forecast to increase by USD 21.18 billion, at a CAGR of 8.37% between 2023 and 2028.

  • The market is witnessing significant growth, driven by the increasing prevalence of chronic diseases necessitating long-term infusion therapy. This trend is particularly prominent in the aging population, as they are more susceptible to chronic conditions such as diabetes, cancer, and neurological disorders. Another key driver is the emergence of smart infusion therapy devices, which offer advanced features such as remote monitoring, connectivity, and automated dosing. These innovations enhance patient safety, improve treatment outcomes, and increase healthcare provider efficiency. However, the market also faces challenges, primarily the high upfront costs associated with infusion pumps and equipment procurement. This financial burden can limit market penetration, particularly in developing regions and among economically disadvantaged populations.
  • Furthermore, regulatory requirements and reimbursement policies add complexity to the market landscape, necessitating close collaboration between manufacturers, healthcare providers, and payers to ensure access to these life-enhancing technologies. Companies seeking to capitalize on market opportunities must navigate these challenges effectively, focusing on cost reduction strategies, value-based pricing, and regulatory compliance. By doing so, they can position themselves as trusted partners in the healthcare ecosystem, driving growth and innovation in the market.

What will be the Size of the Infusion Therapy Devices Market during the forecast period?

Infusion Therapy Devices Market Size

Explore in-depth regional segment analysis with market size data - historical 2018-2022 and forecasts 2024-2028 - in the full report.  
Request Free Sample

The market continues to evolve, driven by advancements in technology and growing applications across various sectors. Needle-free injection systems and portable infusion devices are increasingly popular, offering convenience and improved patient comfort. Infusion pump technology, including volume control infusion and rate-adjustable infusions, enables precise medication delivery. Bolus injection delivery and occlusion detection systems ensure efficient and safe infusion processes. Drug delivery systems, incorporating pressure sensors for accuracy and alarm system features, enhance patient safety. Single-use infusion pumps and disposable infusion sets facilitate sterile device handling. Clinical trial applications and remote patient monitoring expand the market's reach.

Infusion therapy technology advances with ambulatory infusion pumps, wireless data transmission, and medication error reduction. Air-in-line detection and fluid flow regulation optimize battery life. Home infusion therapy and multichannel infusion pumps cater to diverse patient needs. Market dynamics remain fluid, with ongoing research and development in infusion pump technology, bolus injection delivery, and patient monitoring sensors. The focus on patient safety mechanisms, such as occlusion detection systems and alarm systems, continues to drive innovation. The market is a dynamic and evolving landscape, with new applications and technologies continually emerging.

How is this Infusion Therapy Devices Industry segmented?

The infusion therapy devices industry research report provides comprehensive data (region-wise segment analysis), with forecasts and estimates in "USD billion" for the period 2024-2028, as well as historical data from 2018-2022 for the following segments.

  • End-user
    • Hospitals
    • Homecare settings
    • Clinics and ASCs
  • Product
    • Infusion pumps
    • Consumables
    • accessories
  • Geography
    • North America
      • US
    • Europe
      • Germany
      • UK
    • APAC
      • China
      • Japan
    • Rest of World (ROW)

    By End-user Insights

    The hospitals segment is estimated to witness significant growth during the forecast period.

    In the healthcare sector, hospitals serve as significant contributors to the growth of the market. Hospitals, particularly multispecialty hospitals and hospital groups, are prominent consumers due to their large size and extensive range of inpatient and outpatient services. With over 500 hospital beds, these institutions accommodate a substantial number of patients and generate substantial revenue. They procure medical products and consumables in bulk, fostering close relationships with suppliers, reimbursement authorities, and government organizations. Their advanced medical infrastructure caters to the complex surgeries and treatments in outpatient settings. Infusion therapy devices play a crucial role in these healthcare facilities.

    Electronic infusion control systems and syringe pump mechanisms ensure precise medication delivery. Infusion device maintenance and single-use infusion pumps minimize the risk of infection and cross-contamination. PCA pump programming simplifies medication administration for patients. Clinical trial applications of infusion therapy devices facilitate research and development. Sterile device handling, pressure sensors' accuracy, and needle-free injection systems enhance patient safety. Portable infusion devices offer flexibility and convenience. Drug delivery systems and infusion pump technology enable the administration of various medications. Bolus injection delivery, iv administration sets, and occlusion detection systems ensure efficient and effective therapy. Disposable infusion sets and volume control infusion systems reduce the risk of medication errors.

    Alarm system features, ambulatory infusion pumps, remote patient monitoring, multichannel infusion pumps, medication error reduction, air-in-line detection, fluid flow regulation, battery life optimization, and patient monitoring sensors contribute to improved patient care and outcomes. Home infusion therapy and rate-adjustable infusion systems expand access to infusion therapy beyond hospital settings. Wireless data transmission and drug compatibility testing facilitate seamless integration with electronic health records. Infusion therapy protocols standardize care and optimize resource utilization.

    Infusion Therapy Devices Market Size

    Request Free Sample

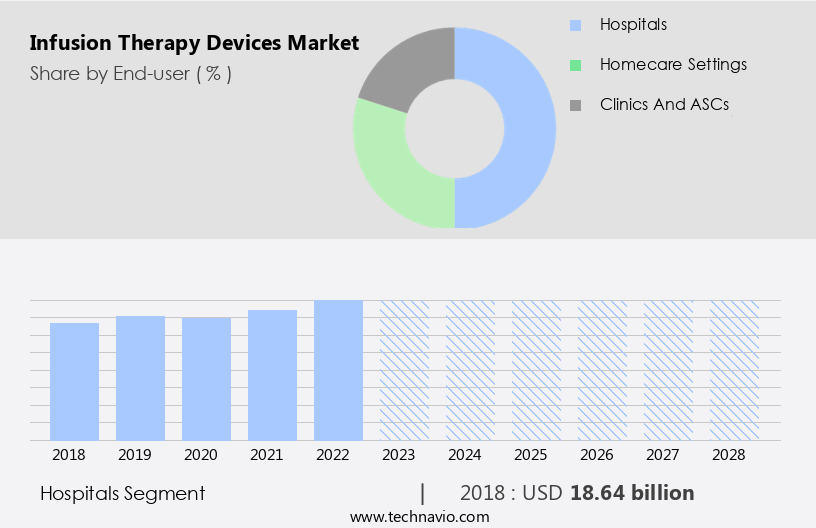
    The Hospitals segment was valued at USD 18.64 billion in 2018 and showed a gradual increase during the forecast period.

    Regional Analysis

    North America is estimated to contribute 39% to the growth of the global market during the forecast period.Technavio’s analysts have elaborately explained the regional trends and drivers that shape the market during the forecast period.

    Infusion Therapy Devices Market Share by Geography

     Request Free Sample

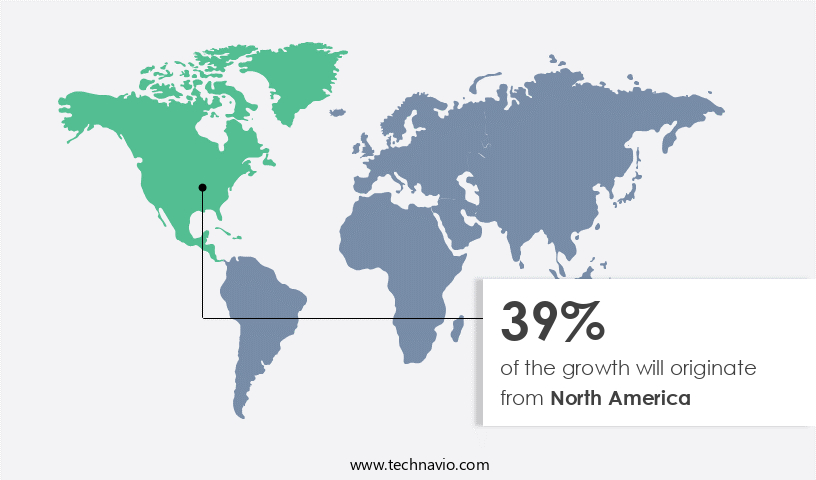
    In the dynamic the market, North America emerges as a leading region, marked by advanced healthcare infrastructure, a large patient population with chronic conditions, and increasing adoption of home-based medical treatments. The United States and Canada, in particular, exhibit high demand due to the prevalence of diseases such as cancer, autoimmune disorders, and infectious diseases. Factors fueling market growth include rising healthcare expenditure, favorable reimbursement policies, and technological advancements. Infusion pump technology innovations, remote patient monitoring, and healthcare IT solutions enable safe and effective infusion therapy delivery. Single-use infusion pumps, disposable infusion sets, and volume control infusions cater to the need for medication error reduction and sterile device handling.

    Pressure sensors ensure accuracy, while occlusion detection systems and air-in-line detection prevent complications. Alarm system features and patient monitoring sensors enhance patient safety. Ambulatory infusion pumps and wireless data transmission enable remote care, while medication compatibility testing and infusion therapy protocols ensure optimal drug delivery. Battery life optimization and patient safety mechanisms further add value. Home infusion therapy, rate-adjustable infusions, and multichannel infusions cater to diverse patient needs.

    Market Dynamics

    Our researchers analyzed the data with 2023 as the base year, along with the key drivers, trends, and challenges. A holistic analysis of drivers will help companies refine their marketing strategies to gain a competitive advantage.

    What are the key market drivers leading to the rise in the adoption of Infusion Therapy Devices Industry?

    • The rising incidence of chronic diseases serves as the primary catalyst for market growth. 

    • The market experiences significant growth due to the rising prevalence of chronic conditions, such as cancer, diabetes, and heart disease. Infusion therapy plays a crucial role in treating various medical conditions by delivering fluids, electrolytes, and medications to patients. According to the International Diabetes Federation (IDF), the diabetes population is projected to reach 700 million by 2045. Diabetes patients often require intravenous therapy and vein access for glucose management, making the increasing diabetes prevalence a significant driver for the demand for IV therapy and vein access during the forecast period. Infusion therapy devices incorporate advanced technologies like electronic infusion control systems and syringe pump mechanisms to ensure accurate and efficient medication delivery.
    • Single-use infusion pumps and PCA pump programming offer convenience and ease of use for healthcare providers. Infusion device maintenance is essential to ensure the accuracy and reliability of these devices, with pressure sensors playing a critical role in maintaining optimal infusion pressure. Clinical trial applications of infusion therapy devices are also increasing, further expanding their market potential. Sterile device handling is a crucial aspect of infusion therapy, ensuring patient safety and reducing the risk of infections. Overall, the market is expected to continue its growth trajectory, driven by the increasing demand for advanced medical devices and the rising prevalence of chronic conditions.

    What are the market trends shaping the Infusion Therapy Devices Industry?

    • Smart infusion therapy devices are gaining increasing popularity in the healthcare market, representing an emerging trend in this industry. These advanced devices offer enhanced patient care and improved treatment outcomes through features such as remote monitoring, automated delivery, and real-time data analysis.

    • Infusion therapy devices are advanced drug delivery systems that integrate needle-free injection systems, portable infusion pumps, and occlusion detection systems to ensure precise and accurate medication administration. These devices utilize infusion pump technology to deliver medication via iv administration sets, with options for both continuous and bolus injection delivery. Smart infusion therapy devices offer a harmonious blend of technology and healthcare, enabling hospitals to manage drug libraries and software programs for efficient medication administration. The pharmacy department, in collaboration with the therapeutics committee, inputs and manages the drug library.
    • Clinicians can select the desired drug and concentration from the library, program the device, and receive alerts through alarms for any dosage overrides. The adoption of these devices is driven by the need for error prevention in medication administration, ensuring a safer and more efficient healthcare environment.

    What challenges does the Infusion Therapy Devices Industry face during its growth?

    • The significant upfront expenses related to the acquisition of infusion pumps and associated equipment represent a major challenge to the industry's growth trajectory. 

    • Infusion therapy devices, including volume control infusion pumps and multichannel infusion systems, play a crucial role in delivering medications, fluids, and nutrients to patients in various settings. These devices come with advanced features such as alarm systems, remote patient monitoring, medication error reduction, air-in-line detection, and fluid flow regulation. However, the high upfront costs of procuring these devices pose a significant challenge to both patients and healthcare providers. Infusion pumps can cost anywhere between USD100 and USD1,000, making the initial investment substantial.
    • For patients, this financial barrier can hinder access to necessary care, especially for those with limited financial resources or insufficient insurance coverage. Co-payments, deductibles, and coverage limitations can further increase out-of-pocket expenses, even with insurance. Despite these challenges, the market for infusion therapy devices continues to grow due to the benefits these devices offer, such as improved patient outcomes, enhanced safety, and increased convenience.

    Exclusive Customer Landscape

    The infusion therapy devices market forecasting report includes the adoption lifecycle of the market, covering from the innovator’s stage to the laggard’s stage. It focuses on adoption rates in different regions based on penetration. Furthermore, the infusion therapy devices market report also includes key purchase criteria and drivers of price sensitivity to help companies evaluate and develop their market growth analysis strategies.
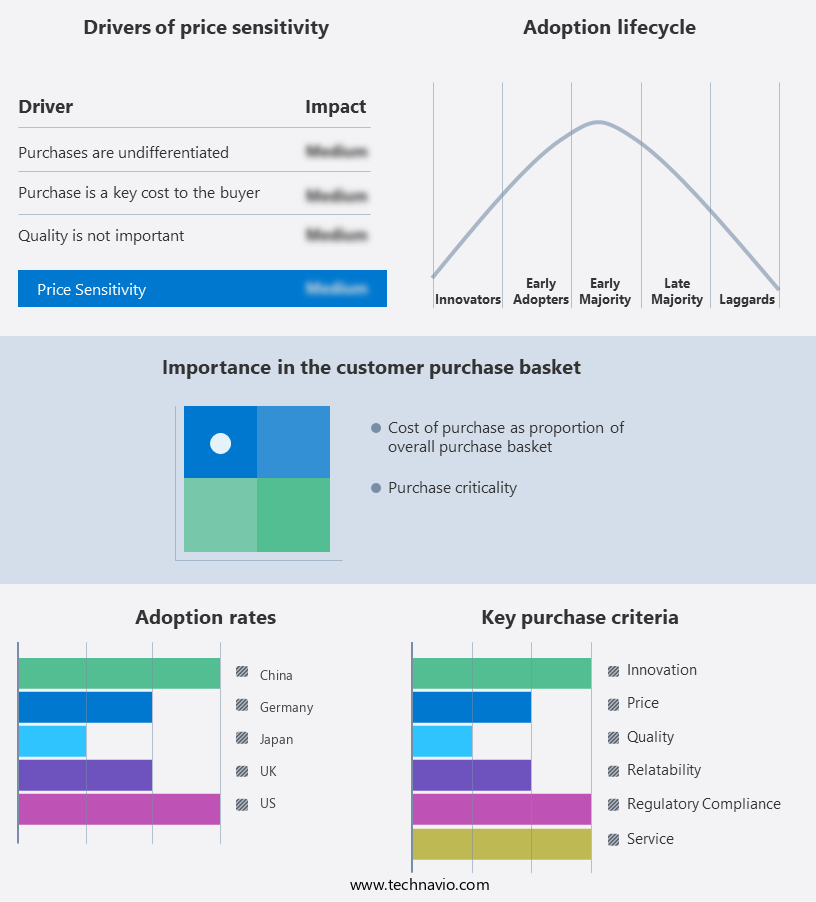
    Infusion Therapy Devices Market Share by Geography

     Customer Landscape

    Key Companies & Market Insights

    Companies are implementing various strategies, such as strategic alliances, infusion therapy devices market forecast, partnerships, mergers and acquisitions, geographical expansion, and product/service launches, to enhance their presence in the industry.

    Ace medical - This company specializes in advanced infusion therapy devices, including the Pulse Spray infusion system with pressure response outlets for optimal fluid distribution, the Uni Fuse infusion catheter for catheter-directed thrombolysis, and the SpeedLyser PROTM Infusion System. These innovative devices enhance medical treatment efficacy.

    The industry research and growth report includes detailed analyses of the competitive landscape of the market and information about key companies, including:

    • Ace medical
    • AngioDynamics Inc.
    • Avanos Medical Inc.
    • B.Braun SE
    • Baxter International Inc.
    • Becton Dickinson and Company
    • Canafusion Technologies Inc.
    • Cardinal Health Inc.
    • Chemyx Inc.
    • ERENLER MEDIKAL SAN. TIC. LTD. STI.
    • Fresenius SE and Co. KGaA
    • ICU Medical Inc.
    • IRadimed Corp.
    • Medtronic
    • Poly Medicure Ltd.
    • Smith and Nephew plc
    • Tekni Plex Inc.
    • Teleflex Inc.
    • Terumo Corp.
    • Vygon SAS

    Qualitative and quantitative analysis of companies has been conducted to help clients understand the wider business environment as well as the strengths and weaknesses of key industry players. Data is qualitatively analyzed to categorize companies as pure play, category-focused, industry-focused, and diversified; it is quantitatively analyzed to categorize companies as dominant, leading, strong, tentative, and weak.

    Recent Development and News in Infusion Therapy Devices Market

    • In January 2024, Fresenius Kabi, a leading global health care company, launched the Space Infusion System, a compact and lightweight infusion device designed for home use (Fresenius Kabi press release). This innovation aims to improve patient mobility and convenience.
    • In March 2024, Becton, Dickinson and Company (BD) announced a strategic partnership with Merck KGaA to develop and commercialize a new generation of wearable infusion pumps (BD press release). This collaboration combines BD's expertise in medical technology and Merck KGaA's knowledge in pharmaceuticals, aiming to enhance patient care.
    • In May 2024, Grifols, a global healthcare company, acquired the infusion devices business of Hospira, Inc., a Pfizer company, for approximately USD1.65 billion (Grifols press release). This acquisition strengthened Grifols' position in the market, expanding its product portfolio and enhancing its global presence.
    • In April 2025, the U.S. Food and Drug Administration (FDA) approved Medtronic's new portable infusion pump, the MiniMedTM 780G, featuring advanced insulin delivery and glucose sensing capabilities (Medtronic press release). This approval marked a significant technological advancement in the market, offering enhanced patient control and convenience.

    Research Analyst Overview

    • The market is characterized by continuous advancements in technology, with a focus on enhancing patient safety, convenience, and medication accuracy. Smart infusion pumps, equipped with data logging capabilities, patient education materials, and remote diagnostics, are increasingly popular. Infusion site care and infection control practices are essential considerations, with device lifespan and material biocompatibility playing crucial roles. Healthcare providers prioritize medication administration training and dosing regimen optimization, while cost-effectiveness analysis and network connectivity are key trends. Drug concentration calculation, software upgrades, user interface design, and calibration procedures are essential for ensuring drug delivery accuracy and quality control testing.
    • Advanced infusion technology includes syringe pump design, clinical workflow integration, and extended care solutions, all aimed at improving patient comfort and infection control practices. Regulatory approval processes and medication administration remain critical aspects of the market, with a growing emphasis on patient self-management and infusion line management. Drug stability considerations and medication administration techniques are essential for maintaining optimal patient outcomes.

    Dive into Technavio’s robust research methodology, blending expert interviews, extensive data synthesis, and validated models for unparalleled Infusion Therapy Devices Market insights. See full methodology.

    Market Scope

    Report Coverage

    Details

    Page number

    159

    Base year

    2023

    Historic period

    2018-2022

    Forecast period

    2024-2028

    Growth momentum & CAGR

    Accelerate at a CAGR of 8.37%

    Market growth 2024-2028

    USD 21.18 billion

    Market structure

    Fragmented

    YoY growth 2023-2024(%)

    7.45

    Key countries

    US, Germany, UK, Japan, and China

    Competitive landscape

    Leading Companies, Market Positioning of Companies, Competitive Strategies, and Industry Risks

    Request Free Sample

    What are the Key Data Covered in this Infusion Therapy Devices Market Research and Growth Report?

    • CAGR of the Infusion Therapy Devices industry during the forecast period
    • Detailed information on factors that will drive the growth and forecasting between 2024 and 2028
    • Precise estimation of the size of the market and its contribution of the industry in focus to the parent market
    • Accurate predictions about upcoming growth and trends and changes in consumer behaviour
    • Growth of the market across North America, Europe, Asia, and Rest of World (ROW)
    • Thorough analysis of the market’s competitive landscape and detailed information about companies
    • Comprehensive analysis of factors that will challenge the infusion therapy devices market growth of industry companies

    We can help! Our analysts can customize this infusion therapy devices market research report to meet your requirements.

    Get in touch


    1 Executive Summary

    • 1.1 Market overview
      • Exhibit 01: Executive Summary – Chart on Market Overview
      • Exhibit 02: Executive Summary – Data Table on Market Overview
      • Exhibit 03: Executive Summary – Chart on Global Market Characteristics
      • Exhibit 04: Executive Summary – Chart on Market by Geography
      • Exhibit 05: Executive Summary – Chart on Market Segmentation by End-user
      • Exhibit 06: Executive Summary – Chart on Market Segmentation by Product
      • Exhibit 07: Executive Summary – Chart on Incremental Growth
      • Exhibit 08: Executive Summary – Data Table on Incremental Growth
      • Exhibit 09: Executive Summary – Chart on Vendor Market Positioning

    2 Market Landscape

    • 2.1 Market ecosystem
      • Exhibit 10: Parent market
      • Exhibit 11: Market Characteristics

    3 Market Sizing

    • 3.1 Market definition
      • Exhibit 12: Offerings of vendors included in the market definition
    • 3.2 Market segment analysis
      • Exhibit 13: Market segments
    • 3.3 Market size 2023
      • 3.4 Market outlook: Forecast for 2023-2028
        • Exhibit 14: Chart on Global - Market size and forecast 2023-2028 ($ billion)
        • Exhibit 15: Data Table on Global - Market size and forecast 2023-2028 ($ billion)
        • Exhibit 16: Chart on Global Market: Year-over-year growth 2023-2028 (%)
        • Exhibit 17: Data Table on Global Market: Year-over-year growth 2023-2028 (%)

      4 Historic Market Size

      • 4.1 Global infusion therapy devices market 2018 - 2022
        • Exhibit 18: Historic Market Size – Data Table on global infusion therapy devices market 2018 - 2022 ($ billion)
      • 4.2 End-user Segment Analysis 2018 - 2022
        • Exhibit 19: Historic Market Size – End-user Segment 2018 - 2022 ($ billion)
      • 4.3 Product Segment Analysis 2018 - 2022
        • Exhibit 20: Historic Market Size – Product Segment 2018 - 2022 ($ billion)
      • 4.4 Geography Segment Analysis 2018 - 2022
        • Exhibit 21: Historic Market Size – Geography Segment 2018 - 2022 ($ billion)
      • 4.5 Country Segment Analysis 2018 - 2022
        • Exhibit 22: Historic Market Size – Country Segment 2018 - 2022 ($ billion)

      5 Five Forces Analysis

      • 5.1 Five forces summary
        • Exhibit 23: Five forces analysis - Comparison between 2023 and 2028
      • 5.2 Bargaining power of buyers
        • Exhibit 24: Chart on Bargaining power of buyers – Impact of key factors 2023 and 2028
      • 5.3 Bargaining power of suppliers
        • Exhibit 25: Bargaining power of suppliers – Impact of key factors in 2023 and 2028
      • 5.4 Threat of new entrants
        • Exhibit 26: Threat of new entrants – Impact of key factors in 2023 and 2028
      • 5.5 Threat of substitutes
        • Exhibit 27: Threat of substitutes – Impact of key factors in 2023 and 2028
      • 5.6 Threat of rivalry
        • Exhibit 28: Threat of rivalry – Impact of key factors in 2023 and 2028
      • 5.7 Market condition
        • Exhibit 29: Chart on Market condition - Five forces 2023 and 2028

      6 Market Segmentation by End-user

      • 6.1 Market segments
        • Exhibit 30: Chart on End-user - Market share 2023-2028 (%)
        • Exhibit 31: Data Table on End-user - Market share 2023-2028 (%)
      • 6.2 Comparison by End-user
        • Exhibit 32: Chart on Comparison by End-user
        • Exhibit 33: Data Table on Comparison by End-user
      • 6.3 Hospitals - Market size and forecast 2023-2028
        • Exhibit 34: Chart on Hospitals - Market size and forecast 2023-2028 ($ billion)
        • Exhibit 35: Data Table on Hospitals - Market size and forecast 2023-2028 ($ billion)
        • Exhibit 36: Chart on Hospitals - Year-over-year growth 2023-2028 (%)
        • Exhibit 37: Data Table on Hospitals - Year-over-year growth 2023-2028 (%)
      • 6.4 Homecare settings - Market size and forecast 2023-2028
        • Exhibit 38: Chart on Homecare settings - Market size and forecast 2023-2028 ($ billion)
        • Exhibit 39: Data Table on Homecare settings - Market size and forecast 2023-2028 ($ billion)
        • Exhibit 40: Chart on Homecare settings - Year-over-year growth 2023-2028 (%)
        • Exhibit 41: Data Table on Homecare settings - Year-over-year growth 2023-2028 (%)
      • 6.5 Clinics and ASCs - Market size and forecast 2023-2028
        • Exhibit 42: Chart on Clinics and ASCs - Market size and forecast 2023-2028 ($ billion)
        • Exhibit 43: Data Table on Clinics and ASCs - Market size and forecast 2023-2028 ($ billion)
        • Exhibit 44: Chart on Clinics and ASCs - Year-over-year growth 2023-2028 (%)
        • Exhibit 45: Data Table on Clinics and ASCs - Year-over-year growth 2023-2028 (%)
      • 6.6 Market opportunity by End-user
        • Exhibit 46: Market opportunity by End-user ($ billion)
        • Exhibit 47: Data Table on Market opportunity by End-user ($ billion)

      7 Market Segmentation by Product

      • 7.1 Market segments
        • Exhibit 48: Chart on Product - Market share 2023-2028 (%)
        • Exhibit 49: Data Table on Product - Market share 2023-2028 (%)
      • 7.2 Comparison by Product
        • Exhibit 50: Chart on Comparison by Product
        • Exhibit 51: Data Table on Comparison by Product
      • 7.3 Infusion pumps - Market size and forecast 2023-2028
        • Exhibit 52: Chart on Infusion pumps - Market size and forecast 2023-2028 ($ billion)
        • Exhibit 53: Data Table on Infusion pumps - Market size and forecast 2023-2028 ($ billion)
        • Exhibit 54: Chart on Infusion pumps - Year-over-year growth 2023-2028 (%)
        • Exhibit 55: Data Table on Infusion pumps - Year-over-year growth 2023-2028 (%)
      • 7.4 Consumables and accessories - Market size and forecast 2023-2028
        • Exhibit 56: Chart on Consumables and accessories - Market size and forecast 2023-2028 ($ billion)
        • Exhibit 57: Data Table on Consumables and accessories - Market size and forecast 2023-2028 ($ billion)
        • Exhibit 58: Chart on Consumables and accessories - Year-over-year growth 2023-2028 (%)
        • Exhibit 59: Data Table on Consumables and accessories - Year-over-year growth 2023-2028 (%)
      • 7.5 Market opportunity by Product
        • Exhibit 60: Market opportunity by Product ($ billion)
        • Exhibit 61: Data Table on Market opportunity by Product ($ billion)

      8 Customer Landscape

      • 8.1 Customer landscape overview
        • Exhibit 62: Analysis of price sensitivity, lifecycle, customer purchase basket, adoption rates, and purchase criteria

      9 Geographic Landscape

      • 9.1 Geographic segmentation
        • Exhibit 63: Chart on Market share by geography 2023-2028 (%)
        • Exhibit 64: Data Table on Market share by geography 2023-2028 (%)
      • 9.2 Geographic comparison
        • Exhibit 65: Chart on Geographic comparison
        • Exhibit 66: Data Table on Geographic comparison
      • 9.3 North America - Market size and forecast 2023-2028
        • Exhibit 67: Chart on North America - Market size and forecast 2023-2028 ($ billion)
        • Exhibit 68: Data Table on North America - Market size and forecast 2023-2028 ($ billion)
        • Exhibit 69: Chart on North America - Year-over-year growth 2023-2028 (%)
        • Exhibit 70: Data Table on North America - Year-over-year growth 2023-2028 (%)
      • 9.4 Europe - Market size and forecast 2023-2028
        • Exhibit 71: Chart on Europe - Market size and forecast 2023-2028 ($ billion)
        • Exhibit 72: Data Table on Europe - Market size and forecast 2023-2028 ($ billion)
        • Exhibit 73: Chart on Europe - Year-over-year growth 2023-2028 (%)
        • Exhibit 74: Data Table on Europe - Year-over-year growth 2023-2028 (%)
      • 9.5 Asia - Market size and forecast 2023-2028
        • Exhibit 75: Chart on Asia - Market size and forecast 2023-2028 ($ billion)
        • Exhibit 76: Data Table on Asia - Market size and forecast 2023-2028 ($ billion)
        • Exhibit 77: Chart on Asia - Year-over-year growth 2023-2028 (%)
        • Exhibit 78: Data Table on Asia - Year-over-year growth 2023-2028 (%)
      • 9.6 Rest of World (ROW) - Market size and forecast 2023-2028
        • Exhibit 79: Chart on Rest of World (ROW) - Market size and forecast 2023-2028 ($ billion)
        • Exhibit 80: Data Table on Rest of World (ROW) - Market size and forecast 2023-2028 ($ billion)
        • Exhibit 81: Chart on Rest of World (ROW) - Year-over-year growth 2023-2028 (%)
        • Exhibit 82: Data Table on Rest of World (ROW) - Year-over-year growth 2023-2028 (%)
      • 9.7 US - Market size and forecast 2023-2028
        • Exhibit 83: Chart on US - Market size and forecast 2023-2028 ($ billion)
        • Exhibit 84: Data Table on US - Market size and forecast 2023-2028 ($ billion)
        • Exhibit 85: Chart on US - Year-over-year growth 2023-2028 (%)
        • Exhibit 86: Data Table on US - Year-over-year growth 2023-2028 (%)
      • 9.8 Germany - Market size and forecast 2023-2028
        • Exhibit 87: Chart on Germany - Market size and forecast 2023-2028 ($ billion)
        • Exhibit 88: Data Table on Germany - Market size and forecast 2023-2028 ($ billion)
        • Exhibit 89: Chart on Germany - Year-over-year growth 2023-2028 (%)
        • Exhibit 90: Data Table on Germany - Year-over-year growth 2023-2028 (%)
      • 9.9 Japan - Market size and forecast 2023-2028
        • Exhibit 91: Chart on Japan - Market size and forecast 2023-2028 ($ billion)
        • Exhibit 92: Data Table on Japan - Market size and forecast 2023-2028 ($ billion)
        • Exhibit 93: Chart on Japan - Year-over-year growth 2023-2028 (%)
        • Exhibit 94: Data Table on Japan - Year-over-year growth 2023-2028 (%)
      • 9.10 China - Market size and forecast 2023-2028
        • Exhibit 95: Chart on China - Market size and forecast 2023-2028 ($ billion)
        • Exhibit 96: Data Table on China - Market size and forecast 2023-2028 ($ billion)
        • Exhibit 97: Chart on China - Year-over-year growth 2023-2028 (%)
        • Exhibit 98: Data Table on China - Year-over-year growth 2023-2028 (%)
      • 9.11 UK - Market size and forecast 2023-2028
        • Exhibit 99: Chart on UK - Market size and forecast 2023-2028 ($ billion)
        • Exhibit 100: Data Table on UK - Market size and forecast 2023-2028 ($ billion)
        • Exhibit 101: Chart on UK - Year-over-year growth 2023-2028 (%)
        • Exhibit 102: Data Table on UK - Year-over-year growth 2023-2028 (%)
      • 9.12 Market opportunity by geography
        • Exhibit 103: Market opportunity by geography ($ billion)
        • Exhibit 104: Data Tables on Market opportunity by geography ($ billion)

      10 Drivers, Challenges, and Trends

      • 10.1 Market drivers
        • 10.2 Market challenges
          • 10.3 Impact of drivers and challenges
            • Exhibit 105: Impact of drivers and challenges in 2023 and 2028
          • 10.4 Market trends

            11 Vendor Landscape

            • 11.1 Overview
              • 11.2 Vendor landscape
                • Exhibit 106: Overview on Criticality of inputs and Factors of differentiation
              • 11.3 Landscape disruption
                • Exhibit 107: Overview on factors of disruption
              • 11.4 Industry risks
                • Exhibit 108: Impact of key risks on business

              12 Vendor Analysis

              • 12.1 Vendors covered
                • Exhibit 109: Vendors covered
              • 12.2 Market positioning of vendors
                • Exhibit 110: Matrix on vendor position and classification
              • 12.3 AngioDynamics Inc.
                • Exhibit 111: AngioDynamics Inc. - Overview
                • Exhibit 112: AngioDynamics Inc. - Business segments
                • Exhibit 113: AngioDynamics Inc. - Key news
                • Exhibit 114: AngioDynamics Inc. - Key offerings
                • Exhibit 115: AngioDynamics Inc. - Segment focus
              • 12.4 B.Braun SE
                • Exhibit 116: B.Braun SE - Overview
                • Exhibit 117: B.Braun SE - Business segments
                • Exhibit 118: B.Braun SE - Key offerings
                • Exhibit 119: B.Braun SE - Segment focus
              • 12.5 Baxter International Inc.
                • Exhibit 120: Baxter International Inc. - Overview
                • Exhibit 121: Baxter International Inc. - Business segments
                • Exhibit 122: Baxter International Inc. - Key news
                • Exhibit 123: Baxter International Inc. - Key offerings
                • Exhibit 124: Baxter International Inc. - Segment focus
              • 12.6 Becton Dickinson and Company
                • Exhibit 125: Becton Dickinson and Company - Overview
                • Exhibit 126: Becton Dickinson and Company - Business segments
                • Exhibit 127: Becton Dickinson and Company - Key news
                • Exhibit 128: Becton Dickinson and Company - Key offerings
                • Exhibit 129: Becton Dickinson and Company - Segment focus
              • 12.7 Cardinal Health Inc.
                • Exhibit 130: Cardinal Health Inc. - Overview
                • Exhibit 131: Cardinal Health Inc. - Business segments
                • Exhibit 132: Cardinal Health Inc. - Key offerings
                • Exhibit 133: Cardinal Health Inc. - Segment focus
              • 12.8 Fresenius SE and Co. KGaA
                • Exhibit 134: Fresenius SE and Co. KGaA - Overview
                • Exhibit 135: Fresenius SE and Co. KGaA - Business segments
                • Exhibit 136: Fresenius SE and Co. KGaA - Key news
                • Exhibit 137: Fresenius SE and Co. KGaA - Key offerings
                • Exhibit 138: Fresenius SE and Co. KGaA - Segment focus
              • 12.9 ICU Medical Inc.
                • Exhibit 139: ICU Medical Inc. - Overview
                • Exhibit 140: ICU Medical Inc. - Product / Service
                • Exhibit 141: ICU Medical Inc. - Key offerings
              • 12.10 IRadimed Corp.
                • Exhibit 142: IRadimed Corp. - Overview
                • Exhibit 143: IRadimed Corp. - Product / Service
                • Exhibit 144: IRadimed Corp. - Key offerings
              • 12.11 Medtronic
                • Exhibit 145: Medtronic - Overview
                • Exhibit 146: Medtronic - Business segments
                • Exhibit 147: Medtronic - Key news
                • Exhibit 148: Medtronic - Key offerings
                • Exhibit 149: Medtronic - Segment focus
              • 12.12 Poly Medicure Ltd.
                • Exhibit 150: Poly Medicure Ltd. - Overview
                • Exhibit 151: Poly Medicure Ltd. - Product / Service
                • Exhibit 152: Poly Medicure Ltd. - Key offerings
              • 12.13 Smith and Nephew plc
                • Exhibit 153: Smith and Nephew plc - Overview
                • Exhibit 154: Smith and Nephew plc - Business segments
                • Exhibit 155: Smith and Nephew plc - Key news
                • Exhibit 156: Smith and Nephew plc - Key offerings
                • Exhibit 157: Smith and Nephew plc - Segment focus
              • 12.14 Tekni Plex Inc.
                • Exhibit 158: Tekni Plex Inc. - Overview
                • Exhibit 159: Tekni Plex Inc. - Product / Service
                • Exhibit 160: Tekni Plex Inc. - Key offerings
              • 12.15 Teleflex Inc.
                • Exhibit 161: Teleflex Inc. - Overview
                • Exhibit 162: Teleflex Inc. - Business segments
                • Exhibit 163: Teleflex Inc. - Key news
                • Exhibit 164: Teleflex Inc. - Key offerings
                • Exhibit 165: Teleflex Inc. - Segment focus
              • 12.16 Terumo Corp.
                • Exhibit 166: Terumo Corp. - Overview
                • Exhibit 167: Terumo Corp. - Business segments
                • Exhibit 168: Terumo Corp. - Key news
                • Exhibit 169: Terumo Corp. - Key offerings
                • Exhibit 170: Terumo Corp. - Segment focus
              • 12.17 Vygon SAS
                • Exhibit 171: Vygon SAS - Overview
                • Exhibit 172: Vygon SAS - Product / Service
                • Exhibit 173: Vygon SAS - Key offerings

              13 Appendix

              • 13.1 Scope of the report
                • 13.2 Inclusions and exclusions checklist
                  • Exhibit 174: Inclusions checklist
                  • Exhibit 175: Exclusions checklist
                • 13.3 Currency conversion rates for US$
                  • Exhibit 176: Currency conversion rates for US$
                • 13.4 Research methodology
                  • Exhibit 177: Research methodology
                  • Exhibit 178: Validation techniques employed for market sizing
                  • Exhibit 179: Information sources
                • 13.5 List of abbreviations
                  • Exhibit 180: List of abbreviations

                Research Methodology

                Technavio presents a detailed picture of the market by way of study, synthesis, and summation of data from multiple sources. The analysts have presented the various facets of the market with a particular focus on identifying the key industry influencers. The data thus presented is comprehensive, reliable, and the result of extensive research, both primary and secondary.

                INFORMATION SOURCES

                Primary sources

                • Manufacturers and suppliers
                • Channel partners
                • Industry experts
                • Strategic decision makers

                Secondary sources

                • Industry journals and periodicals
                • Government data
                • Financial reports of key industry players
                • Historical data
                • Press releases

                DATA ANALYSIS

                Data Synthesis

                • Collation of data
                • Estimation of key figures
                • Analysis of derived insights

                Data Validation

                • Triangulation with data models
                • Reference against proprietary databases
                • Corroboration with industry experts

                REPORT WRITING

                Qualitative

                • Market drivers
                • Market challenges
                • Market trends
                • Five forces analysis

                Quantitative

                • Market size and forecast
                • Market segmentation
                • Geographical insights
                • Competitive landscape

                Interested in this report?

                Get your sample now to see our research methodology and insights!

                Download Now

                Frequently Asked Questions

                Infusion Therapy Devices market growth will increase by $ 21.18 bn during 2024-2028 .

                The Infusion Therapy Devices market is expected to grow at a CAGR of 8.37% during 2024-2028 .

                Infusion Therapy Devices market is segmented by End-user( Hospitals, Homecare settings, Clinics and ASCs) Product( Infusion pumps, Consumables, accessories)

                Ace medical, AngioDynamics Inc., Avanos Medical Inc., B.Braun SE, Baxter International Inc., Becton Dickinson and Company, Canafusion Technologies Inc., Cardinal Health Inc., Chemyx Inc., ERENLER MEDIKAL SAN. TIC. LTD. STI., Fresenius SE and Co. KGaA, ICU Medical Inc., IRadimed Corp., Medtronic, Poly Medicure Ltd., Smith and Nephew plc, Tekni Plex Inc., Teleflex Inc., Terumo Corp., Vygon SAS are a few of the key vendors in the Infusion Therapy Devices market.

                North America will register the highest growth rate of 39% among the other regions. Therefore, the Infusion Therapy Devices market in North America is expected to garner significant business opportunities for the vendors during the forecast period.

                US, Germany, UK, Japan, China

                • Increasing prevalence of chronic diseasesThe global infusion therapy devices market is growing at a rapid rate worldwide is the driving factor this market.
                • driven by the prevalence of chronic conditions like cancer is the driving factor this market.
                • diabetes is the driving factor this market.
                • and heart disease. Infusion therapy devices are used to treat various medical conditions and are critical in delivering fluids is the driving factor this market.
                • electrolytes is the driving factor this market.
                • and medications to patients. According to the International Diabetes Federation (IDF) is the driving factor this market.
                • the number of people with diabetes is expected to reach 700 million by 2045. Diabetes patients require IV therapy and vein access for glucose management is the driving factor this market.
                • and the increasing prevalence of diabetes is expected to boost the demand for IV therapy and vein access during the forecast period. Moreover is the driving factor this market.
                • the rise in the number of cancer cases is also driving the demand for infusion therapy devices. Cancer patients often require IV therapy and vein access to manage chemotherapy side effects is the driving factor this market.
                • such as dehydration and electrolyte imbalances. According to the American Cancer Society is the driving factor this market.
                • the number of cancer cases is expected to reach 28.4 million worldwide by 2040 is the driving factor this market.
                • which is expected to further drive the demand for IV therapy and vein access during the forecast period. The increasing prevalence of chronic diseases is anticipated to drive the growth of the global infusion therapy devices market during the forecast period. is the driving factor this market.

                The Infusion Therapy Devices market vendors should focus on grabbing business opportunities from the Hospitals segment as it accounted for the largest market share in the base year.