IP Multimedia Subsystem Market Analysis APAC, North America, Europe, South America, Middle East and Africa - US, China, Japan, India, Germany - Size and Forecast 2024-2028

IP Multimedia Subsystem Market Analysis APAC, North America, Europe, South America, Middle East and Africa - US, China, Japan, India, Germany - Size and Forecast 2024-2028

Published: Oct 2023 165 Pages SKU: IRTNTR71421

Market Overview at a Glance

$42.35 B
Market Opportunity
18%
CAGR
16.79
YoY growth 2023-2024(%)

IP Multimedia Subsystem Market Size 2024-2028

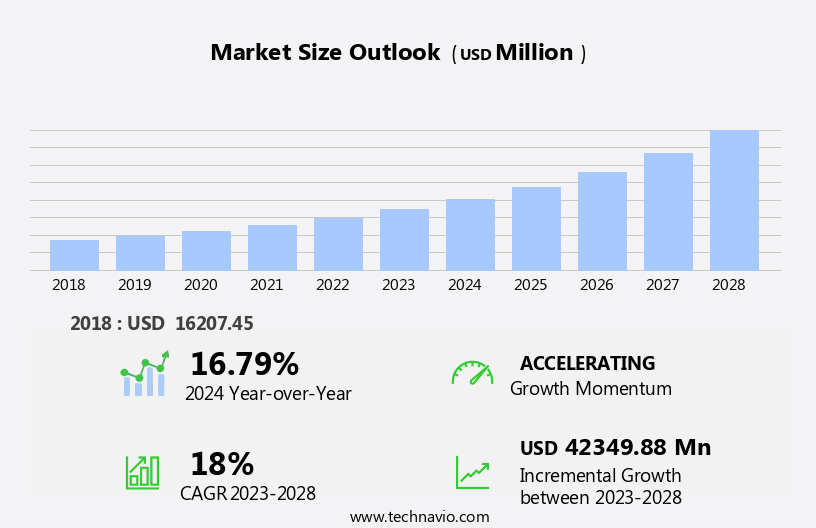
The ip multimedia subsystem market size is forecast to increase by USD 42.35 billion, at a CAGR of 18% between 2023 and 2028.

  • The IP Multimedia Subsystem (IMS) market is experiencing significant growth, driven by the global rollout of 5G networks and the proliferation of wireless technologies. The integration of IMS in 5G networks enables advanced multimedia services, such as high-definition voice and video calls, messaging, and multimedia conferencing. This convergence of telecommunications and IT services is expected to revolutionize the way businesses communicate and collaborate. However, the market faces challenges related to increasing data security and privacy concerns. With the growing adoption of cloud services and the Internet of Things (IoT), the risk of cyberattacks and data breaches is escalating.
  • IMS companies must prioritize security and privacy to gain the trust of businesses and consumers. Additionally, interoperability issues between different IMS implementations and the complexity of deploying and managing IMS networks pose significant challenges for market participants. Companies seeking to capitalize on the opportunities presented by the IMS market must focus on addressing these challenges through innovative solutions and collaborative partnerships.

What will be the Size of the IP Multimedia Subsystem Market during the forecast period?

IP Multimedia Subsystem Market Size

Explore in-depth regional segment analysis with market size data - historical 2018-2022 and forecasts 2024-2028 - in the full report.  
Request Free Sample

The IP Multimedia Subsystem (IMS) market continues to evolve, driven by the increasing demand for advanced communication services across various sectors. IMS is a standards-compliant architecture that seamlessly integrates subscriber data management, software defined networking, call recording, IMS architecture, network capacity planning, call transfer, fault management, network monitoring, IMS protocols, 5G IMS, signaling gateway, and network virtualization. Subscriber data management ensures user profile management, call forwarding, and home subscriber server functionality. Software defined networking enables call routing and network optimization, while call recording and fault management ensure service assurance and quality of service. IMS applications, such as multimedia messaging service, hosted IMS, and unified communications, offer enhanced user experiences.

The evolution of IMS includes the emergence of cloud-based IMS, SIP trunking, and fixed-mobile convergence. IMS services extend to call hold, call waiting, managed IMS, and next generation IMS. Performance management and security management are critical components, ensuring service reliability and user privacy. IMS components, including the media gateway controller, interworking unit, and IMS core network, require interoperability and compliance with Session Initiation Protocol (SIP) and H.323 protocols. Video conferencing and presence management are integral parts of IMS, offering real-time communication capabilities. IMS deployment models vary, from on-premise to managed services, catering to diverse business needs. The IMS market's continuous dynamism is reflected in the ongoing development of IMS components, protocols, and deployment models. IMS interoperability, network virtualization, and 5G IMS are key areas of focus, ensuring the delivery of high-quality, reliable, and secure communication services.

How is this IP Multimedia Subsystem Industry segmented?

The ip multimedia subsystem industry research report provides comprehensive data (region-wise segment analysis), with forecasts and estimates in "USD million" for the period 2024-2028, as well as historical data from 2018-2022 for the following segments.

  • Component
    • Product
    • Services
  • Application
    • Mobile operators
    • Fixed operators
  • Geography
    • North America
      • US
    • Europe
      • Germany
    • APAC
      • China
      • India
      • Japan
    • Rest of World (ROW)

By Component Insights

The product segment is estimated to witness significant growth during the forecast period.

The market is experiencing significant growth, driven by the increasing deployment of advanced communication solutions by telecom operators. IP multimedia subsystems, including VoLTE, VoWiFi, RCS, and UCaaS, are transforming networks into intelligent, device- and application-aware systems. Telecom and IT companies are introducing innovative IP multimedia subsystem solutions for mobile network operators (MNOs), enabling seamless integration of multimedia services. The proliferation of smartphones, tablets, wearables, and other wireless devices is fueling the demand for IP multimedia subsystems. Key components of IP multimedia subsystems, such as subscriber data management, software-defined networking, call recording, IMS architecture, network capacity planning, call transfer, subscriber management, fault management, network monitoring, IMS protocols, 5G IMS, signaling gateway, network virtualization, multimedia messaging service, IMS management, call hold, IMS evolution, diameter protocol, IMS applications, hosted IMS, performance management, cloud-based IMS, SIP trunking, call routing, standards compliance, call waiting, managed IMS, fixed-mobile convergence, on-premise IMS, service assurance, quality of service, security management, user profile management, call forwarding, home subscriber server, IMS interoperability, unified communications, network optimization, next-generation IMS, IMS services, presence management, IMS components, IMS deployment, media gateway controller, interworking unit, video conferencing, IMS core network, IMS security, call management, deployment models, session initiation protocol, and h.323 protocol, are all contributing to the market's expansion.

IP Multimedia Subsystem Market Size

Request Free Sample

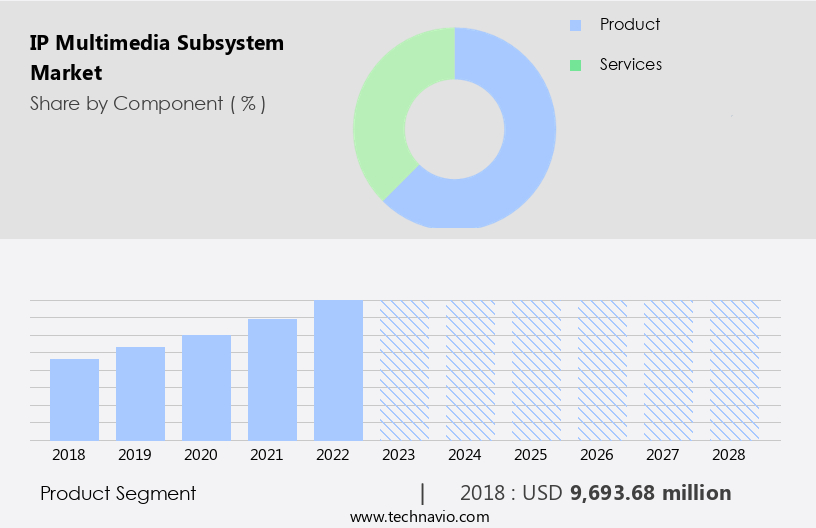
The Product segment was valued at USD 9.69 billion in 2018 and showed a gradual increase during the forecast period.

Regional Analysis

APAC is estimated to contribute 41% to the growth of the global market during the forecast period.Technavio's analysts have elaborately explained the regional trends and drivers that shape the market during the forecast period.

IP Multimedia Subsystem Market Share by Geography

 Request Free Sample

In the rapidly expanding economic landscape of APAC, the adoption of advanced technologies such as smart cities, autonomous vehicles, IoT applications, home automation, industrial automation, and intelligent processing technologies is driving market growth. Network infrastructure upgrades and the presence of a large number of mobile service providers in the region are further fueling this growth. Virtualization is gaining significant traction, with exponential adoption rates in APAC. The region's well-established telecom enterprises are contributing to high IP multimedia subsystem (IMS) sales. IMS is an essential component of next-generation networks, enabling services such as subscriber data management, call transfer, call waiting, call hold, and call management.

IMS architecture includes elements like the home subscriber server, media gateway controller, interworking unit, and IMS core network. IMS services also encompass multimedia messaging, presence management, and unified communications. IMS evolution includes the integration of 5G IMS, signaling gateway, network virtualization, and session initiation protocol (SIP trunking). IMS deployment models include cloud-based, managed, on-premise, and deployment models. IMS security, performance management, and fault management are crucial components of IMS. Standards compliance, network optimization, and quality of service are also essential considerations. IMS interoperability is a key factor in ensuring seamless communication between different networks and devices. Overall, the APAC market for IP multimedia subsystems is witnessing significant growth and innovation, driven by technological advancements and the expanding telecom industry.

Market Dynamics

Our researchers analyzed the data with 2023 as the base year, along with the key drivers, trends, and challenges. A holistic analysis of drivers will help companies refine their marketing strategies to gain a competitive advantage.

What are the key market drivers leading to the rise in the adoption of IP Multimedia Subsystem Industry?

  • The rollout of 5G networks serves as the primary catalyst for market growth, driving innovation and advancement in various industries. 
  • The IP Multimedia Subsystem (IMS) market has experienced significant growth due to the increasing adoption of 5G networks. With governments and manufacturers actively supporting the rollout of 5G, the number of global 5G subscriptions surpassed 170 million by Q2 2023, bringing the total to between 1.0 and 1.5 billion worldwide. IMS plays a crucial role in the 5G ecosystem, enabling advanced multimedia services and ensuring low-latency communication, key benefits of 5G. In the US, the Federal Communications Commission (FCC) auctioned critical 5G spectrum bands in March 2021, underscoring the country's commitment to 5G deployment. IMS services, including presence management, call management, and video conferencing, rely on Session Initiation Protocol (SIP) and Interworking Unit (IWU) to facilitate communication between different networks.
  • Media Gateway Controllers (MGC) and IMS Core Networks manage and secure these services. IMS security is a critical concern, with encryption, authentication, and access control essential to protect user data and privacy. Deployment models include cloud, on-premises, and hybrid, with each offering unique advantages depending on organizational needs. H.323 protocol is another communication protocol used alongside SIP in some IMS deployments.

What are the market trends shaping the IP Multimedia Subsystem Industry?

  • The proliferation of wireless technologies represents a significant market trend. This trend is driven by advancements in wireless communication and the increasing demand for connectivity and mobility.
  • The IP Multimedia Subsystem (IMS) market is experiencing significant growth due to the increasing demand for advanced subscriber data management and network capabilities in telecommunications. IMS architecture, which includes software-defined networking, call recording, and signaling gateway, is essential for managing network capacity and enabling call transfer, fault management, network monitoring, and adherence to IMS protocols. The advent of 5G IMS is further propelling the market forward, as it offers increased network virtualization and improved network performance. As the Internet of Things (IoT) continues to expand, the number of connected devices will require robust network infrastructure to support the transmission of vast amounts of data.
  • Wireless standards such as 4G and 5G, along with wireless technologies like Bluetooth Low-Energy (BLE), Wi-Fi, ZigBee, and Z-Wave, are essential in providing immersive, harmonious wireless connections that are equivalent to broadband. In conclusion, recent research indicates that the IMS market will continue to grow as businesses and consumers increasingly rely on advanced telecommunications networks to support their evolving connectivity needs.

What challenges does the IP Multimedia Subsystem Industry face during its growth?

  • The escalating importance of data security and privacy is a significant challenge that necessitates robust solutions, threatening to impede industry growth if not adequately addressed. 
  • The IP Multimedia Subsystem (IMS) market is witnessing significant growth due to the increasing adoption of multimedia messaging services (MMS) and IMS management solutions. IMS applications, such as call hold, call waiting, and call routing, are becoming essential for businesses seeking to enhance their communication capabilities. The evolution of IMS is being driven by the Diameter protocol, which ensures standards compliance and enables interoperability between various network elements. Cloud-based IMS and SIP trunking are gaining popularity due to their cost-effective and flexible offerings. Performance management is a critical aspect of IMS, ensuring seamless delivery of multimedia services and maintaining optimal network performance.
  • Security remains a top priority, with advanced security measures being implemented to protect against potential threats. The IMS environment is constantly evolving to address new challenges, with a focus on harmonious integration of various network components and striking a balance between functionality and security. In conclusion, recent research indicates that the IMS market will continue to grow as businesses seek to enhance their communication capabilities and address the increasing demand for advanced multimedia services.

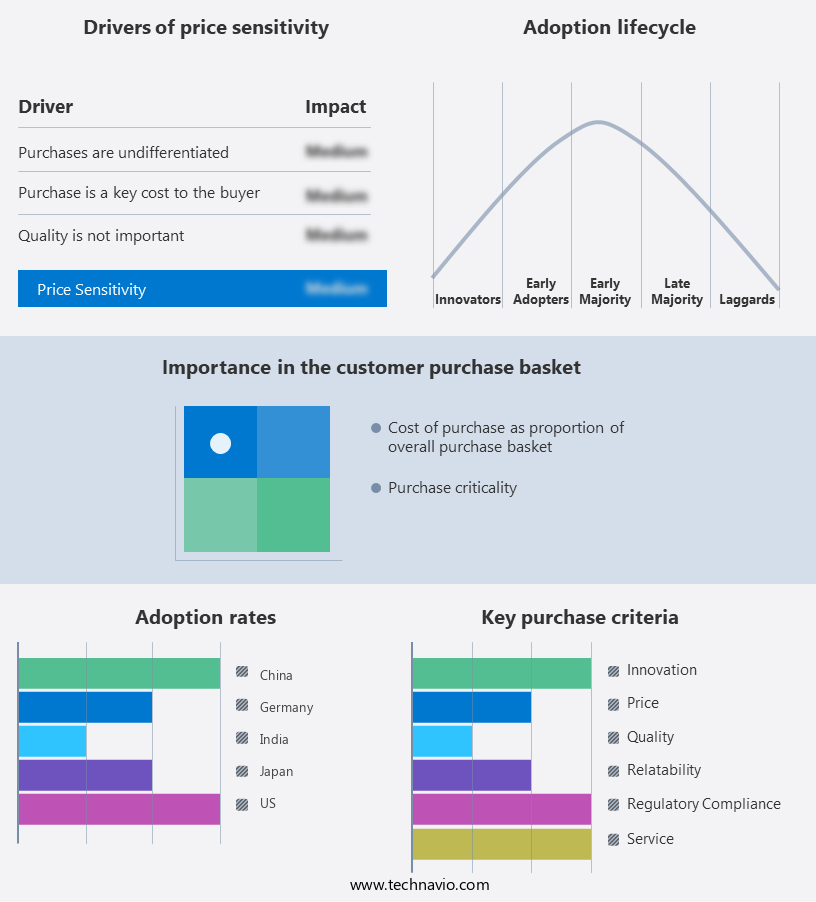
Exclusive Customer Landscape

The ip multimedia subsystem market forecasting report includes the adoption lifecycle of the market, covering from the innovator's stage to the laggard's stage. It focuses on adoption rates in different regions based on penetration. Furthermore, the ip multimedia subsystem market report also includes key purchase criteria and drivers of price sensitivity to help companies evaluate and develop their market growth analysis strategies.

IP Multimedia Subsystem Market Share by Geography

 Customer Landscape

Key Companies & Market Insights

Companies are implementing various strategies, such as strategic alliances, ip multimedia subsystem market forecast, partnerships, mergers and acquisitions, geographical expansion, and product/service launches, to enhance their presence in the industry.

Amdocs Ltd. - Amdocs Ltd. Delivers an IP multimedia subsystem, enhancing business agility through advanced communications services. This technology empowers organizations to streamline operations, improve customer engagement, and drive innovation. By leveraging cutting-edge multimedia capabilities, businesses can accelerate their digital transformation journey. Amdocs' solutions are designed to foster flexibility, scalability, and reliability, ensuring optimal performance and seamless integration with existing systems. The company's offerings encompass a wide range of services, including messaging, voice, video, and data solutions, all aimed at enhancing business productivity and competitiveness. By embracing Amdocs' IP multimedia subsystem, organizations can effectively meet the evolving communication needs of their customers and employees, ultimately leading to enhanced customer satisfaction and loyalty.

The industry research and growth report includes detailed analyses of the competitive landscape of the market and information about key companies, including:

  • Amdocs Ltd.
  • Athonet Srl
  • Cisco Systems Inc.
  • Enghouse Systems Ltd.
  • Genesys Telecommunications Laboratories Inc.
  • Hewlett Packard Enterprise Co.
  • Huawei Technologies Co. Ltd.
  • Italtel S.p.A.
  • Juniper Networks Inc.
  • Mavenir Systems Inc.
  • Mitel Networks Corp.
  • NEC Corp.
  • Nokia Corp.
  • Oracle Corp.
  • Reliance Industries Ltd.
  • Ribbon Communications Inc.
  • Samsung Electronics Co. Ltd.
  • Telefonaktiebolaget LM Ericsson
  • ZTE Corp.
  • Cirpack

Qualitative and quantitative analysis of companies has been conducted to help clients understand the wider business environment as well as the strengths and weaknesses of key industry players. Data is qualitatively analyzed to categorize companies as pure play, category-focused, industry-focused, and diversified; it is quantitatively analyzed to categorize companies as dominant, leading, strong, tentative, and weak.

Recent Development and News in IP Multimedia Subsystem Market

  • In February 2023, Nokia and Deutsche Telekom announced a strategic collaboration to deploy IP Multimedia Subsystem (IMS) solutions in Deutsche Telekom's fixed and mobile networks. This partnership aimed to enhance voice and multimedia services, providing a more seamless user experience for customers (Nokia Press Release).
  • In April 2024, Huawei Technologies launched its latest IMS solution, the Cloud-Native IMS, which offers improved scalability and flexibility for telecom operators. This solution enables the delivery of advanced communication services, such as VoLTE, RCS, and video conferencing (Huawei Press Release).
  • In January 2025, Oracle Communications and Syniverse entered into a partnership to integrate Oracle's IMS platform with Syniverse's messaging and voice services. This collaboration aimed to provide enhanced communication services for mobile network operators, enabling them to offer advanced messaging and voice capabilities to their customers (Oracle Communications Press Release).
  • In March 2025, the European Union's European Electronic Communications Code came into effect, mandating the deployment of Next-Generation Services (NGS), including IMS, by telecom operators. This regulatory change is expected to drive significant growth in the market, as operators invest in upgrading their networks to meet the new requirements (European Parliament and Council of the European Union).

Research Analyst Overview

  • The IP Multimedia Subsystem (IMS) market is experiencing significant growth, driven by the increasing demand for real-time communication and multimedia services in business environments. IMS, a packet-based networking solution, enables network operations to deliver advanced network services such as multimedia telephony, mobility management, and network analytics. Network infrastructure plays a crucial role in IMS implementation, requiring robust network security, network anti-virus, network anti-malware, network intrusion detection, network intrusion prevention, and network performance monitoring. Network management and network troubleshooting are essential for optimizing network capacity planning and network implementation. Network cost optimization is a key trend, with network policy management and network firewall solutions helping businesses maintain network security while minimizing expenses.
  • Application programming interfaces (APIs) facilitate network design and network maintenance, while network identity management ensures secure access to network services. Network services, including network security monitoring and network design, are increasingly important for businesses seeking to enhance their network performance and network optimization. Network design involves careful planning to accommodate multimedia communication, while network capacity planning ensures the network can handle increased traffic demands. Network implementation requires careful consideration of network design, network maintenance, and network cost optimization to ensure a successful deployment. Network performance monitoring and network optimization are ongoing processes to maintain network efficiency and address any performance issues.

Dive into Technavio's robust research methodology, blending expert interviews, extensive data synthesis, and validated models for unparalleled IP Multimedia Subsystem Market insights. See full methodology.

Market Scope

Report Coverage

Details

Page number

165

Base year

2023

Historic period

2018-2022

Forecast period

2024-2028

Growth momentum & CAGR

Accelerate at a CAGR of 18%

Market growth 2024-2028

USD 42349.88 million

Market structure

Fragmented

YoY growth 2023-2024(%)

16.79

Key countries

US, China, Japan, India, and Germany

Competitive landscape

Leading Companies, Market Positioning of Companies, Competitive Strategies, and Industry Risks

Request Free Sample

What are the Key Data Covered in this IP Multimedia Subsystem Market Research and Growth Report?

  • CAGR of the IP Multimedia Subsystem industry during the forecast period
  • Detailed information on factors that will drive the growth and forecasting between 2024 and 2028
  • Precise estimation of the size of the market and its contribution of the industry in focus to the parent market
  • Accurate predictions about upcoming growth and trends and changes in consumer behaviour
  • Growth of the market across APAC, North America, Europe, South America, and Middle East and Africa
  • Thorough analysis of the market's competitive landscape and detailed information about companies
  • Comprehensive analysis of factors that will challenge the ip multimedia subsystem market growth of industry companies

We can help! Our analysts can customize this ip multimedia subsystem market research report to meet your requirements.

Get in touch

1 Executive Summary

  • 1.1 Market overview
    • Exhibit 01: Executive Summary – Chart on Market Overview
    • Exhibit 02: Executive Summary – Data Table on Market Overview
    • Exhibit 03: Executive Summary – Chart on Global Market Characteristics
    • Exhibit 04: Executive Summary – Chart on Market by Geography
    • Exhibit 05: Executive Summary – Chart on Market Segmentation by Component
    • Exhibit 06: Executive Summary – Chart on Market Segmentation by Application
    • Exhibit 07: Executive Summary – Chart on Incremental Growth
    • Exhibit 08: Executive Summary – Data Table on Incremental Growth
    • Exhibit 09: Executive Summary – Chart on Vendor Market Positioning

2 Market Landscape

  • 2.1 Market ecosystem
    • Exhibit 10: Parent market
    • Exhibit 11: Market Characteristics

3 Market Sizing

  • 3.1 Market definition
    • Exhibit 12: Offerings of vendors included in the market definition
  • 3.2 Market segment analysis
    • Exhibit 13: Market segments
  • 3.3 Market size 2023
    • 3.4 Market outlook: Forecast for 2023-2028
      • Exhibit 14: Chart on Global - Market size and forecast 2023-2028 ($ million)
      • Exhibit 15: Data Table on Global - Market size and forecast 2023-2028 ($ million)
      • Exhibit 16: Chart on Global Market: Year-over-year growth 2023-2028 (%)
      • Exhibit 17: Data Table on Global Market: Year-over-year growth 2023-2028 (%)

    4 Historic Market Size

    • 4.1 Global IP multimedia subsystem market 2018 - 2022
      • Exhibit 18: Historic Market Size – Data Table on global ip multimedia subsystem market 2018 - 2022 ($ million)
    • 4.2 Component Segment Analysis 2018 - 2022
      • Exhibit 19: Historic Market Size – Component Segment 2018 - 2022 ($ million)
    • 4.3 Application Segment Analysis 2018 - 2022
      • Exhibit 20: Historic Market Size – Application Segment 2018 - 2022 ($ million)
    • 4.4 Geography Segment Analysis 2018 - 2022
      • Exhibit 21: Historic Market Size – Geography Segment 2018 - 2022 ($ million)
    • 4.5 Country Segment Analysis 2018 - 2022
      • Exhibit 22: Historic Market Size – Country Segment 2018 - 2022 ($ million)

    5 Five Forces Analysis

    • 5.1 Five forces summary
      • Exhibit 23: Five forces analysis - Comparison between 2023 and 2028
    • 5.2 Bargaining power of buyers
      • Exhibit 24: Chart on Bargaining power of buyers – Impact of key factors 2023 and 2028
    • 5.3 Bargaining power of suppliers
      • Exhibit 25: Bargaining power of suppliers – Impact of key factors in 2023 and 2028
    • 5.4 Threat of new entrants
      • Exhibit 26: Threat of new entrants – Impact of key factors in 2023 and 2028
    • 5.5 Threat of substitutes
      • Exhibit 27: Threat of substitutes – Impact of key factors in 2023 and 2028
    • 5.6 Threat of rivalry
      • Exhibit 28: Threat of rivalry – Impact of key factors in 2023 and 2028
    • 5.7 Market condition
      • Exhibit 29: Chart on Market condition - Five forces 2023 and 2028

    6 Market Segmentation by Component

    • 6.1 Market segments
      • Exhibit 30: Chart on Component - Market share 2023-2028 (%)
      • Exhibit 31: Data Table on Component - Market share 2023-2028 (%)
    • 6.2 Comparison by Component
      • Exhibit 32: Chart on Comparison by Component
      • Exhibit 33: Data Table on Comparison by Component
    • 6.3 Product - Market size and forecast 2023-2028
      • Exhibit 34: Chart on Product - Market size and forecast 2023-2028 ($ million)
      • Exhibit 35: Data Table on Product - Market size and forecast 2023-2028 ($ million)
      • Exhibit 36: Chart on Product - Year-over-year growth 2023-2028 (%)
      • Exhibit 37: Data Table on Product - Year-over-year growth 2023-2028 (%)
    • 6.4 Services - Market size and forecast 2023-2028
      • Exhibit 38: Chart on Services - Market size and forecast 2023-2028 ($ million)
      • Exhibit 39: Data Table on Services - Market size and forecast 2023-2028 ($ million)
      • Exhibit 40: Chart on Services - Year-over-year growth 2023-2028 (%)
      • Exhibit 41: Data Table on Services - Year-over-year growth 2023-2028 (%)
    • 6.5 Market opportunity by Component
      • Exhibit 42: Market opportunity by Component ($ million)
      • Exhibit 43: Data Table on Market opportunity by Component ($ million)

    7 Market Segmentation by Application

    • 7.1 Market segments
      • Exhibit 44: Chart on Application - Market share 2023-2028 (%)
      • Exhibit 45: Data Table on Application - Market share 2023-2028 (%)
    • 7.2 Comparison by Application
      • Exhibit 46: Chart on Comparison by Application
      • Exhibit 47: Data Table on Comparison by Application
    • 7.3 Mobile operators - Market size and forecast 2023-2028
      • Exhibit 48: Chart on Mobile operators - Market size and forecast 2023-2028 ($ million)
      • Exhibit 49: Data Table on Mobile operators - Market size and forecast 2023-2028 ($ million)
      • Exhibit 50: Chart on Mobile operators - Year-over-year growth 2023-2028 (%)
      • Exhibit 51: Data Table on Mobile operators - Year-over-year growth 2023-2028 (%)
    • 7.4 Fixed operators - Market size and forecast 2023-2028
      • Exhibit 52: Chart on Fixed operators - Market size and forecast 2023-2028 ($ million)
      • Exhibit 53: Data Table on Fixed operators - Market size and forecast 2023-2028 ($ million)
      • Exhibit 54: Chart on Fixed operators - Year-over-year growth 2023-2028 (%)
      • Exhibit 55: Data Table on Fixed operators - Year-over-year growth 2023-2028 (%)
    • 7.5 Market opportunity by Application
      • Exhibit 56: Market opportunity by Application ($ million)
      • Exhibit 57: Data Table on Market opportunity by Application ($ million)

    8 Customer Landscape

    • 8.1 Customer landscape overview
      • Exhibit 58: Analysis of price sensitivity, lifecycle, customer purchase basket, adoption rates, and purchase criteria

    9 Geographic Landscape

    • 9.1 Geographic segmentation
      • Exhibit 59: Chart on Market share by geography 2023-2028 (%)
      • Exhibit 60: Data Table on Market share by geography 2023-2028 (%)
    • 9.2 Geographic comparison
      • Exhibit 61: Chart on Geographic comparison
      • Exhibit 62: Data Table on Geographic comparison
    • 9.3 APAC - Market size and forecast 2023-2028
      • Exhibit 63: Chart on APAC - Market size and forecast 2023-2028 ($ million)
      • Exhibit 64: Data Table on APAC - Market size and forecast 2023-2028 ($ million)
      • Exhibit 65: Chart on APAC - Year-over-year growth 2023-2028 (%)
      • Exhibit 66: Data Table on APAC - Year-over-year growth 2023-2028 (%)
    • 9.4 North America - Market size and forecast 2023-2028
      • Exhibit 67: Chart on North America - Market size and forecast 2023-2028 ($ million)
      • Exhibit 68: Data Table on North America - Market size and forecast 2023-2028 ($ million)
      • Exhibit 69: Chart on North America - Year-over-year growth 2023-2028 (%)
      • Exhibit 70: Data Table on North America - Year-over-year growth 2023-2028 (%)
    • 9.5 Europe - Market size and forecast 2023-2028
      • Exhibit 71: Chart on Europe - Market size and forecast 2023-2028 ($ million)
      • Exhibit 72: Data Table on Europe - Market size and forecast 2023-2028 ($ million)
      • Exhibit 73: Chart on Europe - Year-over-year growth 2023-2028 (%)
      • Exhibit 74: Data Table on Europe - Year-over-year growth 2023-2028 (%)
    • 9.6 South America - Market size and forecast 2023-2028
      • Exhibit 75: Chart on South America - Market size and forecast 2023-2028 ($ million)
      • Exhibit 76: Data Table on South America - Market size and forecast 2023-2028 ($ million)
      • Exhibit 77: Chart on South America - Year-over-year growth 2023-2028 (%)
      • Exhibit 78: Data Table on South America - Year-over-year growth 2023-2028 (%)
    • 9.7 Middle East and Africa - Market size and forecast 2023-2028
      • Exhibit 79: Chart on Middle East and Africa - Market size and forecast 2023-2028 ($ million)
      • Exhibit 80: Data Table on Middle East and Africa - Market size and forecast 2023-2028 ($ million)
      • Exhibit 81: Chart on Middle East and Africa - Year-over-year growth 2023-2028 (%)
      • Exhibit 82: Data Table on Middle East and Africa - Year-over-year growth 2023-2028 (%)
    • 9.8 China - Market size and forecast 2023-2028
      • Exhibit 83: Chart on China - Market size and forecast 2023-2028 ($ million)
      • Exhibit 84: Data Table on China - Market size and forecast 2023-2028 ($ million)
      • Exhibit 85: Chart on China - Year-over-year growth 2023-2028 (%)
      • Exhibit 86: Data Table on China - Year-over-year growth 2023-2028 (%)
    • 9.9 US - Market size and forecast 2023-2028
      • Exhibit 87: Chart on US - Market size and forecast 2023-2028 ($ million)
      • Exhibit 88: Data Table on US - Market size and forecast 2023-2028 ($ million)
      • Exhibit 89: Chart on US - Year-over-year growth 2023-2028 (%)
      • Exhibit 90: Data Table on US - Year-over-year growth 2023-2028 (%)
    • 9.10 Germany - Market size and forecast 2023-2028
      • Exhibit 91: Chart on Germany - Market size and forecast 2023-2028 ($ million)
      • Exhibit 92: Data Table on Germany - Market size and forecast 2023-2028 ($ million)
      • Exhibit 93: Chart on Germany - Year-over-year growth 2023-2028 (%)
      • Exhibit 94: Data Table on Germany - Year-over-year growth 2023-2028 (%)
    • 9.11 Japan - Market size and forecast 2023-2028
      • Exhibit 95: Chart on Japan - Market size and forecast 2023-2028 ($ million)
      • Exhibit 96: Data Table on Japan - Market size and forecast 2023-2028 ($ million)
      • Exhibit 97: Chart on Japan - Year-over-year growth 2023-2028 (%)
      • Exhibit 98: Data Table on Japan - Year-over-year growth 2023-2028 (%)
    • 9.12 India - Market size and forecast 2023-2028
      • Exhibit 99: Chart on India - Market size and forecast 2023-2028 ($ million)
      • Exhibit 100: Data Table on India - Market size and forecast 2023-2028 ($ million)
      • Exhibit 101: Chart on India - Year-over-year growth 2023-2028 (%)
      • Exhibit 102: Data Table on India - Year-over-year growth 2023-2028 (%)
    • 9.13 Market opportunity by geography
      • Exhibit 103: Market opportunity by geography ($ million)
      • Exhibit 104: Data Tables on Market opportunity by geography ($ million)

    10 Drivers, Challenges, and Trends

    • 10.1 Market drivers
      • 10.2 Market challenges
        • 10.3 Impact of drivers and challenges
          • Exhibit 105: Impact of drivers and challenges in 2023 and 2028
        • 10.4 Market trends

          11 Vendor Landscape

          • 11.1 Overview
            • 11.2 Vendor landscape
              • Exhibit 106: Overview on Criticality of inputs and Factors of differentiation
            • 11.3 Landscape disruption
              • Exhibit 107: Overview on factors of disruption
            • 11.4 Industry risks
              • Exhibit 108: Impact of key risks on business

            12 Vendor Analysis

            • 12.1 Vendors covered
              • Exhibit 109: Vendors covered
            • 12.2 Market positioning of vendors
              • Exhibit 110: Matrix on vendor position and classification
            • 12.3 Amdocs Ltd.
              • Exhibit 111: Amdocs Ltd. - Overview
              • Exhibit 112: Amdocs Ltd. - Product / Service
              • Exhibit 113: Amdocs Ltd. - Key offerings
            • 12.4 Cirpack
              • Exhibit 114: Cirpack - Overview
              • Exhibit 115: Cirpack - Product / Service
              • Exhibit 116: Cirpack - Key offerings
            • 12.5 Cisco Systems Inc.
              • Exhibit 117: Cisco Systems Inc. - Overview
              • Exhibit 118: Cisco Systems Inc. - Business segments
              • Exhibit 119: Cisco Systems Inc. - Key news
              • Exhibit 120: Cisco Systems Inc. - Key offerings
              • Exhibit 121: Cisco Systems Inc. - Segment focus
            • 12.6 Enghouse Systems Ltd.
              • Exhibit 122: Enghouse Systems Ltd. - Overview
              • Exhibit 123: Enghouse Systems Ltd. - Business segments
              • Exhibit 124: Enghouse Systems Ltd. - Key offerings
              • Exhibit 125: Enghouse Systems Ltd. - Segment focus
            • 12.7 Huawei Technologies Co. Ltd.
              • Exhibit 126: Huawei Technologies Co. Ltd. - Overview
              • Exhibit 127: Huawei Technologies Co. Ltd. - Business segments
              • Exhibit 128: Huawei Technologies Co. Ltd. - Key news
              • Exhibit 129: Huawei Technologies Co. Ltd. - Key offerings
              • Exhibit 130: Huawei Technologies Co. Ltd. - Segment focus
            • 12.8 Italtel S.p.A.
              • Exhibit 131: Italtel S.p.A. - Overview
              • Exhibit 132: Italtel S.p.A. - Product / Service
              • Exhibit 133: Italtel S.p.A. - Key offerings
            • 12.9 Mavenir Systems Inc.
              • Exhibit 134: Mavenir Systems Inc. - Overview
              • Exhibit 135: Mavenir Systems Inc. - Product / Service
              • Exhibit 136: Mavenir Systems Inc. - Key offerings
            • 12.10 Mitel Networks Corp.
              • Exhibit 137: Mitel Networks Corp. - Overview
              • Exhibit 138: Mitel Networks Corp. - Product / Service
              • Exhibit 139: Mitel Networks Corp. - Key offerings
            • 12.11 NEC Corp.
              • Exhibit 140: NEC Corp. - Overview
              • Exhibit 141: NEC Corp. - Business segments
              • Exhibit 142: NEC Corp. - Key news
              • Exhibit 143: NEC Corp. - Key offerings
              • Exhibit 144: NEC Corp. - Segment focus
            • 12.12 Nokia Corp.
              • Exhibit 145: Nokia Corp. - Overview
              • Exhibit 146: Nokia Corp. - Business segments
              • Exhibit 147: Nokia Corp. - Key offerings
              • Exhibit 148: Nokia Corp. - Segment focus
            • 12.13 Oracle Corp.
              • Exhibit 149: Oracle Corp. - Overview
              • Exhibit 150: Oracle Corp. - Business segments
              • Exhibit 151: Oracle Corp. - Key news
              • Exhibit 152: Oracle Corp. - Key offerings
              • Exhibit 153: Oracle Corp. - Segment focus
            • 12.14 Ribbon Communications Inc.
              • Exhibit 154: Ribbon Communications Inc. - Overview
              • Exhibit 155: Ribbon Communications Inc. - Business segments
              • Exhibit 156: Ribbon Communications Inc. - Key offerings
              • Exhibit 157: Ribbon Communications Inc. - Segment focus
            • 12.15 Samsung Electronics Co. Ltd.
              • Exhibit 158: Samsung Electronics Co. Ltd. - Overview
              • Exhibit 159: Samsung Electronics Co. Ltd. - Business segments
              • Exhibit 160: Samsung Electronics Co. Ltd. - Key news
              • Exhibit 161: Samsung Electronics Co. Ltd. - Key offerings
              • Exhibit 162: Samsung Electronics Co. Ltd. - Segment focus
            • 12.16 Telefonaktiebolaget LM Ericsson
              • Exhibit 163: Telefonaktiebolaget LM Ericsson - Overview
              • Exhibit 164: Telefonaktiebolaget LM Ericsson - Business segments
              • Exhibit 165: Telefonaktiebolaget LM Ericsson - Key news
              • Exhibit 166: Telefonaktiebolaget LM Ericsson - Key offerings
              • Exhibit 167: Telefonaktiebolaget LM Ericsson - Segment focus
            • 12.17 ZTE Corp.
              • Exhibit 168: ZTE Corp. - Overview
              • Exhibit 169: ZTE Corp. - Business segments
              • Exhibit 170: ZTE Corp. - Key news
              • Exhibit 171: ZTE Corp. - Key offerings
              • Exhibit 172: ZTE Corp. - Segment focus

            13 Appendix

            • 13.1 Scope of the report
              • 13.2 Inclusions and exclusions checklist
                • Exhibit 173: Inclusions checklist
                • Exhibit 174: Exclusions checklist
              • 13.3 Currency conversion rates for US$
                • Exhibit 175: Currency conversion rates for US$
              • 13.4 Research methodology
                • Exhibit 176: Research methodology
                • Exhibit 177: Validation techniques employed for market sizing
                • Exhibit 178: Information sources
              • 13.5 List of abbreviations
                • Exhibit 179: List of abbreviations

              Research Methodology

              Technavio presents a detailed picture of the market by way of study, synthesis, and summation of data from multiple sources. The analysts have presented the various facets of the market with a particular focus on identifying the key industry influencers. The data thus presented is comprehensive, reliable, and the result of extensive research, both primary and secondary.

              INFORMATION SOURCES

              Primary sources

              • Manufacturers and suppliers
              • Channel partners
              • Industry experts
              • Strategic decision makers

              Secondary sources

              • Industry journals and periodicals
              • Government data
              • Financial reports of key industry players
              • Historical data
              • Press releases

              DATA ANALYSIS

              Data Synthesis

              • Collation of data
              • Estimation of key figures
              • Analysis of derived insights

              Data Validation

              • Triangulation with data models
              • Reference against proprietary databases
              • Corroboration with industry experts

              REPORT WRITING

              Qualitative

              • Market drivers
              • Market challenges
              • Market trends
              • Five forces analysis

              Quantitative

              • Market size and forecast
              • Market segmentation
              • Geographical insights
              • Competitive landscape

              Interested in this report?

              Get your sample now to see our research methodology and insights!

              Download Now

              Frequently Asked Questions

              IP Multimedia Subsystem market growth will increase by $ 42349.88 mn during 2024-2028 .

              The IP Multimedia Subsystem market is expected to grow at a CAGR of 18% during 2024-2028 .

              IP Multimedia Subsystem market is segmented by Component( Product, Services) Application( Mobile operators, Fixed operators, Europe, South America, MEA)

              Amdocs Ltd., Athonet Srl, Cisco Systems Inc., Enghouse Systems Ltd., Genesys Telecommunications Laboratories Inc., Hewlett Packard Enterprise Co., Huawei Technologies Co. Ltd., Italtel S.p.A., Juniper Networks Inc., Mavenir Systems Inc., Mitel Networks Corp., NEC Corp., Nokia Corp., Oracle Corp., Reliance Industries Ltd., Ribbon Communications Inc., Samsung Electronics Co. Ltd., Telefonaktiebolaget LM Ericsson, ZTE Corp., Cirpack are a few of the key vendors in the IP Multimedia Subsystem market.

              APAC will register the highest growth rate of 41% among the other regions. Therefore, the IP Multimedia Subsystem market in APAC is expected to garner significant business opportunities for the vendors during the forecast period.

              US, China, Japan, India, Germany

              • Rollout of 5G networksThe introduction of 5G networks is the driving factor this market.
              • a major factor that has picked up steam since late 2019 is the driving factor this market.
              • has a considerable impact on the growth of the global IP Multimedia Subsystem market. Governments and manufacturers actively support the growth of 5G. Notably is the driving factor this market.
              • as of Q2 2023 is the driving factor this market.
              • global 5G subscriptions increased by more than 170 million is the driving factor this market.
              • bringing the total number of users to between 1.0 and 1.5 billion worldwide. In the 5G ecosystem is the driving factor this market.
              • IP multimedia subsystems are essential because they make it possible to supply cutting-edge multimedia services and ensure low-latency communication is the driving factor this market.
              • which are the two key benefits of 5G. For instance is the driving factor this market.
              • in the US is the driving factor this market.
              • the FCC auctioned critical 5G spectrum bands in March 2021 is the driving factor this market.
              • demonstrating the countrys dedication to the deployment of 5G. In order to support the expanding 5G infrastructure is the driving factor this market.
              • market vendors like Ericsson and Huawei have been working hard to build IP multimedia subsystem solutions. The need for IP multimedia subsystems is expected to expand significantly as a result of the anticipated surge in 5G adoption for applications like driverless vehicles is the driving factor this market.
              • the Internet of Things is the driving factor this market.
              • and augmented reality is the driving factor this market.
              • making these applications major growth drivers in the global IP multimedia subsystem market during the forecast period. is the driving factor this market.

              The IP Multimedia Subsystem market vendors should focus on grabbing business opportunities from the Product segment as it accounted for the largest market share in the base year.