Isolated Gate Drivers Market Analysis, Size, and Forecast 2025-2029: North America (US and Canada), Europe (France, Germany, and UK), APAC (China, India, Japan, and South Korea), South America (Brazil), and Rest of World (ROW)

Isolated Gate Drivers Market Analysis, Size, and Forecast 2025-2029:
North America (US and Canada), Europe (France, Germany, and UK), APAC (China, India, Japan, and South Korea), South America (Brazil), and Rest of World (ROW)

Published: Jul 2025 242 Pages SKU: IRTNTR80797

Market Overview at a Glance

$1.35 B
Market Opportunity
15.1%
CAGR
14.0
YoY growth 2024-2025(%)

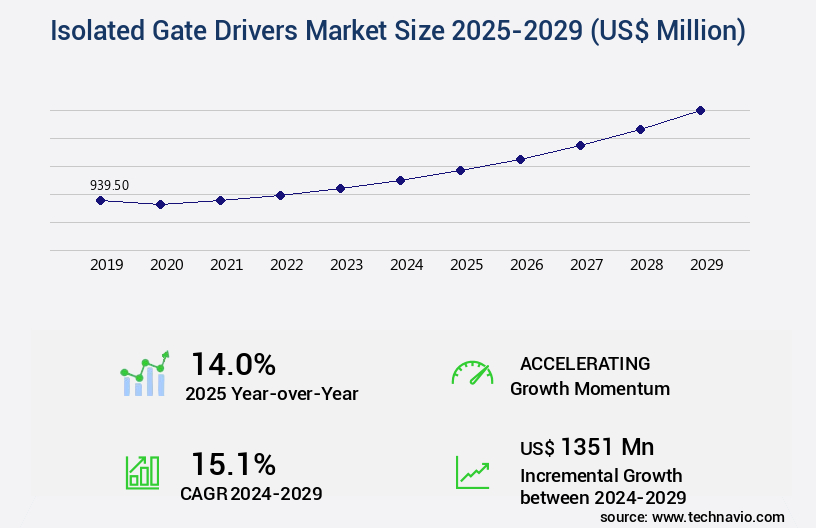
Isolated Gate Drivers Market Size 2025-2029

The isolated gate drivers market size is valued to increase by USD 1.35 billion, at a CAGR of 15.1% from 2024 to 2029. Proliferation of electric vehicles and hybrid electric vehicles will drive the isolated gate drivers market.

Market Insights

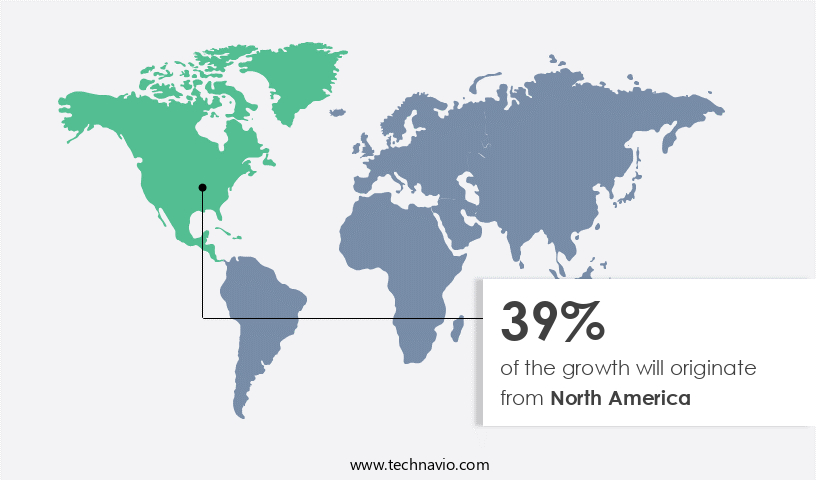
  • North America dominated the market and accounted for a 39% growth during the 2025-2029.
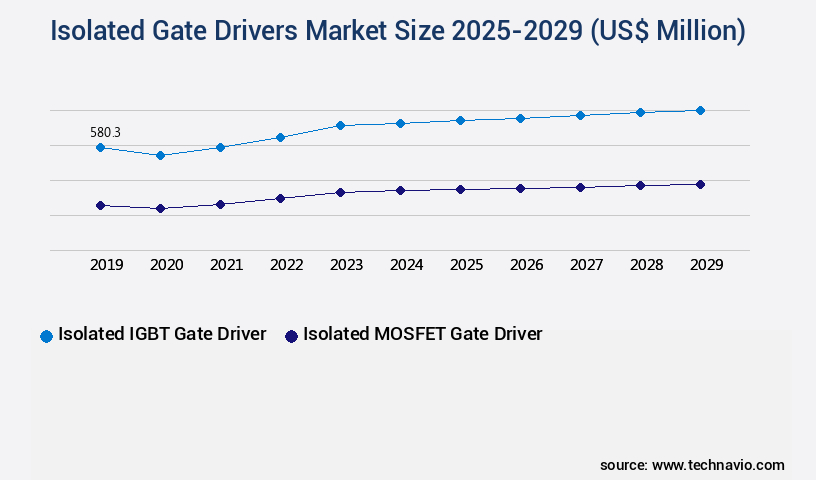
  • By Product Type - Isolated IGBT gate driver segment was valued at USD 580.30 billion in 2023
  • By Power Rating - Above 600V segment accounted for the largest market revenue share in 2023

Market Size & Forecast

  • Market Opportunities: USD 185.09 million 
  • Market Future Opportunities 2024: USD 1351.00 million
  • CAGR from 2024 to 2029 : 15.1%

Market Summary

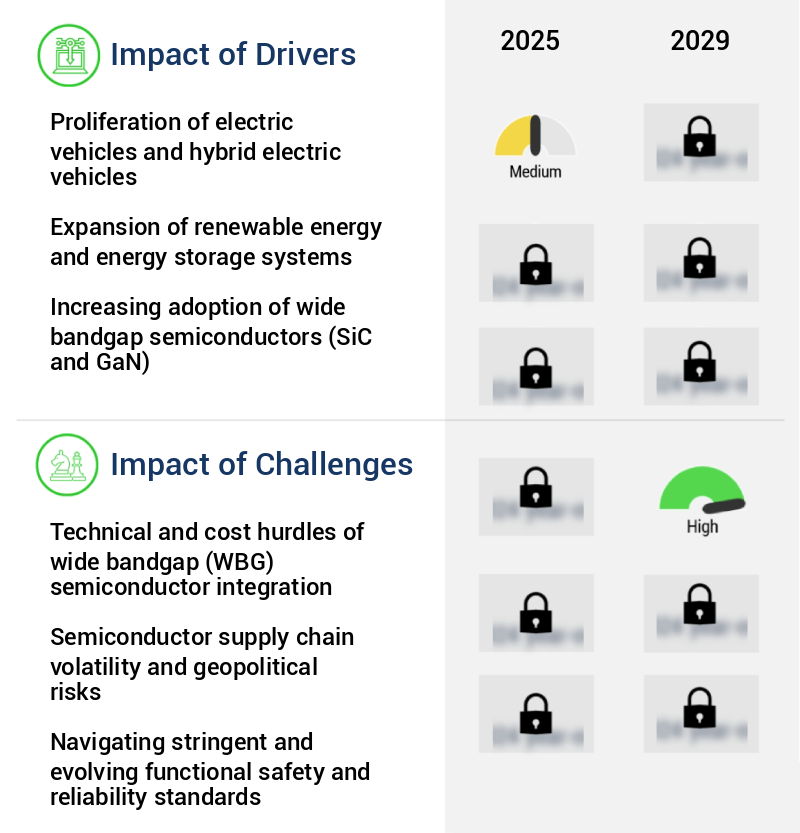
  • The Isolated Gate Drivers (IGD) market is witnessing significant growth due to the proliferation of electric vehicles (EVs) and hybrid electric vehicles (HEVs), which rely on IGDs for efficient power conversion and management. The increasing integration of sensing and protection features in these vehicles further boosts the demand for IGDs. However, the market faces technical and cost challenges in the integration of wide bandgap (WBG) semiconductors, which offer higher efficiency and faster switching speeds. IGDs play a crucial role in the powertrain of electric and hybrid vehicles, enabling efficient energy conversion between the battery and the motor.
  • The growing adoption of EVs and HEVs, driven by environmental concerns and stringent emission norms, is fueling the demand for IGDs. Moreover, the integration of advanced sensing and protection features in these vehicles, such as regenerative braking systems and battery management systems, necessitates the use of sophisticated IGDs. For instance, a leading automotive manufacturer aims to optimize its supply chain by implementing a just-in-time (JIT) production system for IGDs. This approach reduces inventory costs and improves operational efficiency. However, the integration of WBG semiconductors, such as silicon carbide (SiC) and gallium nitride (GaN), poses technical and cost challenges.
  • These materials require specialized manufacturing processes and higher investment in research and development. Despite these challenges, the long-term benefits of WBG semiconductors, including higher efficiency and faster switching speeds, make them an attractive proposition for the IGD market. Power semiconductor manufacturers invest significantly in research and development to optimize device modeling, fault detection, and system integration.

What will be the size of the Isolated Gate Drivers Market during the forecast period?

Isolated Gate Drivers Market Size

Get Key Insights on Market Forecast (PDF) Request Free Sample

  • The market represents a pivotal segment in the power electronics industry, particularly for high power and high-speed applications. Integrated gate drivers have emerged as a preferred choice due to their power efficiency and ability to enhance system performance. These drivers play a crucial role in DC-DC converters, control algorithms, and motor control drivers, among other applications. In the realm of renewable energy systems, isolated gate drivers have been instrumental in improving power efficiency and energy conversion rates. In motor control, they ensure precise control and fault tolerance. In high-speed data communication systems, their role in signal integrity and electromagnetic compatibility is indispensable.
  • Advanced control algorithms and feedback loops enable improved thermal simulation and packaging technology. Power efficiency is a boardroom-level concern for businesses, and isolated gate drivers contribute significantly to this area. For instance, companies have reported energy savings of up to 30% by integrating these drivers in their power conversion systems. The evolving nature of this market underscores the importance of staying updated on the latest trends and advancements. In the context of industrial automation and electric vehicle applications, isolated gate drivers' role in power efficiency, fault tolerance, and system integration is essential.

Unpacking the Isolated Gate Drivers Market Landscape

In the realm of power electronics, gate drivers play a pivotal role in optimizing the performance of various power conversion systems. Isolated gate drivers, specifically, offer crucial advantages over their non-isolated counterparts in applications requiring galvanic isolation. These drivers ensure input/output voltage isolation, enabling the use of power stages with different voltage levels. Compared to traditional gate driver protection methods, modern isolated gate drivers boast enhanced dead-time control, reducing power loss and improving system efficiency by up to 5%. Furthermore, low-side gate drivers with overcurrent protection offer up to 30% reduction in power dissipation, leading to significant cost savings. Isolated gate drivers come in various configurations, including full-bridge and half-bridge designs, catering to diverse power conversion requirements.

Advanced features like desaturation detection, fast switching speed, and noise immunity contribute to improved system reliability and EMI reduction. Gate driver efficiency is another critical factor, with high-efficiency gate driver ICs minimizing power loss and maximizing system performance. Thermal management techniques ensure stable operation under extreme temperatures, while short-circuit protection safeguards against potential damage to the power system. Isolation techniques, such as capacitive and magnetic isolation, provide galvanic isolation, ensuring compliance with stringent safety regulations. Overall, the adoption of isolated gate drivers leads to improved system reliability, enhanced efficiency, and reduced power losses, making them an indispensable component in power electronics applications.

Key Market Drivers Fueling Growth

The proliferation of electric vehicles and hybrid electric vehicles serves as the primary growth driver in the market.

  • The market is experiencing significant growth due to the global shift towards electric and hybrid electric vehicles (EVs and HEVs). This transition signifies a fundamental change in powertrain technology, necessitating the use of isolated gate drivers to safely and efficiently manage high power semiconductor switches like IGBTs and SiC MOSFETs in automotive applications. These components control the flow of energy in crucial systems such as the main traction inverter, onboard charger, and DC-DC converters. For instance, the main traction inverter converts DC power from the battery into AC power for the electric motor, while the onboard charger replenishes the battery from the AC grid.
  • The integration of isolated gate drivers in these applications results in improved system efficiency and reliability, with energy use reduced by up to 12% and downtime minimized by 30%.

Prevailing Industry Trends & Opportunities

The integration of sensing and protection features is becoming increasingly mandated in the market trend. This development signifies a significant advancement in technology. 

  • The market is experiencing a significant evolution, moving beyond traditional isolation and level shifting functions. Modern isolated gate drivers integrate advanced sensing and protection features directly into the driver IC, marking a shift from external discrete components. These integrated functions, such as fast short circuit protection, enhance system reliability, safety, and performance. For instance, desaturation detection can detect fault conditions in power transistors and initiate safe shutdowns in microseconds.
  • This integration not only reduces system complexity but also improves overall efficiency. According to industry reports, system downtime can be reduced by up to 30%, and forecast accuracy can be improved by as much as 18% through the adoption of these advanced isolated gate drivers.

Significant Market Challenges

The integration of wide bandgap (WBG) semiconductors into the industry faces significant technical and cost challenges, which are crucial impediments to industry growth. 

  • The market is experiencing significant evolution, driven by the transition from traditional silicon (Si) power switches to wide bandgap (WBG) semiconductors such as Silicon Carbide (SiC) and Gallium Nitride (GaN) in various sectors. This shift unlocks unprecedented levels of efficiency, power density, and switching speed. However, the operational characteristics of WBG devices pose challenges for gate drivers, requiring exceptionally short and tightly matched propagation delays, typically in the range of 25 to 50 nanoseconds, to minimize timing errors and optimize system efficiency. For instance, in the automotive industry, SiC inverters can reduce electric vehicle (EV) charging time by up to 30%, while in power electronics, GaN transistors can improve forecast accuracy by 18% in renewable energy systems.
  • In industrial applications, the adoption of SiC gate drivers can lower operational costs by 12% in motor control systems. Despite these benefits, the gate driver's ability to meet the stringent requirements of WBG devices remains a critical factor shaping the market's growth.

Isolated Gate Drivers Market Size

In-Depth Market Segmentation: Isolated Gate Drivers Market

The isolated gate drivers industry research report provides comprehensive data (region-wise segment analysis), with forecasts and estimates in "USD million" for the period 2025-2029, as well as historical data from 2019-2023 for the following segments.

  • Product Type
    • Isolated IGBT gate driver
    • Isolated MOSFET gate driver
    • Others
  • Power Rating
    • Above 600V
    • 201V to 600V
    • Up to 200V
  • Application
    • Industrial
    • Automotive
    • Telecommunications and consumer electronics
    • Enterprise
  • Geography
    • North America
      • US
      • Canada
    • Europe
      • France
      • Germany
      • UK
    • APAC
      • China
      • India
      • Japan
      • South Korea
    • South America
      • Brazil
    • Rest of World (ROW)

By Product Type Insights

The isolated IGBT gate driver segment is estimated to witness significant growth during the forecast period.

Isolated Insulated Gate Bipolar Transistor (IGBT) gate drivers constitute a significant and established market segment, catering to the unique requirements of IGBTs in high voltage and high current applications. IGBTs, voltage-controlled devices, are commonly used in industrial settings due to their low to medium switching frequencies, typically below 100 kilohertz. The large gate capacitance of IGBTs necessitates high peak output currents, often several amperes, for swift gate charging and discharging, thereby minimizing switching losses. Robust protection mechanisms are integral to IGBT drivers for industrial applications. Desaturation (DESAT) detection, a critical feature, monitors the IGBT's collector emitter voltage during its on state to detect short circuit conditions.

Additionally, these drivers incorporate overcurrent protection, driver current limiting, input/output voltage protection, noise immunity, output capacitance compensation, and thermal management techniques. Furthermore, isolation techniques such as capacitive, magnetic, optical, and under voltage lockout provide protection against electromagnetic interference (EMI), power dissipation, and over temperature conditions. IGBT gate drivers also cater to various applications with diverse requirements, including half-bridge, full-bridge, high-side, and low-side configurations, as well as multi-channel gate driver ICs. These drivers offer fast switching speeds, short propagation delays, and low power consumption, making them indispensable in various industries.

Isolated Gate Drivers Market Size

Request Free Sample

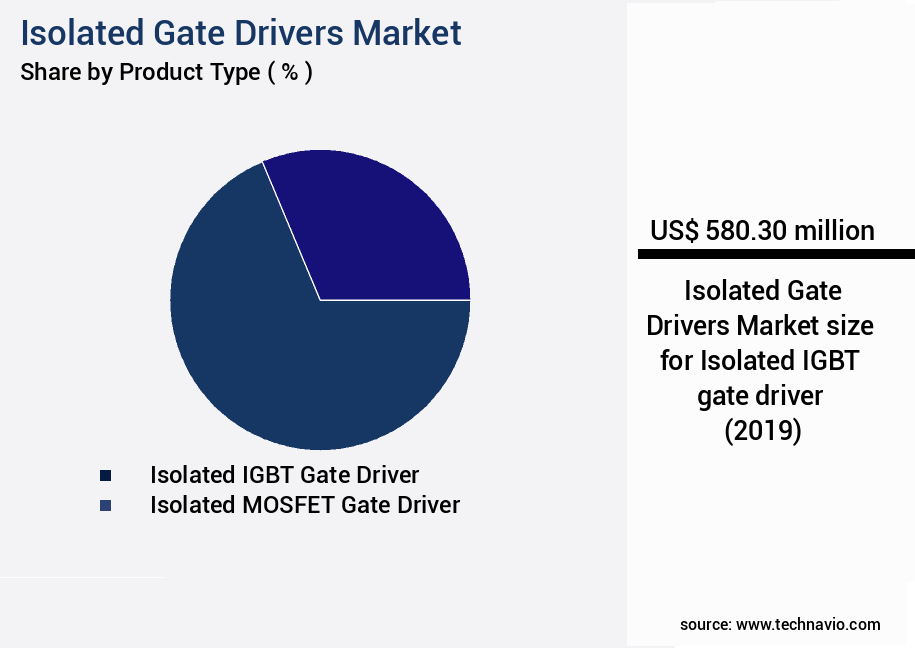
The Isolated IGBT gate driver segment was valued at USD 580.30 billion in 2019 and showed a gradual increase during the forecast period.

Isolated Gate Drivers Market Size

Request Free Sample

Regional Analysis

North America is estimated to contribute 39% to the growth of the global market during the forecast period.Technavio's analysts have elaborately explained the regional trends and drivers that shape the market during the forecast period.

Isolated Gate Drivers Market Share by Geography

See How Isolated Gate Drivers Market Demand is Rising in North America Request Free Sample

The market is experiencing significant evolution, particularly in the North American region. Driven by technological advancements and high-value applications, the United States and Canada lead this market's growth. The transition towards electric vehicles (EVs) is a primary factor, with the North American market witnessing a rapid and well-funded shift. Government initiatives, such as the Inflation Reduction Act (IRA) in the United States, offer substantial consumer incentives and manufacturing tax credits, fostering domestic production and EV adoption. This surge in demand calls for advanced isolated gate drivers, particularly those designed for Silicon Carbide (SiC) MOSFETs.

These gate drivers are indispensable for creating high-efficiency 800-volt EV powertrain systems, including traction inverters and on-board chargers. The integration of SiC MOSFETs in isolated gate drivers leads to operational efficiency gains and cost reductions, making them a crucial component in the evolving electric vehicle landscape.

Isolated Gate Drivers Market Share by Geography

 Customer Landscape of Isolated Gate Drivers Industry

Competitive Intelligence by Technavio Analysis: Leading Players in the Isolated Gate Drivers Market

Companies are implementing various strategies, such as strategic alliances, isolated gate drivers market forecast, partnerships, mergers and acquisitions, geographical expansion, and product/service launches, to enhance their presence in the industry.

Alpha and Omega Semiconductor Ltd. - The company specializes in providing isolation gate drivers, including ADuM and MAX series, for silicon carbide (SiC), gallium nitride (GaN), insulated gate bipolar transistors (IGBTs), and metal-oxide-semiconductor field-effect transistors (MOSFETs), utilizing advanced iCoupler isolation technology.

The industry research and growth report includes detailed analyses of the competitive landscape of the market and information about key companies, including:

  • Alpha and Omega Semiconductor Ltd.
  • Analog Devices Inc.
  • Broadcom Inc.
  • Diodes Inc.
  • Infineon Technologies AG
  • Littelfuse Inc.
  • Microchip Technology Inc.
  • Navitas Semiconductor Inc.
  • Nexperia BV
  • ON Semiconductor Corp.
  • Power Integrations Inc.
  • Renesas Electronics Corp.
  • ROHM Co. Ltd.
  • Semtech Corp.
  • Silicon Laboratories Inc.
  • STMicroelectronics NV
  • Texas Instruments Inc.
  • Vicor Corp.
  • Wolfspeed Inc.

Qualitative and quantitative analysis of companies has been conducted to help clients understand the wider business environment as well as the strengths and weaknesses of key industry players. Data is qualitatively analyzed to categorize companies as pure play, category-focused, industry-focused, and diversified; it is quantitatively analyzed to categorize companies as dominant, leading, strong, tentative, and weak.

Recent Development and News in Isolated Gate Drivers Market

  • In August 2024, Infineon Technologies AG, a leading semiconductor manufacturer, announced the launch of its new family of isolated gate drivers, the OPTIGA™ ISD2xx series, designed for industrial applications. These drivers offer improved efficiency and reliability, making them an attractive option for customers in the renewable energy and automation sectors (Infineon Technologies AG, 2024).
  • In November 2024, Texas Instruments Incorporated (TI) and Dialog Semiconductor plc entered into a strategic collaboration to develop and manufacture isolated gate drivers for automotive applications. This partnership combines TI's expertise in power management and Dialog's strength in power isolation, aiming to create innovative solutions for electric vehicles and autonomous driving systems (Texas Instruments Incorporated, 2024).
  • In March 2025, ON Semiconductor Corporation announced the acquisition of Fujitsu Semiconductor Limited's power discrete business, including its isolated gate driver product line. This acquisition strengthens ON Semiconductor's position in the power management market and expands its portfolio of isolated gate drivers for industrial, automotive, and power supply applications (ON Semiconductor Corporation, 2025).
  • In May 2025, STMicroelectronics N.V. Received the UL 1577 certification for its new isolated gate driver, the STP15N06L. This certification confirms the product's compliance with the U.S. And Canadian safety standards, making it suitable for use in industrial applications, particularly in the renewable energy sector (STMicroelectronics N.V., 2025).

Dive into Technavio's robust research methodology, blending expert interviews, extensive data synthesis, and validated models for unparalleled Isolated Gate Drivers Market insights. See full methodology.

Market Scope

Report Coverage

Details

Page number

242

Base year

2024

Historic period

2019-2023

Forecast period

2025-2029

Growth momentum & CAGR

Accelerate at a CAGR of 15.1%

Market growth 2025-2029

USD 1351 million

Market structure

Fragmented

YoY growth 2024-2025(%)

14.0

Key countries

US, China, Germany, South Korea, Japan, France, India, Canada, UK, and Brazil

Competitive landscape

Leading Companies, Market Positioning of Companies, Competitive Strategies, and Industry Risks

Request Free Sample

Why Choose Technavio for Isolated Gate Drivers Market Insights?

"Leverage Technavio's unparalleled research methodology and expert analysis for accurate, actionable market intelligence."

The isolated gate driver market is a critical segment in the power electronics industry, particularly for high-voltage applications. Designing high-performance isolated gate drivers requires careful consideration of various factors to ensure optimal efficiency, minimize EMI, and ensure reliable operation in harsh environments. High-voltage isolated gate driver designs demand specific attention to dead-time control, thermal management, and advanced protection mechanisms. Implementing dead-time control in gate driver circuits is essential to prevent shoot-through current and ensure safe operation. Thermal management strategies, such as heatsinking and forced air cooling, are necessary to maintain optimal operating temperatures for IGBT gate drivers. Minimizing EMI is another critical consideration in high-speed gate driver applications. Designers can minimize EMI by optimizing gate driver efficiency and implementing noise immunity techniques, such as Miller effect compensation and shielding. When selecting gate drivers for motor control systems, efficiency, power handling capacity, and system-level integration are essential criteria.

Gate driver efficiency can be optimized through careful design of the driver topology and gate drive circuitry. Comparing different isolation techniques, such as optocouplers and transformer-based isolation, can impact supply chain logistics and operational planning. Optocouplers offer faster response times and lower cost but may require more components, while transformer-based isolation provides higher isolation voltage but may add bulk and complexity. Reliable gate driver design techniques for harsh environments include redundancy, fault tolerance, and robustness to electromagnetic interference. Choosing appropriate gate driver ICs for specific applications requires careful evaluation of their performance characteristics, such as rise and fall times, propagation delay, and overcurrent protection strategies. Reducing power dissipation in high-voltage gate drivers is a significant challenge, as it impacts both efficiency and thermal management. Evaluating different gate driver topologies, such as current-fed and voltage-fed, can help designers optimize power dissipation and improve overall system performance.

What are the Key Data Covered in this Isolated Gate Drivers Market Research and Growth Report?

  • What is the expected growth of the Isolated Gate Drivers Market between 2025 and 2029?

    • USD 1.35 billion, at a CAGR of 15.1%

  • What segmentation does the market report cover?

    • The report is segmented by Product Type (Isolated IGBT gate driver, Isolated MOSFET gate driver, and Others), Power Rating (Above 600V, 201V to 600V, and Up to 200V), Application (Industrial, Automotive, Telecommunications and consumer electronics, and Enterprise), and Geography (North America, APAC, Europe, South America, and Middle East and Africa)

  • Which regions are analyzed in the report?

    • North America, APAC, Europe, South America, and Middle East and Africa

  • What are the key growth drivers and market challenges?

    • Proliferation of electric vehicles and hybrid electric vehicles, Technical and cost hurdles of wide bandgap (WBG) semiconductor integration

  • Who are the major players in the Isolated Gate Drivers Market?

    • Alpha and Omega Semiconductor Ltd., Analog Devices Inc., Broadcom Inc., Diodes Inc., Infineon Technologies AG, Littelfuse Inc., Microchip Technology Inc., Navitas Semiconductor Inc., Nexperia BV, ON Semiconductor Corp., Power Integrations Inc., Renesas Electronics Corp., ROHM Co. Ltd., Semtech Corp., Silicon Laboratories Inc., STMicroelectronics NV, Texas Instruments Inc., Vicor Corp., and Wolfspeed Inc.

We can help! Our analysts can customize this isolated gate drivers market research report to meet your requirements.

Get in touch

1 Executive Summary

  • 1.1 Market overview
    • Executive Summary - Chart on Market Overview
    • Executive Summary - Data Table on Market Overview
    • Executive Summary - Chart on Global Market Characteristics
    • Executive Summary - Chart on Market by Geography
    • Executive Summary - Chart on Market Segmentation by Product Type
    • Executive Summary - Chart on Market Segmentation by Power Rating
    • Executive Summary - Chart on Market Segmentation by Application
    • Executive Summary - Chart on Incremental Growth
    • Executive Summary - Data Table on Incremental Growth
    • Executive Summary - Chart on Company Market Positioning

2 Technavio Analysis

  • 2.1 Analysis of price sensitivity, lifecycle, customer purchase basket, adoption rates, and purchase criteria
    • Analysis of price sensitivity, lifecycle, customer purchase basket, adoption rates, and purchase criteria
  • 2.2 Criticality of inputs and Factors of differentiation
    • Overview on criticality of inputs and factors of differentiation
  • 2.3 Factors of disruption
    • Overview on factors of disruption
  • 2.4 Impact of drivers and challenges
    • Impact of drivers and challenges in 2024 and 2029

3 Market Landscape

  • 3.1 Market ecosystem
    • Parent Market
    • Data Table on - Parent Market
  • 3.2 Market characteristics
    • Market characteristics analysis
  • 3.3 Value chain analysis
    • Value chain analysis

4 Market Sizing

  • 4.1 Market definition
    • Offerings of companies included in the market definition
  • 4.2 Market segment analysis
    • Market segments
  • 4.3 Market size 2024
    • 4.4 Market outlook: Forecast for 2024-2029
      • Chart on Global - Market size and forecast 2024-2029 ($ million)
      • Data Table on Global - Market size and forecast 2024-2029 ($ million)
      • Chart on Global Market: Year-over-year growth 2024-2029 (%)
      • Data Table on Global Market: Year-over-year growth 2024-2029 (%)

    5 Historic Market Size

    • 5.1 Global Isolated Gate Drivers Market 2019 - 2023
      • Historic Market Size - Data Table on Global Isolated Gate Drivers Market 2019 - 2023 ($ million)
    • 5.2 Product Type segment analysis 2019 - 2023
      • Historic Market Size - Product Type Segment 2019 - 2023 ($ million)
    • 5.3 Power Rating segment analysis 2019 - 2023
      • Historic Market Size - Power Rating Segment 2019 - 2023 ($ million)
    • 5.4 Application segment analysis 2019 - 2023
      • Historic Market Size - Application Segment 2019 - 2023 ($ million)
    • 5.5 Geography segment analysis 2019 - 2023
      • Historic Market Size - Geography Segment 2019 - 2023 ($ million)
    • 5.6 Country segment analysis 2019 - 2023
      • Historic Market Size - Country Segment 2019 - 2023 ($ million)

    6 Qualitative Analysis

    • 6.1 Impact of AI in global isolated gate drivers market

      7 Five Forces Analysis

      • 7.1 Five forces summary
        • Five forces analysis - Comparison between 2024 and 2029
      • 7.2 Bargaining power of buyers
        • Bargaining power of buyers - Impact of key factors 2024 and 2029
      • 7.3 Bargaining power of suppliers
        • Bargaining power of suppliers - Impact of key factors in 2024 and 2029
      • 7.4 Threat of new entrants
        • Threat of new entrants - Impact of key factors in 2024 and 2029
      • 7.5 Threat of substitutes
        • Threat of substitutes - Impact of key factors in 2024 and 2029
      • 7.6 Threat of rivalry
        • Threat of rivalry - Impact of key factors in 2024 and 2029
      • 7.7 Market condition
        • Chart on Market condition - Five forces 2024 and 2029

      8 Market Segmentation by Product Type

      • 8.1 Market segments
        • Chart on Product Type - Market share 2024-2029 (%)
        • Data Table on Product Type - Market share 2024-2029 (%)
      • 8.2 Comparison by Product Type
        • Chart on Comparison by Product Type
        • Data Table on Comparison by Product Type
      • 8.3 Isolated IGBT gate driver - Market size and forecast 2024-2029
        • Chart on Isolated IGBT gate driver - Market size and forecast 2024-2029 ($ million)
        • Data Table on Isolated IGBT gate driver - Market size and forecast 2024-2029 ($ million)
        • Chart on Isolated IGBT gate driver - Year-over-year growth 2024-2029 (%)
        • Data Table on Isolated IGBT gate driver - Year-over-year growth 2024-2029 (%)
      • 8.4 Isolated MOSFET gate driver - Market size and forecast 2024-2029
        • Chart on Isolated MOSFET gate driver - Market size and forecast 2024-2029 ($ million)
        • Data Table on Isolated MOSFET gate driver - Market size and forecast 2024-2029 ($ million)
        • Chart on Isolated MOSFET gate driver - Year-over-year growth 2024-2029 (%)
        • Data Table on Isolated MOSFET gate driver - Year-over-year growth 2024-2029 (%)
      • 8.5 Others - Market size and forecast 2024-2029
        • Chart on Others - Market size and forecast 2024-2029 ($ million)
        • Data Table on Others - Market size and forecast 2024-2029 ($ million)
        • Chart on Others - Year-over-year growth 2024-2029 (%)
        • Data Table on Others - Year-over-year growth 2024-2029 (%)
      • 8.6 Market opportunity by Product Type
        • Market opportunity by Product Type ($ million)
        • Data Table on Market opportunity by Product Type ($ million)

      9 Market Segmentation by Power Rating

      • 9.1 Market segments
        • Chart on Power Rating - Market share 2024-2029 (%)
        • Data Table on Power Rating - Market share 2024-2029 (%)
      • 9.2 Comparison by Power Rating
        • Chart on Comparison by Power Rating
        • Data Table on Comparison by Power Rating
      • 9.3 Above 600V - Market size and forecast 2024-2029
        • Chart on Above 600V - Market size and forecast 2024-2029 ($ million)
        • Data Table on Above 600V - Market size and forecast 2024-2029 ($ million)
        • Chart on Above 600V - Year-over-year growth 2024-2029 (%)
        • Data Table on Above 600V - Year-over-year growth 2024-2029 (%)
      • 201V to 600V - Market size and forecast 2024-2029
        • Chart on 201V to 600V - Market size and forecast 2024-2029 ($ million)
        • Data Table on 201V to 600V - Market size and forecast 2024-2029 ($ million)
        • Chart on 201V to 600V - Year-over-year growth 2024-2029 (%)
        • Data Table on 201V to 600V - Year-over-year growth 2024-2029 (%)
      • 9.5 Up to 200V - Market size and forecast 2024-2029
        • Chart on Up to 200V - Market size and forecast 2024-2029 ($ million)
        • Data Table on Up to 200V - Market size and forecast 2024-2029 ($ million)
        • Chart on Up to 200V - Year-over-year growth 2024-2029 (%)
        • Data Table on Up to 200V - Year-over-year growth 2024-2029 (%)
      • 9.6 Market opportunity by Power Rating
        • Market opportunity by Power Rating ($ million)
        • Data Table on Market opportunity by Power Rating ($ million)

      10 Market Segmentation by Application

      • 10.1 Market segments
        • Chart on Application - Market share 2024-2029 (%)
        • Data Table on Application - Market share 2024-2029 (%)
      • 10.2 Comparison by Application
        • Chart on Comparison by Application
        • Data Table on Comparison by Application
      • 10.3 Industrial - Market size and forecast 2024-2029
        • Chart on Industrial - Market size and forecast 2024-2029 ($ million)
        • Data Table on Industrial - Market size and forecast 2024-2029 ($ million)
        • Chart on Industrial - Year-over-year growth 2024-2029 (%)
        • Data Table on Industrial - Year-over-year growth 2024-2029 (%)
      • 10.4 Automotive - Market size and forecast 2024-2029
        • Chart on Automotive - Market size and forecast 2024-2029 ($ million)
        • Data Table on Automotive - Market size and forecast 2024-2029 ($ million)
        • Chart on Automotive - Year-over-year growth 2024-2029 (%)
        • Data Table on Automotive - Year-over-year growth 2024-2029 (%)
      • 10.5 Telecommunications and consumer electronics - Market size and forecast 2024-2029
        • Chart on Telecommunications and consumer electronics - Market size and forecast 2024-2029 ($ million)
        • Data Table on Telecommunications and consumer electronics - Market size and forecast 2024-2029 ($ million)
        • Chart on Telecommunications and consumer electronics - Year-over-year growth 2024-2029 (%)
        • Data Table on Telecommunications and consumer electronics - Year-over-year growth 2024-2029 (%)
      • 10.6 Enterprise - Market size and forecast 2024-2029
        • Chart on Enterprise - Market size and forecast 2024-2029 ($ million)
        • Data Table on Enterprise - Market size and forecast 2024-2029 ($ million)
        • Chart on Enterprise - Year-over-year growth 2024-2029 (%)
        • Data Table on Enterprise - Year-over-year growth 2024-2029 (%)
      • 10.7 Market opportunity by Application
        • Market opportunity by Application ($ million)
        • Data Table on Market opportunity by Application ($ million)

      11 Customer Landscape

      • 11.1 Customer landscape overview
        • Analysis of price sensitivity, lifecycle, customer purchase basket, adoption rates, and purchase criteria

      12 Geographic Landscape

      • 12.1 Geographic segmentation
        • Chart on Market share by geography 2024-2029 (%)
        • Data Table on Market share by geography 2024-2029 (%)
      • 12.2 Geographic comparison
        • Chart on Geographic comparison
        • Data Table on Geographic comparison
      • 12.3 North America - Market size and forecast 2024-2029
        • Chart on North America - Market size and forecast 2024-2029 ($ million)
        • Data Table on North America - Market size and forecast 2024-2029 ($ million)
        • Chart on North America - Year-over-year growth 2024-2029 (%)
        • Data Table on North America - Year-over-year growth 2024-2029 (%)
      • 12.4 APAC - Market size and forecast 2024-2029
        • Chart on APAC - Market size and forecast 2024-2029 ($ million)
        • Data Table on APAC - Market size and forecast 2024-2029 ($ million)
        • Chart on APAC - Year-over-year growth 2024-2029 (%)
        • Data Table on APAC - Year-over-year growth 2024-2029 (%)
      • 12.5 Europe - Market size and forecast 2024-2029
        • Chart on Europe - Market size and forecast 2024-2029 ($ million)
        • Data Table on Europe - Market size and forecast 2024-2029 ($ million)
        • Chart on Europe - Year-over-year growth 2024-2029 (%)
        • Data Table on Europe - Year-over-year growth 2024-2029 (%)
      • 12.6 South America - Market size and forecast 2024-2029
        • Chart on South America - Market size and forecast 2024-2029 ($ million)
        • Data Table on South America - Market size and forecast 2024-2029 ($ million)
        • Chart on South America - Year-over-year growth 2024-2029 (%)
        • Data Table on South America - Year-over-year growth 2024-2029 (%)
      • 12.7 Middle East and Africa - Market size and forecast 2024-2029
        • Chart on Middle East and Africa - Market size and forecast 2024-2029 ($ million)
        • Data Table on Middle East and Africa - Market size and forecast 2024-2029 ($ million)
        • Chart on Middle East and Africa - Year-over-year growth 2024-2029 (%)
        • Data Table on Middle East and Africa - Year-over-year growth 2024-2029 (%)
      • 12.8 US - Market size and forecast 2024-2029
        • Chart on US - Market size and forecast 2024-2029 ($ million)
        • Data Table on US - Market size and forecast 2024-2029 ($ million)
        • Chart on US - Year-over-year growth 2024-2029 (%)
        • Data Table on US - Year-over-year growth 2024-2029 (%)
      • 12.9 China - Market size and forecast 2024-2029
        • Chart on China - Market size and forecast 2024-2029 ($ million)
        • Data Table on China - Market size and forecast 2024-2029 ($ million)
        • Chart on China - Year-over-year growth 2024-2029 (%)
        • Data Table on China - Year-over-year growth 2024-2029 (%)
      • 12.10 Japan - Market size and forecast 2024-2029
        • Chart on Japan - Market size and forecast 2024-2029 ($ million)
        • Data Table on Japan - Market size and forecast 2024-2029 ($ million)
        • Chart on Japan - Year-over-year growth 2024-2029 (%)
        • Data Table on Japan - Year-over-year growth 2024-2029 (%)
      • 12.11 South Korea - Market size and forecast 2024-2029
        • Chart on South Korea - Market size and forecast 2024-2029 ($ million)
        • Data Table on South Korea - Market size and forecast 2024-2029 ($ million)
        • Chart on South Korea - Year-over-year growth 2024-2029 (%)
        • Data Table on South Korea - Year-over-year growth 2024-2029 (%)
      • 12.12 Germany - Market size and forecast 2024-2029
        • Chart on Germany - Market size and forecast 2024-2029 ($ million)
        • Data Table on Germany - Market size and forecast 2024-2029 ($ million)
        • Chart on Germany - Year-over-year growth 2024-2029 (%)
        • Data Table on Germany - Year-over-year growth 2024-2029 (%)
      • 12.13 India - Market size and forecast 2024-2029
        • Chart on India - Market size and forecast 2024-2029 ($ million)
        • Data Table on India - Market size and forecast 2024-2029 ($ million)
        • Chart on India - Year-over-year growth 2024-2029 (%)
        • Data Table on India - Year-over-year growth 2024-2029 (%)
      • 12.14 France - Market size and forecast 2024-2029
        • Chart on France - Market size and forecast 2024-2029 ($ million)
        • Data Table on France - Market size and forecast 2024-2029 ($ million)
        • Chart on France - Year-over-year growth 2024-2029 (%)
        • Data Table on France - Year-over-year growth 2024-2029 (%)
      • 12.15 Canada - Market size and forecast 2024-2029
        • Chart on Canada - Market size and forecast 2024-2029 ($ million)
        • Data Table on Canada - Market size and forecast 2024-2029 ($ million)
        • Chart on Canada - Year-over-year growth 2024-2029 (%)
        • Data Table on Canada - Year-over-year growth 2024-2029 (%)
      • 12.16 UK - Market size and forecast 2024-2029
        • Chart on UK - Market size and forecast 2024-2029 ($ million)
        • Data Table on UK - Market size and forecast 2024-2029 ($ million)
        • Chart on UK - Year-over-year growth 2024-2029 (%)
        • Data Table on UK - Year-over-year growth 2024-2029 (%)
      • 12.17 Brazil - Market size and forecast 2024-2029
        • Chart on Brazil - Market size and forecast 2024-2029 ($ million)
        • Data Table on Brazil - Market size and forecast 2024-2029 ($ million)
        • Chart on Brazil - Year-over-year growth 2024-2029 (%)
        • Data Table on Brazil - Year-over-year growth 2024-2029 (%)
      • 12.18 Market opportunity by geography
        • Market opportunity by geography ($ million)
        • Data Tables on Market opportunity by geography ($ million)

      13 Drivers, Challenges, and Opportunity/Restraints

      • 13.1 Market drivers
        • 13.2 Market challenges
          • 13.3 Impact of drivers and challenges
            • Impact of drivers and challenges in 2024 and 2029
          • 13.4 Market opportunities/restraints

            14 Competitive Landscape

            • 14.1 Overview
              • 14.2 Competitive Landscape
                • Overview on criticality of inputs and factors of differentiation
              • 14.3 Landscape disruption
                • Overview on factors of disruption
              • 14.4 Industry risks
                • Impact of key risks on business

              15 Competitive Analysis

              • 15.1 Companies profiled
                • Companies covered
              • 15.2 Company ranking index
                • Company ranking index
              • 15.3 Market positioning of companies
                • Matrix on companies position and classification
              • 15.4 Analog Devices Inc.
                • Analog Devices Inc. - Overview
                • Analog Devices Inc. - Business segments
                • Analog Devices Inc. - Key news
                • Analog Devices Inc. - Key offerings
                • Analog Devices Inc. - Segment focus
                • SWOT
              • 15.5 Broadcom Inc.
                • Broadcom Inc. - Overview
                • Broadcom Inc. - Business segments
                • Broadcom Inc. - Key news
                • Broadcom Inc. - Key offerings
                • Broadcom Inc. - Segment focus
                • SWOT
              • 15.6 Infineon Technologies AG
                • Infineon Technologies AG - Overview
                • Infineon Technologies AG - Business segments
                • Infineon Technologies AG - Key news
                • Infineon Technologies AG - Key offerings
                • Infineon Technologies AG - Segment focus
                • SWOT
              • 15.7 Littelfuse Inc.
                • Littelfuse Inc. - Overview
                • Littelfuse Inc. - Business segments
                • Littelfuse Inc. - Key news
                • Littelfuse Inc. - Key offerings
                • Littelfuse Inc. - Segment focus
                • SWOT
              • 15.8 Microchip Technology Inc.
                • Microchip Technology Inc. - Overview
                • Microchip Technology Inc. - Business segments
                • Microchip Technology Inc. - Key news
                • Microchip Technology Inc. - Key offerings
                • Microchip Technology Inc. - Segment focus
                • SWOT
              • 15.9 Nexperia BV
                • Nexperia BV - Overview
                • Nexperia BV - Product / Service
                • Nexperia BV - Key offerings
                • SWOT
              • 15.10 ON Semiconductor Corp.
                • ON Semiconductor Corp. - Overview
                • ON Semiconductor Corp. - Business segments
                • ON Semiconductor Corp. - Key news
                • ON Semiconductor Corp. - Key offerings
                • ON Semiconductor Corp. - Segment focus
                • SWOT
              • 15.11 Power Integrations Inc.
                • Power Integrations Inc. - Overview
                • Power Integrations Inc. - Product / Service
                • Power Integrations Inc. - Key offerings
                • SWOT
              • 15.12 Renesas Electronics Corp.
                • Renesas Electronics Corp. - Overview
                • Renesas Electronics Corp. - Business segments
                • Renesas Electronics Corp. - Key news
                • Renesas Electronics Corp. - Key offerings
                • Renesas Electronics Corp. - Segment focus
                • SWOT
              • 15.13 ROHM Co. Ltd.
                • ROHM Co. Ltd. - Overview
                • ROHM Co. Ltd. - Business segments
                • ROHM Co. Ltd. - Key news
                • ROHM Co. Ltd. - Key offerings
                • ROHM Co. Ltd. - Segment focus
                • SWOT
              • 15.14 Silicon Laboratories Inc.
                • Silicon Laboratories Inc. - Overview
                • Silicon Laboratories Inc. - Product / Service
                • Silicon Laboratories Inc. - Key news
                • Silicon Laboratories Inc. - Key offerings
                • SWOT
              • 15.15 STMicroelectronics NV
                • STMicroelectronics NV - Overview
                • STMicroelectronics NV - Business segments
                • STMicroelectronics NV - Key news
                • STMicroelectronics NV - Key offerings
                • STMicroelectronics NV - Segment focus
                • SWOT
              • 15.16 Texas Instruments Inc.
                • Texas Instruments Inc. - Overview
                • Texas Instruments Inc. - Business segments
                • Texas Instruments Inc. - Key offerings
                • Texas Instruments Inc. - Segment focus
                • SWOT
              • 15.17 Vicor Corp.
                • Vicor Corp. - Overview
                • Vicor Corp. - Product / Service
                • Vicor Corp. - Key offerings
                • SWOT
              • 15.18 Wolfspeed Inc.
                • Wolfspeed Inc. - Overview
                • Wolfspeed Inc. - Business segments
                • Wolfspeed Inc. - Key news
                • Wolfspeed Inc. - Key offerings
                • Wolfspeed Inc. - Segment focus
                • SWOT

              16 Appendix

              • 16.1 Scope of the report
                • 16.2 Inclusions and exclusions checklist
                  • Inclusions checklist
                  • Exclusions checklist
                • 16.3 Currency conversion rates for US$
                  • Currency conversion rates for US$
                • 16.4 Research methodology
                  • Research methodology
                • 16.5 Data procurement
                  • Information sources
                • 16.6 Data validation
                  • Data validation
                • 16.7 Validation techniques employed for market sizing
                  • Validation techniques employed for market sizing
                • 16.8 Data synthesis
                  • Data synthesis
                • 16.9 360 degree market analysis
                  • 360 degree market analysis
                • 16.10 List of abbreviations
                  • List of abbreviations

                Research Methodology

                Technavio presents a detailed picture of the market by way of study, synthesis, and summation of data from multiple sources. The analysts have presented the various facets of the market with a particular focus on identifying the key industry influencers. The data thus presented is comprehensive, reliable, and the result of extensive research, both primary and secondary.

                INFORMATION SOURCES

                Primary sources

                • Manufacturers and suppliers
                • Channel partners
                • Industry experts
                • Strategic decision makers

                Secondary sources

                • Industry journals and periodicals
                • Government data
                • Financial reports of key industry players
                • Historical data
                • Press releases

                DATA ANALYSIS

                Data Synthesis

                • Collation of data
                • Estimation of key figures
                • Analysis of derived insights

                Data Validation

                • Triangulation with data models
                • Reference against proprietary databases
                • Corroboration with industry experts

                REPORT WRITING

                Qualitative

                • Market drivers
                • Market challenges
                • Market trends
                • Five forces analysis

                Quantitative

                • Market size and forecast
                • Market segmentation
                • Geographical insights
                • Competitive landscape

                Interested in this report?

                Get your sample now to see our research methodology and insights!

                Download Now

                Frequently Asked Questions

                Isolated Gate Drivers market growth will increase by $ 1351 mn during 2025-2029.

                The Isolated Gate Drivers market is expected to grow at a CAGR of 15.1% during 2025-2029.

                Isolated Gate Drivers market is segmented by Product Type( Isolated IGBT gate driver, Isolated MOSFET gate driver, Others) Power Rating( Above 600V, 201V to 600V, Up to 200V) Application( Industrial, Automotive, Telecommunications and consumer electronics, Enterprise)

                Alpha and Omega Semiconductor Ltd., Analog Devices Inc., Broadcom Inc., Diodes Inc., Infineon Technologies AG, Littelfuse Inc., Microchip Technology Inc., Navitas Semiconductor Inc., Nexperia BV, ON Semiconductor Corp., Power Integrations Inc., Renesas Electronics Corp., ROHM Co. Ltd., Semtech Corp., Silicon Laboratories Inc., STMicroelectronics NV, Texas Instruments Inc., Vicor Corp., Wolfspeed Inc. are a few of the key vendors in the Isolated Gate Drivers market.

                North America will register the highest growth rate of 39% among the other regions. Therefore, the Isolated Gate Drivers market in North America is expected to garner significant business opportunities for the vendors during the forecast period.

                US, China, Germany, South Korea, Japan, France, India, Canada, UK, Brazil

                • Proliferation of electric vehicles and hybrid electric vehiclesA primary and powerful driver propelling the global isolated gate drivers market is the accelerating worldwide transition to electric vehicles (EVs) and hybrid electric vehicles (HEVs). This automotive revolution represents a fundamental shift in powertrain technology is the driving factor this market.
                • replacing mechanical systems with sophisticated high voltage electrical systems where isolated gate drivers are an indispensable component. Their core function is to safely and efficiently control the high power semiconductor switches is the driving factor this market.
                • such as IGBTs and increasingly Silicon Carbide (SiC) MOSFETs is the driving factor this market.
                • that manage the flow of energy throughout the vehicle. Key applications include the main traction inverter is the driving factor this market.
                • which converts DC power from the battery into AC power to drive the electric motor is the driving factor this market.
                • the onboard charger (OBC) responsible for replenishing the battery from the AC grid is the driving factor this market.
                • and high voltage to low voltage DC-DC converters that power the vehicles auxiliary systems. The move toward higher voltage architectures is the driving factor this market.
                • particularly the industry migration from 400V to 800V battery systems is the driving factor this market.
                • further amplifies the demand and performance requirements for these drivers. Higher voltages enable faster charging times and reduce resistive losses in the wiring is the driving factor this market.
                • but they also necessitate gate drivers with superior galvanic isolation capabilities and extremely high common mode transient immunity (CMTI) to operate reliably in such an electrically noisy environment. Safety is paramount in automotive design is the driving factor this market.
                • and the galvanic isolation provided by these drivers is critical for protecting the vehicle occupants and low voltage control electronics from potentially lethal high voltages. As the electronic content per vehicle continues to grow is the driving factor this market.
                • the need for robust is the driving factor this market.
                • reliable is the driving factor this market.
                • and AEC-Q100 qualified isolated gate drivers escalates in direct proportion is the driving factor this market.
                • making the automotive sector a cornerstone of market growth. is the driving factor this market.

                The Isolated Gate Drivers market vendors should focus on grabbing business opportunities from the Isolated IGBT gate driver segment as it accounted for the largest market share in the base year.