IT Outsourcing Market Analysis, Size, and Forecast 2026-2030: North America (US, Canada, and Mexico), Europe (UK, Germany, and France), APAC (India, China, and Japan), South America (Brazil and Argentina), Middle East and Africa (UAE, Saudi Arabia, and South Africa), and Rest of World (ROW)

IT Outsourcing Market Analysis, Size, and Forecast 2026-2030:
North America (US, Canada, and Mexico), Europe (UK, Germany, and France), APAC (India, China, and Japan), South America (Brazil and Argentina), Middle East and Africa (UAE, Saudi Arabia, and South Africa), and Rest of World (ROW)

Published: Mar 2026 302 Pages SKU: IRTNTR41083

Market Overview at a Glance

$147.82 Mn
Market Opportunity
4.7%
CAGR 2025 - 2030
34.2%
APAC Growth
$402.02 Mn
Infrastructure outsourcing segment 2024

IT Outsourcing Market Size 2026-2030

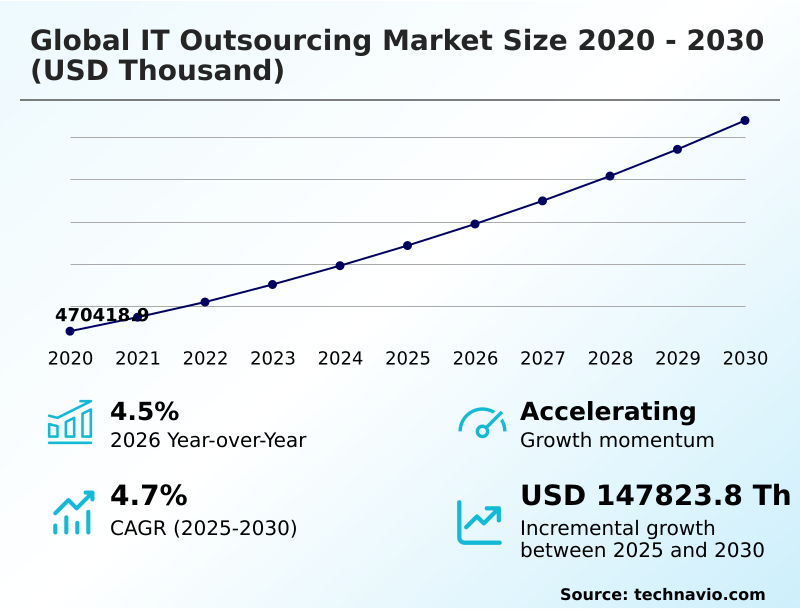
The it outsourcing market size is valued to increase by USD 147.82 million, at a CAGR of 4.7% from 2025 to 2030. Generative AI integration and AI-native service delivery will drive the it outsourcing market.

Major Market Trends & Insights

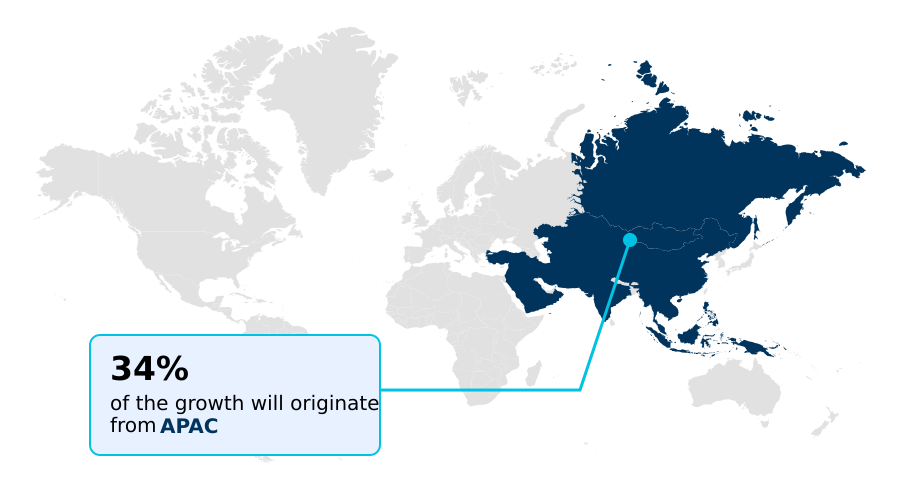
  • APAC dominated the market and accounted for a 34.2% growth during the forecast period.
  • By Type - Infrastructure outsourcing segment was valued at USD 402.02 million in 2024
  • By Service - Software as a service segment accounted for the largest market revenue share in 2024

Market Size & Forecast

  • Market Opportunities:
  • Market Future Opportunities: USD 147.82 million
  • CAGR from 2025 to 2030 : 4.7%

Market Summary

  • The IT outsourcing market is undergoing a significant transformation, moving beyond traditional cost-saving engagements to become a strategic enabler of digital innovation. This evolution is driven by the increasing need for specialized expertise in areas like generative artificial intelligence, cloud-native services, and cybersecurity.
  • As organizations adopt multi-sourcing strategies, they are shifting from monolithic contracts to agile partnerships that leverage niche capabilities. A key aspect of this shift is the adoption of outcome-based pricing, where provider compensation is tied to measurable business impacts.
  • For instance, a manufacturing firm might engage a service provider to implement an AI-driven predictive maintenance system for its supply chain, with payments linked to verified reductions in equipment downtime and operational cost savings of up to 15%. This value-driven approach fosters a more collaborative environment, where outsourced teams function as integrated extensions of the core business.
  • The rise of global capability centers further redefines the client-provider relationship, enabling companies to maintain control over intellectual property while accessing a global talent pool. This market is also shaped by a heightened focus on ESG criteria, making sustainability a critical factor in vendor selection processes, particularly in North America and Europe.

What will be the Size of the IT Outsourcing Market during the forecast period?

Get Key Insights on Market Forecast (PDF) Request Free Sample

How is the IT Outsourcing Market Segmented?

The it outsourcing industry research report provides comprehensive data (region-wise segment analysis), with forecasts and estimates in "USD thousand" for the period 2026-2030, as well as historical data from 2020-2024 for the following segments.

  • Type
    • Infrastructure outsourcing
    • Application outsourcing
  • Service
    • Software as a service
    • Infrastructure as a service
    • Platform as a service
  • End-user
    • Large enterprises
    • SMEs
  • Geography
    • North America
      • US
      • Canada
      • Mexico
    • Europe
      • UK
      • Germany
      • France
    • APAC
      • India
      • China
      • Japan
    • South America
      • Brazil
      • Argentina
    • Middle East and Africa
      • UAE
      • Saudi Arabia
      • South Africa
    • Rest of World (ROW)

By Type Insights

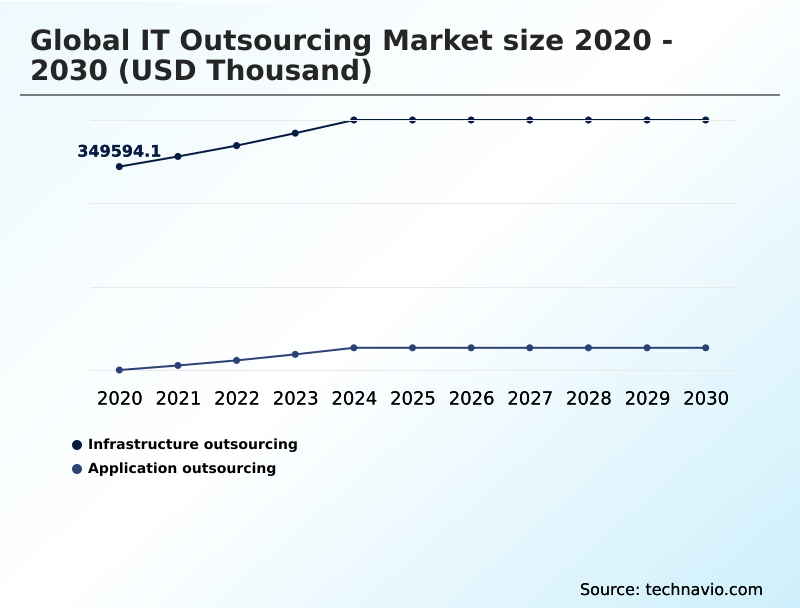
The infrastructure outsourcing segment is estimated to witness significant growth during the forecast period.

The IT outsourcing market is segmented by type, service, end-user, and geography. Infrastructure outsourcing involves delegating physical and virtual asset management, including cloud environments and network security, to external providers. This approach helps mitigate capital expenditures on proprietary server farms.

The shift to hybrid and multi-cloud architectures requires partners proficient in integrating legacy systems with modern software-defined networking.

The application outsourcing segment includes the development, maintenance, and management of software applications, enabling enterprises to access specialized talent and advanced methodologies like agile development and DevOps integration.

These services accelerate time-to-market for digital products and modernize outdated systems for enhanced performance and security. The end-user segments comprise large enterprises and SMEs, with the latter increasingly leveraging outsourcing for digital maturity.

The service segment includes software-as-a-service (SaaS), platform-as-a-service (PaaS), and infrastructure-as-a-service (IaaS), providing varied levels of control and management.

Request Free Sample

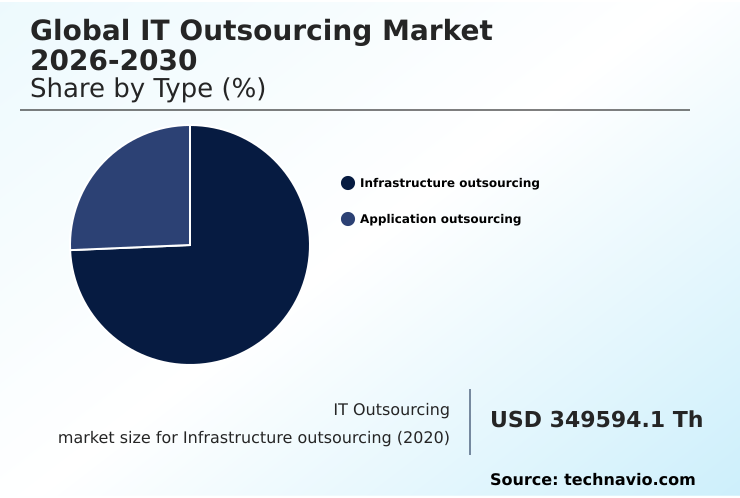
The Infrastructure outsourcing segment was valued at USD 402.02 million in 2024 and showed a gradual increase during the forecast period.

Request Free Sample

Regional Analysis

APAC is estimated to contribute 34.2% to the growth of the global market during the forecast period.Technavio’s analysts have elaborately explained the regional trends and drivers that shape the market during the forecast period.

See How IT Outsourcing Market Demand is Rising in APAC Request Free Sample

The geographic landscape of the IT outsourcing market is diverse, with North America and APAC representing the largest segments, contributing 32.79% and 34.23% to the global incremental growth, respectively.

North America, driven by the US and Canada, continues to be a primary revenue generator, focusing on high-value services like AI integration and cloud-native application development.

The region's high labor costs and talent shortages compel firms to seek external expertise for complex tasks. APAC is the fastest-growing region, with India and China leading as both major suppliers and consumers of IT services.

This region is shifting from labor arbitrage to high-end R&D and intellectual property creation, supported by government initiatives and a vast talent pool.

Europe remains a mature market focused on data sovereignty and nearshoring, while South America and the Middle East and Africa are emerging as strategic nearshore and high-investment hubs, respectively.

Market Dynamics

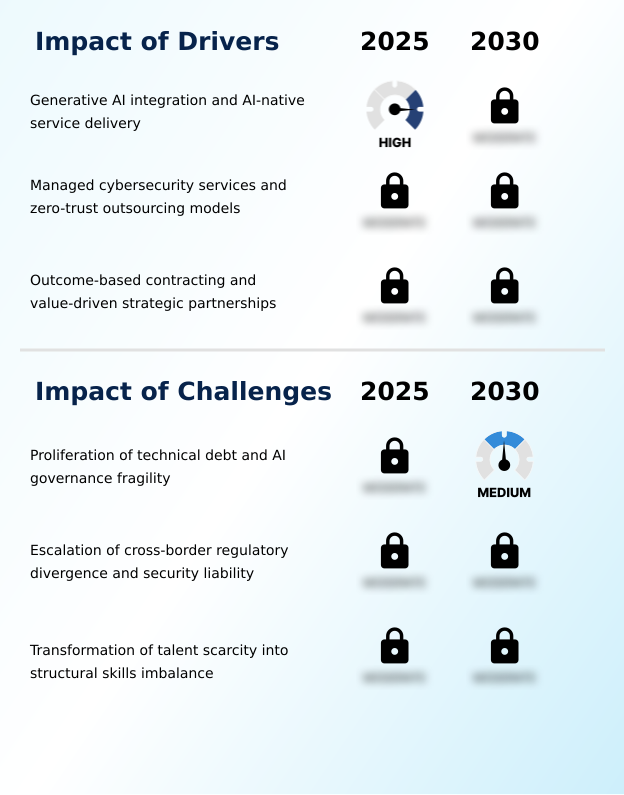
Our researchers analyzed the data with 2025 as the base year, along with the key drivers, trends, and challenges. A holistic analysis of drivers will help companies refine their marketing strategies to gain a competitive advantage.

  • The IT outsourcing market is at a pivotal juncture, where the impact of generative AI on IT outsourcing models is reshaping service delivery. This transition, however, introduces challenges in managing technical debt in legacy systems, making application modernization a critical focus.
  • In response, organizations are realizing the benefits of sovereign cloud for data residency, which addresses escalating concerns over cross-border regulatory divergence in outsourcing. To fortify security, the role of zero-trust models in outsourced security is becoming standard practice. Strategically, businesses are comparing nearshore vs.
  • offshore IT outsourcing strategies to balance cost, agility, and time-zone alignment, a decision now complicated by the structural skills imbalance for site reliability engineering. The question of how AI governance affects outsourcing partnerships is central to new contracts, which are increasingly implementing outcome-based pricing in service contracts.
  • These performance-based models for infrastructure management, sometimes tracked with digital twins for tracking outsourcing KPIs, promise greater value alignment. Concurrently, the upskilling workforce for cloud-native environments is a non-negotiable investment. Firms are deploying DevSecOps in a multi-sourcing strategy and using agentic workflow automation in business process outsourcing to enhance efficiency.
  • The rise of low-code platforms is also democratizing development, with some firms reporting project accelerations twice that of traditional methods. Using global capability centers and integrating sustainable technology are becoming key differentiators.

What are the key market drivers leading to the rise in the adoption of IT Outsourcing Industry?

  • The integration of generative AI and the shift toward AI-native service delivery models are key drivers propelling market growth.

  • The IT outsourcing market is propelled by the rapid integration of generative artificial intelligence and the evolution of AI-native service delivery.
  • This driver is characterized by automated workflows where AI-driven co-pilots and code generators significantly accelerate project timelines, forcing providers to modernize operating models with proprietary AI tools.
  • Another key driver is the rise of managed cybersecurity services and zero-trust outsourcing models. Escalating cyber threats and complex regulations have made specialized security outsourcing a priority, with providers offering end-to-end solutions.
  • This shift is supported by fiscal policies in key regions, such as the establishment of a uniform safe harbor margin of 15.5% for IT services, which provides stability for large-scale international operations.
  • Finally, the strategic evolution toward outcome-based contracting and value-driven partnerships continues to fuel growth, linking compensation to measurable business results and incentivizing innovation.

What are the market trends shaping the IT Outsourcing Industry?

  • The growth of sovereign cloud infrastructure services is an upcoming market trend, driven by the increasing need for data localization and compliance with regional regulations.

  • Key trends are reshaping the IT outsourcing market, with a significant structural realignment toward sovereign cloud infrastructure. This shift is driven by the need for digital independence and compliance with data residency requirements, with spending on sovereign cloud solutions increasing by 35.6% in some regions.
  • The adoption of outcome-based managed services is another critical trend, as over 50% of new contracts now tie compensation to performance metrics, reflecting a move toward value-driven partnerships. This requires advanced data analytics for tracking KPIs like system uptime and digital transformation velocity.
  • Furthermore, the integration of sustainable technology and green outsourcing mandates is becoming standard, with providers selected based on their carbon footprint and ability to optimize cloud resources. This push for circular IT and green coding initiatives aligns with corporate net-zero goals, transforming digital transformation into a driver of environmental stewardship.

What challenges does the IT Outsourcing Industry face during its growth?

  • The proliferation of technical debt and the fragility of AI governance frameworks present a key challenge to the industry's growth trajectory.

  • The IT outsourcing market faces significant challenges, primarily the proliferation of technical debt and the fragility of AI governance. The rapid deployment of proprietary AI solutions by outsourcing providers creates complexities around intellectual property and exit planning, while the need for human-in-the-loop oversight adds non-discretionary costs. Another major challenge is the escalation of cross-border regulatory divergence and security liability.
  • Navigating overlapping data privacy laws and the multiplied entry points from distributed cloud architectures force partners to assume greater legal responsibility, increasing the cost of compliance audits. Finally, the transformation of talent scarcity into a structural skills imbalance is a critical restraint.
  • While a large technical workforce exists, there is a shortage of professionals with dual expertise in managing cloud-native environments and AI-optimized servers, with at least 80% of enterprises now moving toward deploying autonomous AI agents.

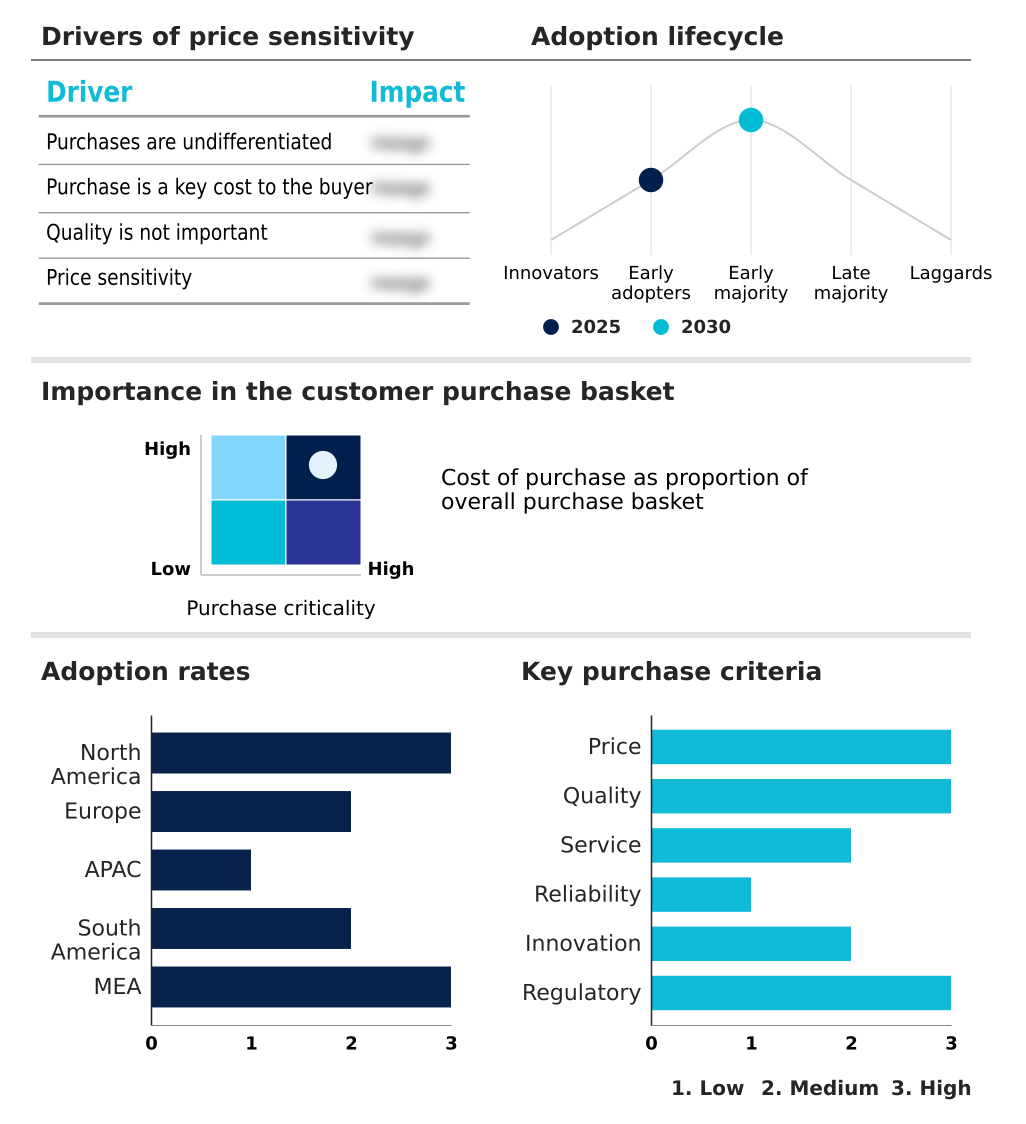
Exclusive Technavio Analysis on Customer Landscape

The it outsourcing market forecasting report includes the adoption lifecycle of the market, covering from the innovator’s stage to the laggard’s stage. It focuses on adoption rates in different regions based on penetration. Furthermore, the it outsourcing market report also includes key purchase criteria and drivers of price sensitivity to help companies evaluate and develop their market growth analysis strategies.

Customer Landscape of IT Outsourcing Industry

Competitive Landscape

Companies are implementing various strategies, such as strategic alliances, it outsourcing market forecast, partnerships, mergers and acquisitions, geographical expansion, and product/service launches, to enhance their presence in the industry.

Accenture Plc - Delivering application outsourcing and infrastructure managed services to support enterprise digital transformation.

The industry research and growth report includes detailed analyses of the competitive landscape of the market and information about key companies, including:

  • Accenture Plc
  • Atos SE
  • Capgemini SE
  • CGI Inc.
  • Cognizant Technology Solution
  • DXC Technology Co.
  • Fujitsu Ltd.
  • HCL Technologies Ltd.
  • Hewlett Packard Enterprise Co.
  • Hexaware Technologies Ltd.
  • IBM Corp.
  • Infosys Ltd.
  • Leidos Holdings Inc.
  • Mphasis Ltd.
  • NTT DATA Corp.
  • Stefanini Group
  • Tata Consultancy Services
  • Tech Mahindra Ltd.
  • Unisys Corp.
  • Wipro Ltd.

Qualitative and quantitative analysis of companies has been conducted to help clients understand the wider business environment as well as the strengths and weaknesses of key industry players. Data is qualitatively analyzed to categorize companies as pure play, category-focused, industry-focused, and diversified; it is quantitatively analyzed to categorize companies as dominant, leading, strong, tentative, and weak.

Recent Development and News in It outsourcing market

  • In March 2025, Accenture Plc expanded its strategic partnership with Microsoft to launch a forward-deployed engineering practice, aiming to help enterprises rapidly operationalize AI across their operations.
  • In February 2025, Infosys announced a strategic partnership with Citizens Financial Group to launch an AI-first Innovation Hub, seeking to accelerate agentic AI-led transformation across banking operations and customer experience.
  • In February 2025, the Indian government's Union Budget introduced a uniform safe harbor margin of 15.5% for IT services, providing fiscal predictability for large-scale international security and data processing operations.
  • In January 2025, industry reports confirmed that the move toward value-linked models has introduced new legal and operational considerations around data integrity and shared liability allocation in over 50% of new contracts.

Dive into Technavio’s robust research methodology, blending expert interviews, extensive data synthesis, and validated models for unparalleled IT Outsourcing Market insights. See full methodology.

Market Scope
Page number 302
Base year 2025
Historic period 2020-2024
Forecast period 2026-2030
Growth momentum & CAGR Accelerate at a CAGR of 4.7%
Market growth 2026-2030 USD 147823.8 thousand
Market structure Fragmented
YoY growth 2025-2026(%) 4.5%
Key countries US, Canada, Mexico, UK, Germany, France, The Netherlands, Italy, Spain, India, China, Japan, South Korea, Australia, Indonesia, Brazil, Argentina, Chile, UAE, Saudi Arabia, South Africa, Israel and Turkey
Competitive landscape Leading Companies, Market Positioning of Companies, Competitive Strategies, and Industry Risks

Request Free Sample

Research Analyst Overview

  • The IT outsourcing market is fundamentally shifting towards high-value, strategic partnerships. The integration of generative artificial intelligence and AI-native service delivery is now a core component, moving beyond simple cost arbitrage. Organizations are leveraging AI-driven co-pilots and code generators to accelerate project timelines, while automated testing and predictive analytics enhance system reliability.
  • This evolution necessitates robust AI governance to manage technical debt and ensure intellectual property clarity. A significant trend is the adoption of sovereign cloud infrastructure to comply with data residency mandates, a boardroom-level concern that directly impacts global strategy and risk management. This move is complemented by the implementation of zero-trust outsourcing models for heightened security.
  • As firms adopt these advanced cloud-native services, many are achieving over 30% improvement in deployment frequencies. The market's future hinges on the ability of providers to offer not just technical execution but also strategic guidance through complex transformations involving agentic workflows, DevSecOps, and site reliability engineering.

What are the Key Data Covered in this IT Outsourcing Market Research and Growth Report?

  • What is the expected growth of the IT Outsourcing Market between 2026 and 2030?

    • USD 147.82 million, at a CAGR of 4.7%

  • What segmentation does the market report cover?

    • The report is segmented by Type (Infrastructure outsourcing, and Application outsourcing), Service (Software as a service, Infrastructure as a service, and Platform as a service), End-user (Large enterprises, and SMEs) and Geography (North America, Europe, APAC, South America, Middle East and Africa)

  • Which regions are analyzed in the report?

    • North America, Europe, APAC, South America and Middle East and Africa

  • What are the key growth drivers and market challenges?

    • Generative AI integration and AI-native service delivery, Proliferation of technical debt and AI governance fragility

  • Who are the major players in the IT Outsourcing Market?

    • Accenture Plc, Atos SE, Capgemini SE, CGI Inc., Cognizant Technology Solution, DXC Technology Co., Fujitsu Ltd., HCL Technologies Ltd., Hewlett Packard Enterprise Co., Hexaware Technologies Ltd., IBM Corp., Infosys Ltd., Leidos Holdings Inc., Mphasis Ltd., NTT DATA Corp., Stefanini Group, Tata Consultancy Services, Tech Mahindra Ltd., Unisys Corp. and Wipro Ltd.

Market Research Insights

  • The dynamics of the IT outsourcing market are increasingly shaped by a strategic pivot toward value-driven partnerships and performance-based models. Over 50% of new outsourcing contracts are now structured around outcome-based metrics, a significant shift from traditional billing.
  • This evolution is fueled by the need for tangible business results, where shared-risk agreements and managed cybersecurity services incentivize providers to drive innovation and reduce operational costs. The adoption of DevOps practices and SecOps is allowing organizations to consolidate vendor landscapes for better oversight, with some achieving a 15% reduction in total cost of ownership.
  • This trend is particularly influential for managed services, forcing providers to adopt leaner squads that utilize advanced methodologies for continuous delivery. As organizations align IT spending with measurable KPIs, the role of outcome-based delivery remains a fundamental component of market differentiation.

We can help! Our analysts can customize this it outsourcing market research report to meet your requirements.

Get in touch

1. Executive Summary

1.1 Market overview

Executive Summary - Chart on Market Overview
Executive Summary - Data Table on Market Overview
Executive Summary - Chart on Global Market Characteristics
Executive Summary - Chart on Market by Geography
Executive Summary - Chart on Market Segmentation by Type
Executive Summary - Chart on Market Segmentation by Service
Executive Summary - Chart on Market Segmentation by End-user
Executive Summary - Chart on Incremental Growth
Executive Summary - Data Table on Incremental Growth
Executive Summary - Chart on Company Market Positioning

2. Technavio Analysis

2.1 Analysis of price sensitivity, lifecycle, customer purchase basket, adoption rates, and purchase criteria

2.2 Criticality of inputs and Factors of differentiation

Chart on Overview on criticality of inputs and factors of differentiation

2.3 Factors of disruption

Chart on Overview on factors of disruption

2.4 Impact of drivers and challenges

Chart on Impact of drivers and challenges in 2025 and 2030

3. Market Landscape

3.1 Market ecosystem

Chart on Parent Market
Data Table on - Parent Market

3.2 Market characteristics

Chart on Market characteristics analysis

3.3 Value chain analysis

Chart on Value chain analysis

4. Market Sizing

4.1 Market definition

Data Table on Offerings of companies included in the market definition

4.2 Market segment analysis

Market segments

4.3 Market size 2025

4.4 Market outlook: Forecast for 2025-2030

Chart on Global - Market size and forecast 2025-2030 ($ thousand)
Data Table on Global - Market size and forecast 2025-2030 ($ thousand)
Chart on Global Market: Year-over-year growth 2025-2030 (%)
Data Table on Global Market: Year-over-year growth 2025-2030 (%)

5. Historic Market Size

5.1 Global IT Outsourcing Market 2020 - 2024

Historic Market Size - Data Table on Global IT Outsourcing Market 2020 - 2024 ($ thousand)

5.2 Type segment analysis 2020 - 2024

Historic Market Size - Type Segment 2020 - 2024 ($ thousand)

5.3 Service segment analysis 2020 - 2024

Historic Market Size - Service Segment 2020 - 2024 ($ thousand)

5.4 End-user segment analysis 2020 - 2024

Historic Market Size - End-user Segment 2020 - 2024 ($ thousand)

5.5 Geography segment analysis 2020 - 2024

Historic Market Size - Geography Segment 2020 - 2024 ($ thousand)

5.6 Country segment analysis 2020 - 2024

Historic Market Size - Country Segment 2020 - 2024 ($ thousand)

6. Qualitative Analysis

6.1 Impact of AI in global IT outsourcing market

6.2 Impact of geopolitical conflict for global IT outsourcing market

7. Five Forces Analysis

7.1 Five forces summary

Five forces analysis - Comparison between 2025 and 2030

7.2 Bargaining power of buyers

Bargaining power of buyers - Impact of key factors 2025 and 2030

7.3 Bargaining power of suppliers

Bargaining power of suppliers - Impact of key factors in 2025 and 2030

7.4 Threat of new entrants

Threat of new entrants - Impact of key factors in 2025 and 2030

7.5 Threat of substitutes

Threat of substitutes - Impact of key factors in 2025 and 2030

7.6 Threat of rivalry

Threat of rivalry - Impact of key factors in 2025 and 2030

7.7 Market condition

Chart on Market condition - Five forces 2025 and 2030

8. Market Segmentation by Type

8.1 Market segments

Chart on Type - Market share 2025-2030 (%)
Data Table on Type - Market share 2025-2030 (%)

8.2 Comparison by Type

Chart on Comparison by Type
Data Table on Comparison by Type

8.3 Infrastructure outsourcing - Market size and forecast 2025-2030

Chart on Infrastructure outsourcing - Market size and forecast 2025-2030 ($ thousand)
Data Table on Infrastructure outsourcing - Market size and forecast 2025-2030 ($ thousand)
Chart on Infrastructure outsourcing - Year-over-year growth 2025-2030 (%)
Data Table on Infrastructure outsourcing - Year-over-year growth 2025-2030 (%)

8.4 Application outsourcing - Market size and forecast 2025-2030

Chart on Application outsourcing - Market size and forecast 2025-2030 ($ thousand)
Data Table on Application outsourcing - Market size and forecast 2025-2030 ($ thousand)
Chart on Application outsourcing - Year-over-year growth 2025-2030 (%)
Data Table on Application outsourcing - Year-over-year growth 2025-2030 (%)

8.5 Market opportunity by Type

Market opportunity by Type ($ thousand)
Data Table on Market opportunity by Type ($ thousand)

9. Market Segmentation by Service

9.1 Market segments

Chart on Service - Market share 2025-2030 (%)
Data Table on Service - Market share 2025-2030 (%)

9.2 Comparison by Service

Chart on Comparison by Service
Data Table on Comparison by Service

9.3 Software as a service - Market size and forecast 2025-2030

Chart on Software as a service - Market size and forecast 2025-2030 ($ thousand)
Data Table on Software as a service - Market size and forecast 2025-2030 ($ thousand)
Chart on Software as a service - Year-over-year growth 2025-2030 (%)
Data Table on Software as a service - Year-over-year growth 2025-2030 (%)

9.4 Infrastructure as a service - Market size and forecast 2025-2030

Chart on Infrastructure as a service - Market size and forecast 2025-2030 ($ thousand)
Data Table on Infrastructure as a service - Market size and forecast 2025-2030 ($ thousand)
Chart on Infrastructure as a service - Year-over-year growth 2025-2030 (%)
Data Table on Infrastructure as a service - Year-over-year growth 2025-2030 (%)

9.5 Platform as a service - Market size and forecast 2025-2030

Chart on Platform as a service - Market size and forecast 2025-2030 ($ thousand)
Data Table on Platform as a service - Market size and forecast 2025-2030 ($ thousand)
Chart on Platform as a service - Year-over-year growth 2025-2030 (%)
Data Table on Platform as a service - Year-over-year growth 2025-2030 (%)

9.6 Market opportunity by Service

Market opportunity by Service ($ thousand)
Data Table on Market opportunity by Service ($ thousand)

10. Market Segmentation by End-user

10.1 Market segments

Chart on End-user - Market share 2025-2030 (%)
Data Table on End-user - Market share 2025-2030 (%)

10.2 Comparison by End-user

Chart on Comparison by End-user
Data Table on Comparison by End-user

10.3 Large enterprises - Market size and forecast 2025-2030

Chart on Large enterprises - Market size and forecast 2025-2030 ($ thousand)
Data Table on Large enterprises - Market size and forecast 2025-2030 ($ thousand)
Chart on Large enterprises - Year-over-year growth 2025-2030 (%)
Data Table on Large enterprises - Year-over-year growth 2025-2030 (%)

10.4 SMEs - Market size and forecast 2025-2030

Chart on SMEs - Market size and forecast 2025-2030 ($ thousand)
Data Table on SMEs - Market size and forecast 2025-2030 ($ thousand)
Chart on SMEs - Year-over-year growth 2025-2030 (%)
Data Table on SMEs - Year-over-year growth 2025-2030 (%)

10.5 Market opportunity by End-user

Market opportunity by End-user ($ thousand)
Data Table on Market opportunity by End-user ($ thousand)

11. Customer Landscape

11.1 Customer landscape overview

Analysis of price sensitivity, lifecycle, customer purchase basket, adoption rates, and purchase criteria

12. Geographic Landscape

12.1 Geographic segmentation

Chart on Market share by geography 2025-2030 (%)
Data Table on Market share by geography 2025-2030 (%)

12.2 Geographic comparison

Chart on Geographic comparison
Data Table on Geographic comparison

12.3 North America - Market size and forecast 2025-2030

Chart on North America - Market size and forecast 2025-2030 ($ thousand)
Data Table on North America - Market size and forecast 2025-2030 ($ thousand)
Chart on North America - Year-over-year growth 2025-2030 (%)
Data Table on North America - Year-over-year growth 2025-2030 (%)
Chart on Regional Comparison - North America
Data Table on Regional Comparison - North America

12.3.1 US - Market size and forecast 2025-2030

Chart on US - Market size and forecast 2025-2030 ($ thousand)
Data Table on US - Market size and forecast 2025-2030 ($ thousand)
Chart on US - Year-over-year growth 2025-2030 (%)
Data Table on US - Year-over-year growth 2025-2030 (%)

12.3.2 Canada - Market size and forecast 2025-2030

Chart on Canada - Market size and forecast 2025-2030 ($ thousand)
Data Table on Canada - Market size and forecast 2025-2030 ($ thousand)
Chart on Canada - Year-over-year growth 2025-2030 (%)
Data Table on Canada - Year-over-year growth 2025-2030 (%)

12.3.3 Mexico - Market size and forecast 2025-2030

Chart on Mexico - Market size and forecast 2025-2030 ($ thousand)
Data Table on Mexico - Market size and forecast 2025-2030 ($ thousand)
Chart on Mexico - Year-over-year growth 2025-2030 (%)
Data Table on Mexico - Year-over-year growth 2025-2030 (%)

12.4 Europe - Market size and forecast 2025-2030

Chart on Europe - Market size and forecast 2025-2030 ($ thousand)
Data Table on Europe - Market size and forecast 2025-2030 ($ thousand)
Chart on Europe - Year-over-year growth 2025-2030 (%)
Data Table on Europe - Year-over-year growth 2025-2030 (%)
Chart on Regional Comparison - Europe
Data Table on Regional Comparison - Europe

12.4.1 UK - Market size and forecast 2025-2030

Chart on UK - Market size and forecast 2025-2030 ($ thousand)
Data Table on UK - Market size and forecast 2025-2030 ($ thousand)
Chart on UK - Year-over-year growth 2025-2030 (%)
Data Table on UK - Year-over-year growth 2025-2030 (%)

12.4.2 Germany - Market size and forecast 2025-2030

Chart on Germany - Market size and forecast 2025-2030 ($ thousand)
Data Table on Germany - Market size and forecast 2025-2030 ($ thousand)
Chart on Germany - Year-over-year growth 2025-2030 (%)
Data Table on Germany - Year-over-year growth 2025-2030 (%)

12.4.3 France - Market size and forecast 2025-2030

Chart on France - Market size and forecast 2025-2030 ($ thousand)
Data Table on France - Market size and forecast 2025-2030 ($ thousand)
Chart on France - Year-over-year growth 2025-2030 (%)
Data Table on France - Year-over-year growth 2025-2030 (%)

12.4.4 The Netherlands - Market size and forecast 2025-2030

Chart on The Netherlands - Market size and forecast 2025-2030 ($ thousand)
Data Table on The Netherlands - Market size and forecast 2025-2030 ($ thousand)
Chart on The Netherlands - Year-over-year growth 2025-2030 (%)
Data Table on The Netherlands - Year-over-year growth 2025-2030 (%)

12.4.5 Italy - Market size and forecast 2025-2030

Chart on Italy - Market size and forecast 2025-2030 ($ thousand)
Data Table on Italy - Market size and forecast 2025-2030 ($ thousand)
Chart on Italy - Year-over-year growth 2025-2030 (%)
Data Table on Italy - Year-over-year growth 2025-2030 (%)

12.4.6 Spain - Market size and forecast 2025-2030

Chart on Spain - Market size and forecast 2025-2030 ($ thousand)
Data Table on Spain - Market size and forecast 2025-2030 ($ thousand)
Chart on Spain - Year-over-year growth 2025-2030 (%)
Data Table on Spain - Year-over-year growth 2025-2030 (%)

12.5 APAC - Market size and forecast 2025-2030

Chart on APAC - Market size and forecast 2025-2030 ($ thousand)
Data Table on APAC - Market size and forecast 2025-2030 ($ thousand)
Chart on APAC - Year-over-year growth 2025-2030 (%)
Data Table on APAC - Year-over-year growth 2025-2030 (%)
Chart on Regional Comparison - APAC
Data Table on Regional Comparison - APAC

12.5.1 India - Market size and forecast 2025-2030

Chart on India - Market size and forecast 2025-2030 ($ thousand)
Data Table on India - Market size and forecast 2025-2030 ($ thousand)
Chart on India - Year-over-year growth 2025-2030 (%)
Data Table on India - Year-over-year growth 2025-2030 (%)

12.5.2 China - Market size and forecast 2025-2030

Chart on China - Market size and forecast 2025-2030 ($ thousand)
Data Table on China - Market size and forecast 2025-2030 ($ thousand)
Chart on China - Year-over-year growth 2025-2030 (%)
Data Table on China - Year-over-year growth 2025-2030 (%)

12.5.3 Japan - Market size and forecast 2025-2030

Chart on Japan - Market size and forecast 2025-2030 ($ thousand)
Data Table on Japan - Market size and forecast 2025-2030 ($ thousand)
Chart on Japan - Year-over-year growth 2025-2030 (%)
Data Table on Japan - Year-over-year growth 2025-2030 (%)

12.5.4 South Korea - Market size and forecast 2025-2030

Chart on South Korea - Market size and forecast 2025-2030 ($ thousand)
Data Table on South Korea - Market size and forecast 2025-2030 ($ thousand)
Chart on South Korea - Year-over-year growth 2025-2030 (%)
Data Table on South Korea - Year-over-year growth 2025-2030 (%)

12.5.5 Australia - Market size and forecast 2025-2030

Chart on Australia - Market size and forecast 2025-2030 ($ thousand)
Data Table on Australia - Market size and forecast 2025-2030 ($ thousand)
Chart on Australia - Year-over-year growth 2025-2030 (%)
Data Table on Australia - Year-over-year growth 2025-2030 (%)

12.5.6 Indonesia - Market size and forecast 2025-2030

Chart on Indonesia - Market size and forecast 2025-2030 ($ thousand)
Data Table on Indonesia - Market size and forecast 2025-2030 ($ thousand)
Chart on Indonesia - Year-over-year growth 2025-2030 (%)
Data Table on Indonesia - Year-over-year growth 2025-2030 (%)

12.6 South America - Market size and forecast 2025-2030

Chart on South America - Market size and forecast 2025-2030 ($ thousand)
Data Table on South America - Market size and forecast 2025-2030 ($ thousand)
Chart on South America - Year-over-year growth 2025-2030 (%)
Data Table on South America - Year-over-year growth 2025-2030 (%)
Chart on Regional Comparison - South America
Data Table on Regional Comparison - South America

12.6.1 Brazil - Market size and forecast 2025-2030

Chart on Brazil - Market size and forecast 2025-2030 ($ thousand)
Data Table on Brazil - Market size and forecast 2025-2030 ($ thousand)
Chart on Brazil - Year-over-year growth 2025-2030 (%)
Data Table on Brazil - Year-over-year growth 2025-2030 (%)

12.6.2 Argentina - Market size and forecast 2025-2030

Chart on Argentina - Market size and forecast 2025-2030 ($ thousand)
Data Table on Argentina - Market size and forecast 2025-2030 ($ thousand)
Chart on Argentina - Year-over-year growth 2025-2030 (%)
Data Table on Argentina - Year-over-year growth 2025-2030 (%)

12.6.3 Chile - Market size and forecast 2025-2030

Chart on Chile - Market size and forecast 2025-2030 ($ thousand)
Data Table on Chile - Market size and forecast 2025-2030 ($ thousand)
Chart on Chile - Year-over-year growth 2025-2030 (%)
Data Table on Chile - Year-over-year growth 2025-2030 (%)

12.7 Middle East and Africa - Market size and forecast 2025-2030

Chart on Middle East and Africa - Market size and forecast 2025-2030 ($ thousand)
Data Table on Middle East and Africa - Market size and forecast 2025-2030 ($ thousand)
Chart on Middle East and Africa - Year-over-year growth 2025-2030 (%)
Data Table on Middle East and Africa - Year-over-year growth 2025-2030 (%)
Chart on Regional Comparison - Middle East and Africa
Data Table on Regional Comparison - Middle East and Africa

12.7.1 UAE - Market size and forecast 2025-2030

Chart on UAE - Market size and forecast 2025-2030 ($ thousand)
Data Table on UAE - Market size and forecast 2025-2030 ($ thousand)
Chart on UAE - Year-over-year growth 2025-2030 (%)
Data Table on UAE - Year-over-year growth 2025-2030 (%)

12.7.2 Saudi Arabia - Market size and forecast 2025-2030

Chart on Saudi Arabia - Market size and forecast 2025-2030 ($ thousand)
Data Table on Saudi Arabia - Market size and forecast 2025-2030 ($ thousand)
Chart on Saudi Arabia - Year-over-year growth 2025-2030 (%)
Data Table on Saudi Arabia - Year-over-year growth 2025-2030 (%)

12.7.3 South Africa - Market size and forecast 2025-2030

Chart on South Africa - Market size and forecast 2025-2030 ($ thousand)
Data Table on South Africa - Market size and forecast 2025-2030 ($ thousand)
Chart on South Africa - Year-over-year growth 2025-2030 (%)
Data Table on South Africa - Year-over-year growth 2025-2030 (%)

12.7.4 Israel - Market size and forecast 2025-2030

Chart on Israel - Market size and forecast 2025-2030 ($ thousand)
Data Table on Israel - Market size and forecast 2025-2030 ($ thousand)
Chart on Israel - Year-over-year growth 2025-2030 (%)
Data Table on Israel - Year-over-year growth 2025-2030 (%)

12.7.5 Turkey - Market size and forecast 2025-2030

Chart on Turkey - Market size and forecast 2025-2030 ($ thousand)
Data Table on Turkey - Market size and forecast 2025-2030 ($ thousand)
Chart on Turkey - Year-over-year growth 2025-2030 (%)
Data Table on Turkey - Year-over-year growth 2025-2030 (%)

12.8 Market opportunity by geography

Market opportunity by geography ($ thousand)
Data Tables on Market opportunity by geography ($ thousand)

13. Drivers, Challenges, and Opportunity

13.1 Market drivers

Generative AI integration and AI-native service delivery
Managed cybersecurity services and zero-trust outsourcing models
Outcome-based contracting and value-driven strategic partnerships

13.2 Market challenges

Proliferation of technical debt and AI governance fragility
Escalation of cross-border regulatory divergence and security liability
Transformation of talent scarcity into structural skills imbalance

13.3 Impact of drivers and challenges

Impact of drivers and challenges in 2025 and 2030

13.4 Market opportunities

Growth of sovereign cloud infrastructure services
Adoption of outcome-based managed service engagement models
Integration of sustainable technology and green outsourcing mandates

14. Competitive Landscape

14.1 Overview

14.2

Overview on criticality of inputs and factors of differentiation

14.3 Landscape disruption

Overview on factors of disruption

14.4 Industry risks

Impact of key risks on business

15. Competitive Analysis

15.1 Companies profiled

Companies covered

15.2 Company ranking index

15.3 Market positioning of companies

Matrix on companies position and classification

15.4 Accenture Plc

Accenture Plc - Overview
Accenture Plc - Business segments
Accenture Plc - Key news
Accenture Plc - Key offerings
Accenture Plc - Segment focus
SWOT

15.5 Atos SE

Atos SE - Overview
Atos SE - Business segments
Atos SE - Key offerings
Atos SE - Segment focus
SWOT

15.6 Capgemini SE

Capgemini SE - Overview
Capgemini SE - Business segments
Capgemini SE - Key news
Capgemini SE - Key offerings
Capgemini SE - Segment focus
SWOT

15.7 CGI Inc.

CGI Inc. - Overview
CGI Inc. - Business segments
CGI Inc. - Key offerings
CGI Inc. - Segment focus
SWOT

15.8 Cognizant Technology Solution

Cognizant Technology Solution - Overview
Cognizant Technology Solution - Business segments
Cognizant Technology Solution - Key news
Cognizant Technology Solution - Key offerings
Cognizant Technology Solution - Segment focus
SWOT

15.9 DXC Technology Co.

DXC Technology Co. - Overview
DXC Technology Co. - Business segments
DXC Technology Co. - Key news
DXC Technology Co. - Key offerings
DXC Technology Co. - Segment focus
SWOT

15.10 HCL Technologies Ltd.

HCL Technologies Ltd. - Overview
HCL Technologies Ltd. - Business segments
HCL Technologies Ltd. - Key news
HCL Technologies Ltd. - Key offerings
HCL Technologies Ltd. - Segment focus
SWOT

15.11 Hewlett Packard Enterprise Co.

Hewlett Packard Enterprise Co. - Overview
Hewlett Packard Enterprise Co. - Business segments
Hewlett Packard Enterprise Co. - Key news
Hewlett Packard Enterprise Co. - Key offerings
Hewlett Packard Enterprise Co. - Segment focus
SWOT

15.12 IBM Corp.

IBM Corp. - Overview
IBM Corp. - Business segments
IBM Corp. - Key news
IBM Corp. - Key offerings
IBM Corp. - Segment focus
SWOT

15.13 Infosys Ltd.

Infosys Ltd. - Overview
Infosys Ltd. - Business segments
Infosys Ltd. - Key offerings
Infosys Ltd. - Segment focus
SWOT

15.14 NTT DATA Corp.

NTT DATA Corp. - Overview
NTT DATA Corp. - Business segments
NTT DATA Corp. - Key offerings
NTT DATA Corp. - Segment focus
SWOT

15.15 Tata Consultancy Services

Tata Consultancy Services - Overview
Tata Consultancy Services - Business segments
Tata Consultancy Services - Key offerings
Tata Consultancy Services - Segment focus
SWOT

15.16 Tech Mahindra Ltd.

Tech Mahindra Ltd. - Overview
Tech Mahindra Ltd. - Business segments
Tech Mahindra Ltd. - Key news
Tech Mahindra Ltd. - Key offerings
Tech Mahindra Ltd. - Segment focus
SWOT

15.17 Unisys Corp.

Unisys Corp. - Overview
Unisys Corp. - Business segments
Unisys Corp. - Key news
Unisys Corp. - Key offerings
Unisys Corp. - Segment focus
SWOT

15.18 Wipro Ltd.

Wipro Ltd. - Overview
Wipro Ltd. - Business segments
Wipro Ltd. - Key news
Wipro Ltd. - Key offerings
Wipro Ltd. - Segment focus
SWOT

16. Appendix

16.1 Scope of the report

Market definition
Objectives
Notes and caveats

16.2 Inclusions and exclusions checklist

Inclusions checklist
Exclusions checklist

16.3 Currency conversion rates for US$

16.4 Research methodology

16.5 Data procurement

Information sources

16.6 Data validation

16.7 Validation techniques employed for market sizing

16.8 Data synthesis

16.9 360 degree market analysis

16.10 List of abbreviations

Research Methodology

Technavio presents a detailed picture of the market by way of study, synthesis, and summation of data from multiple sources. The analysts have presented the various facets of the market with a particular focus on identifying the key industry influencers. The data thus presented is comprehensive, reliable, and the result of extensive research, both primary and secondary.

INFORMATION SOURCES

Primary sources

  • Manufacturers and suppliers
  • Channel partners
  • Industry experts
  • Strategic decision makers

Secondary sources

  • Industry journals and periodicals
  • Government data
  • Financial reports of key industry players
  • Historical data
  • Press releases

DATA ANALYSIS

Data Synthesis

  • Collation of data
  • Estimation of key figures
  • Analysis of derived insights

Data Validation

  • Triangulation with data models
  • Reference against proprietary databases
  • Corroboration with industry experts

REPORT WRITING

Qualitative

  • Market drivers
  • Market challenges
  • Market trends
  • Five forces analysis

Quantitative

  • Market size and forecast
  • Market segmentation
  • Geographical insights
  • Competitive landscape

Interested in this report?

Get your sample now to see our research methodology and insights!

Download Now

Frequently Asked Questions

IT Outsourcing market growth will increase by USD 147823.8 thousand thousand during 2026-2030.

The IT Outsourcing market is expected to grow at a CAGR of 4.7% during 2026-2030.

IT Outsourcing market is segmented by Type (Infrastructure outsourcing, Application outsourcing) Service (Software as a service, Infrastructure as a service, Platform as a service) End-user (Large enterprises, SMEs)

Accenture Plc, Atos SE, Capgemini SE, CGI Inc., Cognizant Technology Solution, DXC Technology Co., Fujitsu Ltd., HCL Technologies Ltd., Hewlett Packard Enterprise Co., Hexaware Technologies Ltd., IBM Corp., Infosys Ltd., Leidos Holdings Inc., Mphasis Ltd., NTT DATA Corp., Stefanini Group, Tata Consultancy Services, Tech Mahindra Ltd., Unisys Corp., Wipro Ltd. are a few of the key vendors in the IT Outsourcing market.

APAC will register the highest growth rate of 34.2% among the other regions. Therefore, the IT Outsourcing market in APAC is expected to garner significant business opportunities for the vendors during the forecast period.

US, Canada, Mexico, UK, Germany, France, The Netherlands, Italy, Spain, India, China, Japan, South Korea, Australia, Indonesia, Brazil, Argentina, Chile, UAE, Saudi Arabia, South Africa, Israel, Turkey

  • Generative AI integration and AI-native service delivery is the driving factor this market.

The IT Outsourcing market vendors should focus on grabbing business opportunities from the Type segment as it accounted for the largest market share in the base year.
RIA - Research AI Assistant
Ask RIA