Jewelry Appraisal Market Size 2025-2029
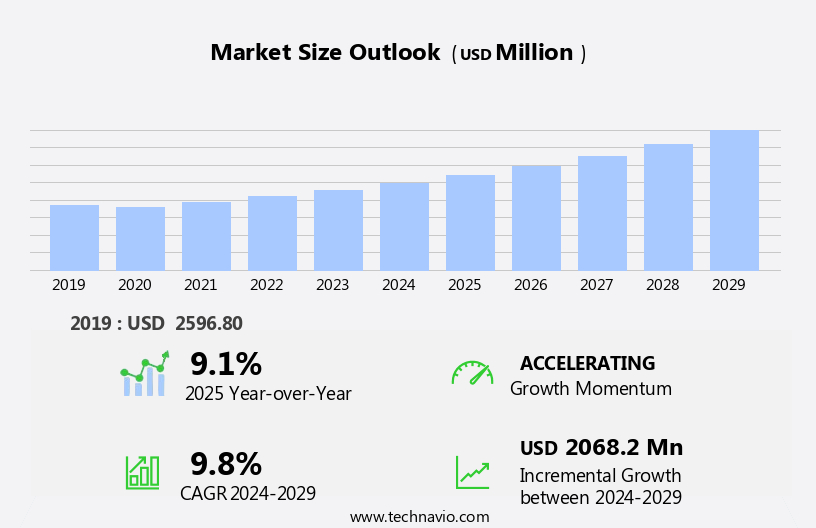
The jewelry appraisal market size is forecast to increase by USD 2.07 billion at a CAGR of 9.8% between 2024 and 2029.
- The market is experiencing significant growth, driven primarily by the increasing demand for jewelry appraisals for insurance purposes. This trend is particularly prominent in regions with high consumer disposable income and a strong cultural attachment to jewelry. Another key driver is the increasing adoption of blockchain technology in the jewelry industry. This innovation offers transparency and security, enabling consumers to verify the authenticity and origin of their jewelry, thereby increasing trust and confidence in the market. Additionally, advancements in synthetic gemstones and diamond simulants are expanding the market's reach and accessibility. These lab-grown alternatives offer affordability and sustainability, attracting a new customer base.
- However, challenges remain, including the need for industry standardization and regulation and the potential impact of economic downturns on consumer spending. Companies seeking to capitalize on market opportunities and navigate challenges effectively should focus on innovation, transparency, and customer education. By staying abreast of industry trends and consumer preferences, they can differentiate themselves and build long-term success in the market. The market encompasses the evaluation and valuation of precious jewelry, including diamonds, precious metals, and gemstones, for various purposes such as estate settlements, insurance coverage, divorce proceedings, and charitable donations.
What will the size of the jewelry appraisal market be during the forecast period?
- Advanced technologies, like computer-aided design and Artificial intelligence-assisted valuation, have revolutionized the appraisal process, enabling certified professionals to provide more accurate assessments based on material quality, historical significance, and extrinsic value. Online systems and virtual appraisal services have gained popularity, offering convenience and accessibility to consumers. Market value is determined by factors like carat weight, gemstone quality, and market fee.
- Consumer awareness and interest in jewelry investments have fueled the growth of this market, with licensed professionals utilizing high-tech equipment, such as digital magnifiers, to assess the intricacies of jewelry items. New materials and jewelry designs continue to emerge, requiring ongoing education and adaptation from appraisers. Consumers seek professional appraisals for tax deductions, fair marketplace costs, and to ensure the authenticity and value of their jewelry investments.
How is the Jewelry Appraisal Industry segmented?
The jewelry appraisal industry research report provides comprehensive data (region-wise segment analysis), with forecasts and estimates in "USD million" for the period 2025-2029, as well as historical data from 2019-2023 for the following segments.
- Type
- Offline appraisal
- Online appraisal
- Application
- Consultation
- Insurance
- Legal purposes
- Others
- End-User
- Individual Consumers
- Insurance Companies
- Jewelry Retail
- Geography
- North America
- US
- Canada
- Mexico
- Europe
- France
- Germany
- Italy
- Spain
- UK
- APAC
- China
- Japan
- South America
- Middle East and Africa
- North America
By Type Insights
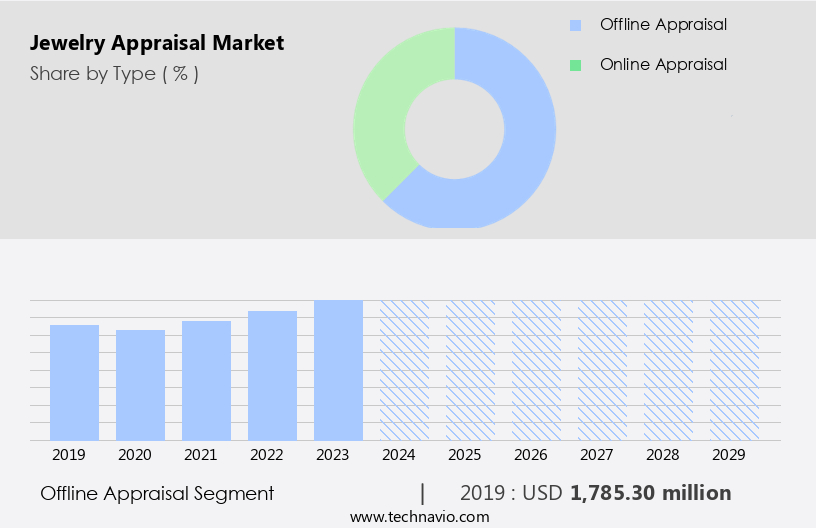
The offline appraisal segment is estimated to witness significant growth during the forecast period. The market encompasses various segments, including offline appraisal services, which are experiencing growth due to consumer preferences and the unique requirements of the jewelry industry. Offline appraisals offer a personal touch and expertise through in-person assessments, fostering trust and enabling a thorough examination of jewelry attributes, such as color, clarity, and cut. This hands-on approach enhances appraisal accuracy, which is essential for determining the intrinsic value of high-value jewelry items. Vintage and antique jewelry, popular among collectors, often requires specialized knowledge and expertise, making offline appraisals an attractive option. Furthermore, offline appraisals cater to estate planning, insurance, and authentication needs, ensuring the sustainability and preservation of jewelry pieces.
Jewelry blogs, magazines, and forums contribute to consumer education and transparency in the industry, while appraisers' qualifications, ethical standards, and advanced tools, such as CAD software and high-resolution imaging, ensure accurate valuation. The integration of blockchain technology for authentication and appraisal transparency further enhances the market's appeal.
Get a glance at the market report of share of various segments Request Free Sample
The Offline appraisal segment was valued at USD 1.79 billion in 2019 and showed a gradual increase during the forecast period.
Regional Analysis
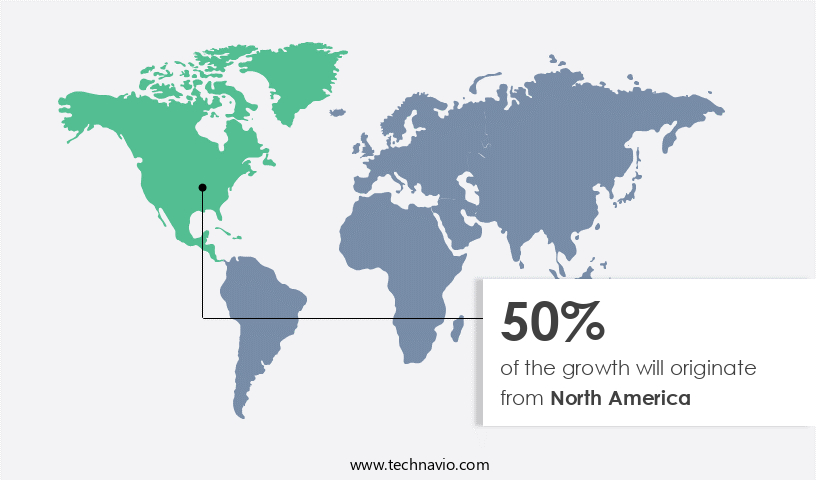
North America is estimated to contribute 50% to the growth of the global market during the forecast period. Technavio's analysts have elaborately explained the regional trends and drivers that shape the market during the forecast period.
For more insights on the market size of various regions, Request Free Sample
In North America, particularly in the US, the market for jewelry appraisals is substantial due to the high prevalence of valuable jewelry ownership. This includes engagement rings, heirloom pieces, and luxury jewelry. Accurate appraisals are essential for insurance coverage, resale, and estate planning. Jewelry holds intrinsic value beyond monetary worth, as it often carries cultural and sentimental significance in North American societies. The increasing recognition of jewelry as a valuable investment and part of a comprehensive wealth portfolio fuels the demand for appraisals. Vintage and antique jewelry are popular investment categories. Appraisals ensure consumers make informed purchasing decisions, authenticate pieces, and maintain the value of their collections.
Appraisers must possess qualifications and expertise in various areas, including jewelry styles, restoration, gemstone identification, and appraisal methodologies. Advanced technology, such as CAD software, high-resolution imaging, and digital appraisals, enhances the appraisal process. Jewelry sustainability, ethical considerations, and transparency are increasingly important factors influencing the market. Consumers and industry professionals engage in jewelry communities, blogs, forums, and magazines to discuss trends, share knowledge, and seek advice. Jewelry appraisal services offer various appraisal types, including insurance, estate, and collectibles appraisals. Appraisal reports provide detailed evaluations, including appraisal requirements, standardized appraisal methods, and insurance appraisal. Appraisals aid in tax purposes, conservation, and legal proceedings.
Jewelry buyers, wholesalers, and insurers rely on appraisals for accurate valuation and insurance coverage. Appraisal tools, such as gemological equipment and blockchain authentication, ensure appraisal accuracy and consumer trust.
Market Dynamics
Our researchers analyzed the data with 2024 as the base year, along with the key drivers, trends, and challenges. A holistic analysis of drivers will help companies refine their marketing strategies to gain a competitive advantage.
What are the key market drivers leading to the rise in the adoption of the Jewelry Appraisal Industry?
- Rising demand for insurance purposes of jewelry is the key driver of the market. The market holds significance in today's world due to the increasing recognition of the importance of accurate and professional appraisals for valuable jewelry pieces. This trend is driven by the heightened awareness of potential financial losses resulting from theft, loss, or damage. Insurance providers require detailed appraisals to determine the replacement value of jewelry items, ensuring that policyholders are adequately covered in case of unforeseen events. Appraisals that reflect the true market value and authenticity of the jewelry pieces establish the basis for insurance policies. In the event of unfortunate incidents, a valid appraisal expedites the claims process. Insurance companies rely on these reports to verify ownership, value, and damage, leading to quicker settlements and less hassle for policyholders.
- The necessity of jewelry appraisals extends beyond insurance purposes, as they provide an objective assessment of a jewelry piece's worth, ensuring that transactions are fair and transparent. Overall, the market is a vital component of the jewelry industry, ensuring that individuals and businesses can protect their valuable investments and make informed decisions.
What are the market trends shaping the Jewelry Appraisal Industry?
- Increasing adoption of blockchain technology for transparency is the upcoming market trend. The market is experiencing significant growth due to the integration of blockchain technology. This innovative solution enhances transparency throughout the jewelry supply chain by providing a secure and unalterable record of a gemstone's origin and production process. Consumers are increasingly seeking ethical and sustainable sourcing practices, making the transparency offered by blockchain technology an essential factor in the jewelry industry.
- By ensuring authenticity and origin, blockchain mitigates the risk of fraud and misrepresentation. As a result, the market is poised for continued expansion, with blockchain technology playing a pivotal role in driving growth and consumer confidence. Jewelry forums, magazines, and books provide valuable information on jewelry history, care, evaluation, and investment advice. Jewelry authentication is crucial for ensuring the authenticity and value of collectibles, antiques, and estate pieces. Appraisers must possess qualifications and adhere to ethical standards. Appraisal tools, reports, and certificates are essential for providing accurate and reliable appraisals. Appraisal services include legal appraisals, inheritance appraisals, estate appraisals, appraisals for collectibles, antiques, gemstones, and diamonds.
What challenges does the Jewelry Appraisal Industry face during its growth?
- Advancements in synthetic gemstones and diamond simulants are a key challenge affecting the industry's growth. The market faces significant challenges due to the advancement of high-quality synthetic gemstones and simulants. These stones closely mimic the appearance of natural diamonds and gemstones, making it increasingly difficult for appraisers to distinguish between the two without specialized testing. Traditional methods of visual inspection may no longer be sufficient, requiring the use of advanced gemological equipment for precise identification. For instance, some jewelry companies have adopted lab-grown diamonds created using advanced techniques such as High-Pressure High Temperature (HPHT) and Chemical Vapor Deposition (CVD).
- These methods replicate the natural diamond-growing process, offering high-quality, affordable alternatives to natural diamonds. However, the increasing prevalence of synthetic stones and simulants necessitates a higher level of expertise and technology in the jewelry appraisal industry to ensure accurate identification and verification of authenticity. Remote and digital appraisals have gained popularity in recent years, offering convenience and accessibility. Jewelry shows, exhibitions, and auctions provide opportunities for appraisers to showcase their expertise and connect with clients. Jewelry materials, such as metals and gemstones, require specific knowledge and expertise for accurate appraisals. The jewelry appraisal process involves careful inspection, research, and analysis to determine the value of a piece. The jewelry appraisal market is a dynamic and essential component of the jewelry industry, offering a range of services and expertise to meet the needs of collectors, retailers, and enthusiasts alike.
Exclusive Customer Landscape
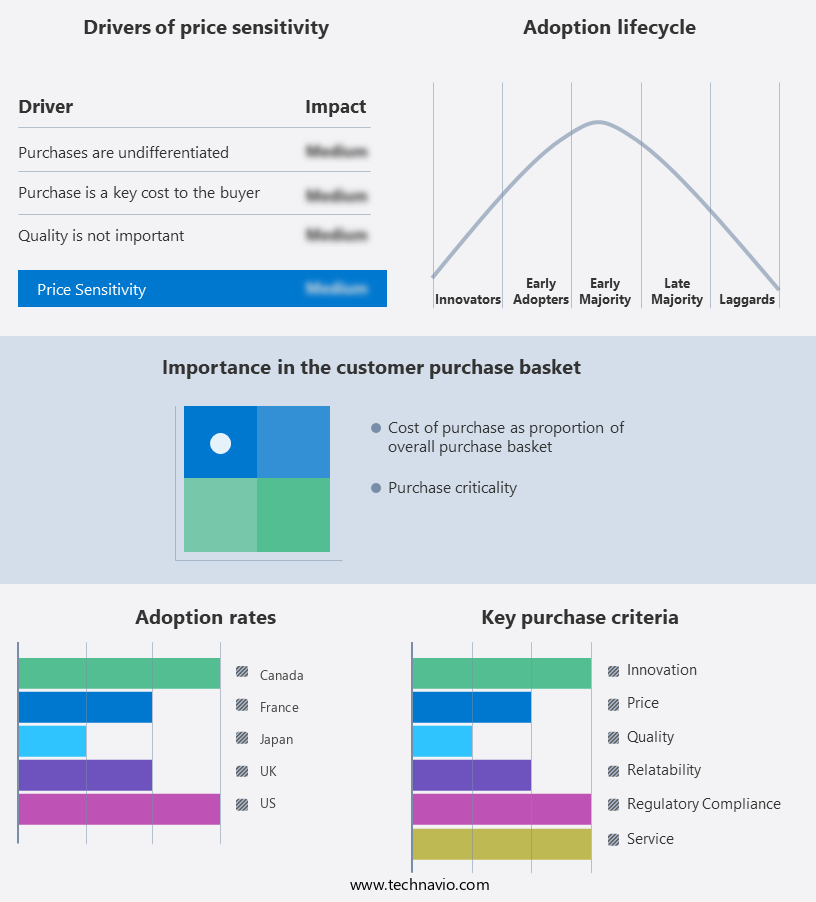
The jewelry appraisal market forecasting report includes the adoption lifecycle of the market, covering from the innovator's stage to the laggard's stage. It focuses on adoption rates in different regions based on penetration. Furthermore, the jewelry appraisal market report also includes key purchase criteria and drivers of price sensitivity to help companies evaluate and develop their market growth analysis strategies.
Customer Landscape
Key Companies & Market Insights
Companies are implementing various strategies, such as strategic alliances, jewelry appraisal market forecast, partnerships, mergers and acquisitions, geographical expansion, and product/service launches, to enhance their presence in the industry.
Casale Jewelers: The company offers jewelry appraisal, such as ring repair services. They also offer Clean and Polish, Engraving, Gemstone Replacement, Invisible Setting, and Prong Retipping.
The industry research and growth report includes detailed analyses of the competitive landscape of the market and information about key companies, including:
- A and A Gemological Laboratory
- Addeo Jewelers
- CIRCAJEWELS
- Gemological Appraisal Laboratory of America Inc.
- Gem Pro Appraisal Services LLC
- Global Appraisal Group
- J and M Jewelry
- Jewelry Appraisal Services
- LaBiche Jewelers
- Martin Jewelers
- Mearto IVS
- Noah Gabriel and Co. Jewelers
- Signet Jewelers Ltd.
- The Jewelry Appraiser Inc.
- Valuation Services UK Ltd.
- VALUEPROS APPRAISAL SERVICES
- WHITE PINE WHOLESALE LLC
- World Gemological Services
- Yantz Bradbury Associates
Qualitative and quantitative analysis of companies has been conducted to help clients understand the wider business environment as well as the strengths and weaknesses of key industry players. Data is qualitatively analyzed to categorize companies as pure play, category-focused, industry-focused, and diversified; it is quantitatively analyzed to categorize companies as dominant, leading, strong, tentative, and weak.
Research Analyst Overview
The market encompasses a diverse range of services and professionals dedicated to evaluating the worth of various jewelry pieces. This market caters to various segments, including vintage and antique jewelry, custom-designed pieces, and estate planning. Vintage and antique jewelry hold intrinsic value due to their historical significance and unique characteristics. Appraisers employ thorough examination techniques to assess the authenticity, condition, and materials used in these pieces. Thorough examination involves a detailed analysis of the jewelry's components, such as gemstones, precious metals, and craftsmanship. Jewelry blogs, forums, magazines, and communities serve as valuable resources for both consumers and professionals in the jewelry industry. The jewelry appraisal market is a vibrant and diverse sector that caters to the needs of jewelry retailers, wholesalers, collectors, and enthusiasts. This market encompasses various aspects of jewelry culture, including restoration, insurance, recycling, care, and authentication. Jewelry retailers and wholesalers rely on appraisals for inventory management, insurance coverage, and sales. Jewelry restoration and repair services require appraisals for assessing damage and estimating costs. Jewelry insurance companies use appraisals to determine coverage and value for policies.
These platforms provide insights into jewelry design trends, restoration techniques, and the latest appraisal methods. Jewelry sustainability is an increasingly important consideration in the appraisal market. Appraisers may assess the environmental impact of the materials used in jewelry production and the ethical implications of the sourcing and manufacturing processes. Appraisers' qualifications and expertise are crucial in the market. They must consider various jewelry styles, materials, and historical contexts. Advanced imaging technologies, such as high-resolution imaging and 3D technology, are essential tools for appraisers to accurately assess the intricacies of jewelry pieces.
The appraisal process requires a standardized approach to ensure accuracy and consumer trust. Appraisal reports provide detailed information about the jewelry piece, including its description, condition, and value. These reports may be required for insurance purposes, tax purposes, or estate planning. The market also caters to various specialized services, such as appraisals for conservation, legal purposes, and collectibles. Blockchain technology is increasingly being used for authentication, transparency, and security in the appraisal process. Jewelry appraisal services may also offer repair and restoration services to maintain the value and longevity of the jewelry pieces. Consumer trust is a critical factor in the market, and appraisers must adhere to ethical standards and provide accurate, unbiased appraisals.
In the jewelry investment market, appraisals play a crucial role in determining the value of luxury goods, such as diamonds, precious metals, and gemstones. Appraisal requirements may vary depending on the intended use of the appraisal report. The market is continually evolving, with advancements in technology and changing consumer preferences driving innovation and growth. Appraisers must stay updated on the latest trends and techniques to provide accurate, reliable, and comprehensive appraisals. In the world of online jewelry sales, the demand for precise appraisals has skyrocketed, especially as consumers with disposable incomes seek fine jewelry from licensed professionals. Gemological laboratories play a crucial role in ensuring the authenticity and value of these pieces, which is critical for insurance coverage and inheritance disputes. To maintain a fair marketplace cost, many businesses are now leveraging AI-assisted valuation and advanced appraisal techniques, offering a more efficient and accurate process. These innovations not only protect consumer interests but also provide an alternative fee structure that aligns with modern market expectations.
|
Market Scope |
|
|
Report Coverage |
Details |
|
Page number |
198 |
|
Base year |
2024 |
|
Historic period |
2019-2023 |
|
Forecast period |
2025-2029 |
|
Growth momentum & CAGR |
Accelerate at a CAGR of 9.8% |
|
Market growth 2025-2029 |
USD 2.06 billion |
|
Market structure |
Fragmented |
|
YoY growth 2024-2025(%) |
9.1 |
|
Key countries |
US, Canada, France, Japan, China, UK, Mexico, Germany, Italy, and Spain |
|
Competitive landscape |
Leading Companies, Market Positioning of Companies, Competitive Strategies, and Industry Risks |
What are the Key Data Covered in this Jewelry Appraisal Market Research and Growth Report?
- CAGR of the Jewelry Appraisal industry during the forecast period
- Detailed information on factors that will drive the growth and forecasting between 2025 and 2029
- Precise estimation of the size of the market and its contribution of the industry in focus to the parent market
- Accurate predictions about upcoming growth and trends and changes in consumer behaviour
- Growth of the market across North America, Europe, APAC, South America, and Middle East and Africa
- Thorough analysis of the market's competitive landscape and detailed information about companies
- Comprehensive analysis of factors that will challenge the jewelry appraisal market growth and forecasting
We can help! Our analysts can customize this jewelry appraisal market research report to meet your requirements.
 RIA -
RIA - 
