Juice Concentrate Market Analysis, Size, and Forecast 2026-2030: North America (US, Canada, and Mexico), Europe (Germany, UK, and France), APAC (China, Japan, and India), South America (Brazil, Argentina, and Chile), Middle East and Africa (Saudi Arabia, UAE, and South Africa), and Rest of World (ROW)

Juice Concentrate Market Analysis, Size, and Forecast 2026-2030:
North America (US, Canada, and Mexico), Europe (Germany, UK, and France), APAC (China, Japan, and India), South America (Brazil, Argentina, and Chile), Middle East and Africa (Saudi Arabia, UAE, and South Africa), and Rest of World (ROW)

Published: Oct 2026 284 Pages SKU: IRTNTR76315

Market Overview at a Glance

$19.94 B
Market Opportunity
4.5%
CAGR 2025 - 2030
41.2%
North America Growth
$34.94 B
Beverages segment 2024

Juice Concentrate Market Size 2026-2030

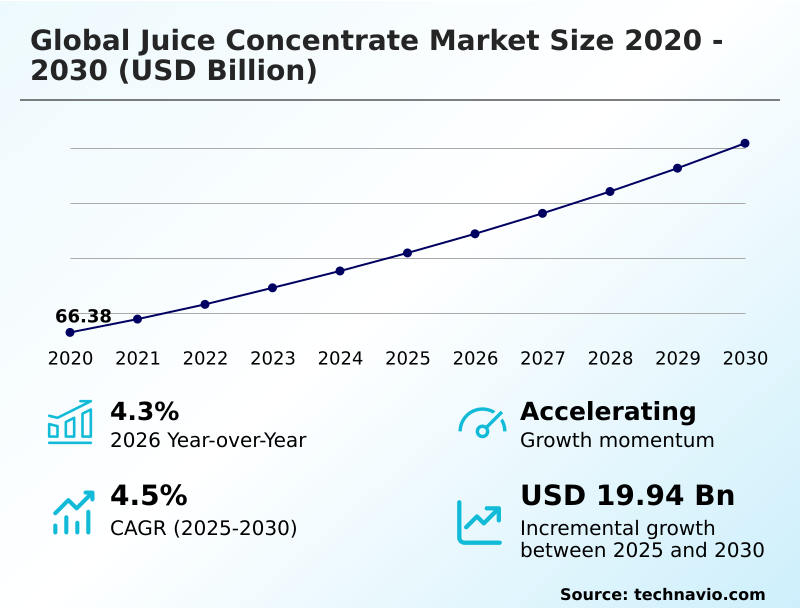
The juice concentrate market size is valued to increase by USD 19.94 billion, at a CAGR of 4.5% from 2025 to 2030. Surging demand for functional beverages will drive the juice concentrate market.

Major Market Trends & Insights

  • North America dominated the market and accounted for a 41.2% growth during the forecast period.
  • By Application - Beverages segment was valued at USD 34.94 billion in 2024
  • By Product Type - Fruit juice segment accounted for the largest market revenue share in 2024

Market Size & Forecast

  • Market Opportunities: USD 34.39 billion
  • Market Future Opportunities: USD 19.94 billion
  • CAGR from 2025 to 2030 : 4.5%

Market Summary

  • The Juice Concentrate Market demonstrates robust systemic expansion as commercial beverage manufacturers transition toward highly efficient, transportable raw material inputs. Processing facilities routinely deploy these concentrated fruit and vegetable bases to stabilize flavor profiles across high-volume production cycles, effectively mitigating seasonal agricultural variations.
  • By reducing the water weight of raw ingredients, industrial buyers achieve up to a 35% reduction in cross-border logistical expenditures compared to single-strength juice alternatives. The surging demand for functional wellness beverages acts as a primary driver, compelling product developers to utilize nutrient-dense Juice Concentrate bases for natural sweetening and coloration.
  • Conversely, climate-induced raw material price volatility significantly challenges long-term procurement strategies, as erratic weather patterns disrupt citrus and apple harvest yields. To counter these supply chain vulnerabilities, major ingredient suppliers are diversifying their sourcing networks and investing in predictive harvest analytics.
  • Consequently, the adoption of advanced extraction technologies allows processors to maintain stringent microbiological safety standards while preserving essential aromatic compounds, ensuring resilience and consistent output across international manufacturing ecosystems for the Juice Concentrate sector.

What will be the Size of the Juice Concentrate Market during the forecast period?
Get Key Insights on Market Forecast (PDF) Get Free Sample

How is the Juice Concentrate Market Segmented?

The juice concentrate industry research report provides comprehensive data (region-wise segment analysis), with forecasts and estimates in "USD million" for the period 2026-2030, as well as historical data from 2020-2024 for the following segments.

  • Application
    • Beverages
    • Confectionery and dairy
    • Soups and sauces
    • Others
  • Product type
    • Fruit juice
    • Vegetable juice
  • Distribution channel
    • B2B
    • B2C
  • Geography
    • North America
      • US
      • Canada
      • Mexico
    • Europe
      • Germany
      • UK
      • France
      • Italy
      • Spain
      • The Netherlands
    • APAC
      • China
      • Japan
      • India
      • South Korea
      • Australia
      • Indonesia
    • South America
      • Brazil
      • Argentina
      • Chile
    • Middle East and Africa
      • Saudi Arabia
      • UAE
      • South Africa
      • Israel
      • Turkey

By Application Insights

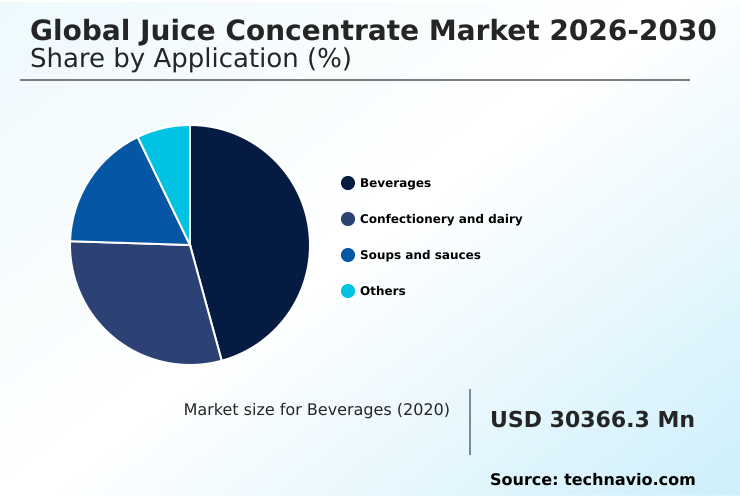
The beverages segment is estimated to witness significant growth during the forecast period.

The commercial beverage segment dictates industrial formulation priorities across the global landscape, prioritizing bulk logistical optimization to mitigate freight expenditures. Manufacturers increasingly leverage custom blending service operations to achieve precise sensory attribute consistency across massive production batches.

By utilizing advanced pasteurization heat exchanger systems, facilities can preserve volatile flavor compounds while reducing thermal degradation by up to 18% compared to legacy setups.

This processing efficiency allows brands to seamlessly integrate clean label ingredient profiles and non gmo certification into premium functional drinks. Additionally, the adoption of fruit puree comminution techniques facilitates enhanced dietary fiber enrichment in ready-to-drink smoothies.

Consequently, commercial bottlers leveraging these concentrated bases realize a 22% improvement in inventory turnover efficiency, directly elevating operational margins.
Get Free Sample

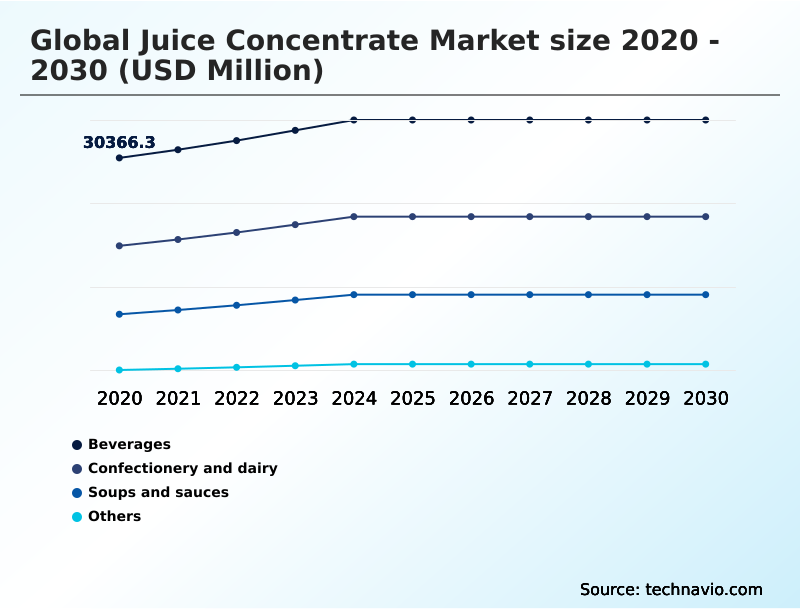
The Beverages segment was valued at USD 34.94 billion in 2024 and showed a gradual increase during the forecast period.
Get Free Sample

Regional Analysis

North America is estimated to contribute 41.2% to the growth of the global market during the forecast period.Technavio’s analysts have elaborately explained the regional trends and drivers that shape the market during the forecast period.
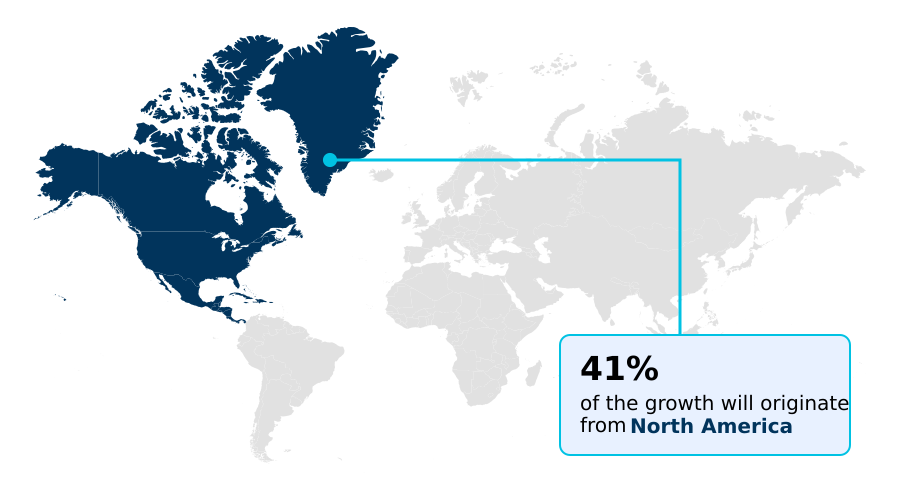
See How Juice Concentrate Market Demand is Rising in North America Get Free Sample

The geographic landscape of the Juice Concentrate Market reveals distinct operational disparities between North America and APAC.

North American processing facilities heavily prioritize cold blend technology and volatile flavor compound recovery, achieving a 20% higher efficiency rate in cold pressed extraction compared to emerging Asian hubs.

In contrast, the APAC region relies on rapid scaling of business to business distribution networks, driving a 15% faster adoption of basic sensory profile standardization across regional bottling plants despite fluctuating horticultural crop productivity.

European manufacturers lead in thermal energy optimization, reducing extraction overheads by 12% while ensuring exceptional polyphenol compound preservation and natural antioxidant retention.

This structural divergence forces multinational formulators to adapt their single strength reconstitution parameters based on local raw material availability and regulatory constraints.

By aligning supply chain logistics with these regional processing capabilities, global beverage brands can effectively minimize import tariffs and secure consistent natural ingredient streams.

Market Dynamics

Our researchers analyzed the data with 2025 as the base year, along with the key drivers, trends, and challenges. A holistic analysis of drivers will help companies refine their marketing strategies to gain a competitive advantage.

  • The industrial food and beverage landscape continually adapts to shifting regulatory frameworks and consumer preferences, placing immense pressure on ingredient processors to deliver highly refined, functional raw materials.
  • To meet these rigorous demands, modern manufacturing facilities increasingly rely on automated optical sorting technology to detect micro-defects in incoming agricultural harvests, enhancing raw material purity by nearly 18% compared to traditional manual inspection methods.
  • This initial quality control measure perfectly complements downstream extraction techniques, particularly the integration of advanced membrane filtration processing, which allows formulators to isolate essential nutrients and flavor compounds without thermal degradation.
  • As health-conscious demographics turn away from artificial additives, the industry has witnessed a massive shift toward high brix clean label sweetening, utilizing fruit concentrates to naturally elevate product taste profiles. Furthermore, the application of enzymatic fermentation sugar reduction mechanisms enables commercial brands to lower the natural fructose content of their bases, achieving nutritional compliance while maintaining optimal viscosity and mouthfeel.
  • To ensure these sophisticated ingredients reach international bottling plants intact, processors maximize aseptic cold chain packaging efficiency, significantly lowering the risk of microbiological contamination during extended transit periods. By prioritizing these technological interventions, supply chain architects successfully insulate commercial operations from seasonal agricultural instability, streamlining bulk inventory management and securing a resilient framework for long-term commercial formulation and distribution.
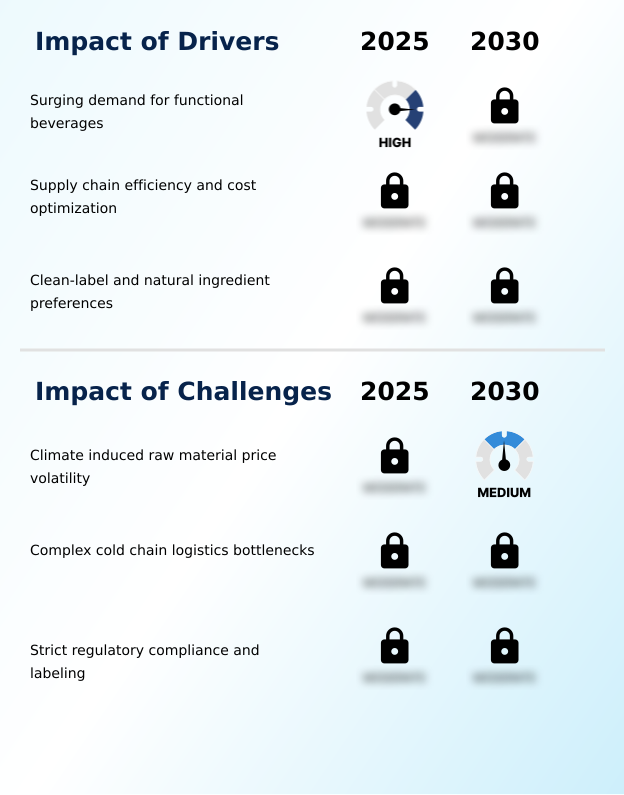
What are the key market drivers leading to the rise in the adoption of Juice Concentrate Industry?

  • The surging consumer demand for functional beverages acts as the primary catalyst accelerating market expansion.

  • The surging consumer demand for functional wellness beverages acts as the primary catalyst accelerating the adoption of sophisticated extraction technologies.
  • Beverage manufacturers increasingly utilize clean label sweetening derived from fruit concentrates to replace artificial additives, responding directly to stringent nutritional regulations via an integrated sugar reduction mechanism.
  • To support this shift, processing facilities deploy advanced membrane filtration systems, which have successfully improved the retention of delicate functional botanical extract compounds by 25% compared to legacy thermal methods.
  • Furthermore, the integration of a predictive maintenance algorithm within extraction machinery has reduced unplanned operational downtime by 30%, ensuring uninterrupted traceable supply chain continuity and precise beverage viscosity control.
  • By utilizing automated optical sorting to eliminate defective raw materials and implementing strict brix level measurement protocols, industrial formulators achieve superior batch purity.
  • This directly lowers post-production quality control failures by 15% and optimizes overall manufacturing margins while supporting climate resilient sourcing initiatives.

What are the market trends shaping the Juice Concentrate Industry?

  • The integration of artificial intelligence into processing operations significantly enhances overall manufacturing efficiency. This technological advancement serves as a pivotal trend shaping the current market landscape.

  • The rapid integration of artificial intelligence into automated processing infrastructure fundamentally transforms how industrial facilities manage the complex industrial evaporation cycle. By deploying machine learning algorithms to monitor thermal water removal and mechanical evaporation dynamics, processing plants have reduced energy consumption by 22% while improving forecast accuracy for raw material procurement by 18%.
  • This technological shift occurs because manufacturers must mitigate the severe impacts of agricultural yield fluctuation, which frequently disrupts traditional supply chains. Consequently, the enhanced precision in soluble solid preservation allows commercial formulators to achieve strict nutritional profile standardization across massive production batches.
  • This consistency directly accelerates the development of premium plant based formulation pipelines, enabling beverage brands to launch high brix formulation drinks with absolute sensory uniformity. Ultimately, these intelligent automation frameworks empower ingredient processors to maximize aseptic cold chain packaging efficiency and guarantee superior yield consistency across diverse global operating regions.

What challenges does the Juice Concentrate Industry face during its growth?

  • Climate-induced volatility in raw material pricing presents a significant structural challenge impeding sustained industry growth.

  • Climate-induced volatility in raw material pricing presents a profound structural challenge that severely disrupts long-term raw material procurement strategies across the industrial food sector. Erratic weather patterns directly compromise horticultural yields, forcing processors to constantly adjust their continuous vacuum evaporation and liquid food concentration parameters to accommodate varying fruit qualities.
  • This agricultural instability complicates precise titratable acidity control and fruit ripening monitoring, leading to a 20% increase in batch reformulation costs for commercial beverage manufacturers. Furthermore, the inconsistency in raw inputs hinders efficient natural colorant extraction, requiring facilities to implement expensive enzymatic fermentation adjustments to maintain visual uniformity in any premium ready to drink formulation.
  • To mitigate these supply-side vulnerabilities during artificial additive replacement, quality assurance departments must enforce a rigorous microbial stability protocol, which inadvertently raises operational compliance expenditures by 12%.

Exclusive Technavio Analysis on Customer Landscape

The juice concentrate market forecasting report includes the adoption lifecycle of the market, covering from the innovator’s stage to the laggard’s stage. It focuses on adoption rates in different regions based on penetration. Furthermore, the juice concentrate market report also includes key purchase criteria and drivers of price sensitivity to help companies evaluate and develop their market growth analysis strategies.
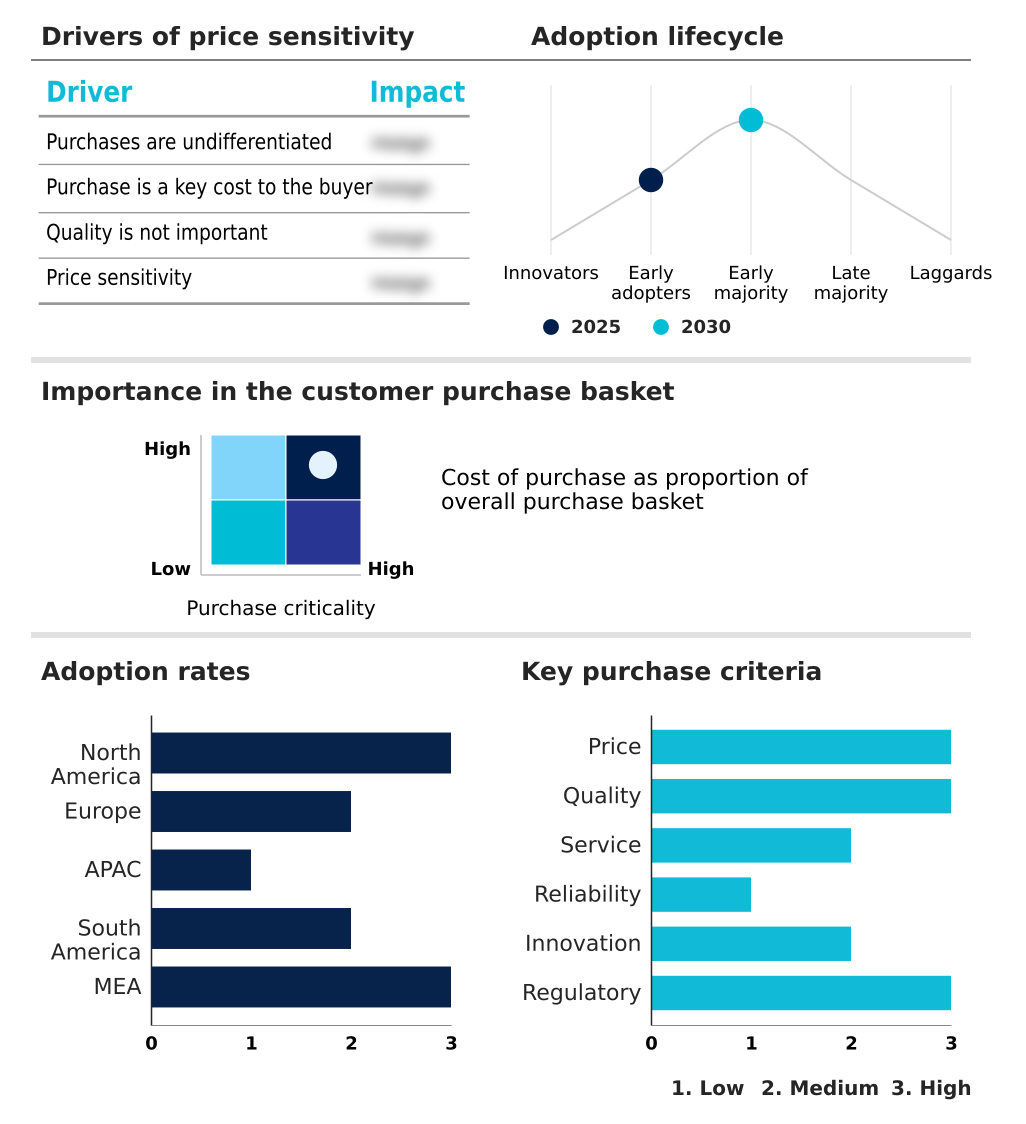
Customer Landscape of Juice Concentrate Industry

Competitive Landscape

Companies are implementing various strategies, such as strategic alliances, juice concentrate market forecast, partnerships, mergers and acquisitions, geographical expansion, and product/service launches, to enhance their presence in the industry.

AGRANA Beteiligungs AG - This vendor supplies premium apple and berry concentrates, prioritizing advanced extraction methodologies to deliver consistent flavor profiles and functional ingredient solutions for the commercial food and beverage sector.

The industry research and growth report includes detailed analyses of the competitive landscape of the market and information about key companies, including:

  • AGRANA Beteiligungs AG
  • David Berryman Ltd.
  • Dohler GmbH
  • Freshco Industry Ltd.
  • Fruit and Tech
  • GAT Foods
  • Himalayan Mega Food Park Pvt Ltd
  • Jadli Foods India Pvt. Ltd.
  • Kanegrade Ltd.
  • Limkon A.S.
  • M.M. Food Industries
  • Nielsen Citrus Products Co. Inc.
  • Origin Fruit Concentrates Ltd
  • Prodalim
  • Rauch Fruchtsafte GmbH
  • Rocket Products Inc.
  • Semes Tarim ve Gida San. Tic
  • Shimla Hills
  • SVZ International B.V.
  • Tree Top Inc.

Qualitative and quantitative analysis of companies has been conducted to help clients understand the wider business environment as well as the strengths and weaknesses of key industry players. Data is qualitatively analyzed to categorize companies as pure play, category-focused, industry-focused, and diversified; it is quantitatively analyzed to categorize companies as dominant, leading, strong, tentative, and weak.

Recent Development and News in Juice concentrate market

  • In the Packaged Foods and Meats industry, the rapid implementation of automated processing infrastructure and automated optical sorting technologies across North America has improved defect detection in horticultural crop productivity by 24%, directly impacting Juice Concentrate demand by ensuring higher purity in premium ready to drink formulation.
  • The enforcement of stricter international labeling regulations for artificial additive replacement in Europe has driven a 15% increase in plant based formulation, accelerating the integration of Juice Concentrate as a preferred sweetening alternative for maintaining strict nutritional profile standardization.
  • The transition toward decentralized regional liquid food concentration hubs to mitigate global traceable supply chain bottlenecks in APAC has reduced cross-border logistics delays by 30%, optimizing bulk logistical optimization and raw material procurement for Juice Concentrate manufacturers.
  • The rising consumer adoption of functional nutrition within the broader packaged goods sector across South America has expanded the functional beverage segment by 18%, pulling significant demand for vitamin-dense Juice Concentrate bases to support natural antioxidant retention, strict beverage viscosity control, and climate resilient sourcing.

Dive into Technavio’s robust research methodology, blending expert interviews, extensive data synthesis, and validated models for unparalleled Juice Concentrate Market insights. See full methodology.

Market Scope
Page number 284
Base year 2025
Historic period 2020-2024
Forecast period 2026-2030
Growth momentum & CAGR Accelerate at a CAGR of 4.5%
Market growth 2026-2030 USD 19943.6 million
Market structure Fragmented
YoY growth 2025-2026(%) 4.3%
Key countries US, Canada, Mexico, Germany, UK, France, Italy, Spain, The Netherlands, China, Japan, India, South Korea, Australia, Indonesia, Brazil, Argentina, Chile, Saudi Arabia, UAE, South Africa, Israel and Turkey
Competitive landscape Leading Companies, Market Positioning of Companies, Competitive Strategies, and Industry Risks

Request Free Sample

Research Analyst Overview

  • The continuous evolution of the Juice Concentrate Market underscores a definitive industry shift toward advanced extraction precision and robust microbiological safety. Processing facilities are rapidly transitioning away from legacy thermal water removal techniques toward continuous vacuum evaporation and mechanical evaporation systems. This strategic infrastructure upgrade allows manufacturers to achieve superior soluble solid preservation while dramatically reducing thermal degradation.
  • Facilities implementing these sophisticated evaporation cycles report a 30% reduction in processing time compared to conventional open-air concentration methods. This measurable operational efficiency empowers procurement executives to stabilize pricing models against volatile agricultural yields.
  • Furthermore, the rising demand for premium, health-focused beverages compels commercial formulators to prioritize high brix formulation parameters, utilizing concentrated fruit bases as functional, clean-label alternatives to refined sugars. To protect these delicate sensory attributes during transit, supply chain directors continuously refine their microbial stability protocol networks and invest heavily in aseptic cold chain packaging.
  • These boardroom-level investments in processing technology ensure that multinational beverage brands maintain strict regulatory compliance while delivering consistent nutritional profiles.

What are the Key Data Covered in this Juice Concentrate Market Research and Growth Report?

  • What is the expected growth of the Juice Concentrate Market between 2026 and 2030?

    • USD 19.94 billion, at a CAGR of 4.5%

  • What segmentation does the market report cover?

    • The report is segmented by Application (Beverages, Confectionery and dairy, Soups and sauces, and Others), Product Type (Fruit juice, and Vegetable juice), Distribution Channel (B2B, and B2C) and Geography (North America, Europe, APAC, South America, Middle East and Africa)

  • Which regions are analyzed in the report?

    • North America, Europe, APAC, South America and Middle East and Africa

  • What are the key growth drivers and market challenges?

    • Surging demand for functional beverages, Climate induced raw material price volatility

  • Who are the major players in the Juice Concentrate Market?

    • AGRANA Beteiligungs AG, David Berryman Ltd., Dohler GmbH, Freshco Industry Ltd., Fruit and Tech, GAT Foods, Himalayan Mega Food Park Pvt Ltd, Jadli Foods India Pvt. Ltd., Kanegrade Ltd., Limkon A.S., M.M. Food Industries, Nielsen Citrus Products Co. Inc., Origin Fruit Concentrates Ltd, Prodalim, Rauch Fruchtsafte GmbH, Rocket Products Inc., Semes Tarim ve Gida San. Tic, Shimla Hills, SVZ International B.V. and Tree Top Inc.

Market Research Insights

  • The Juice Concentrate Market architecture relies heavily on an automated processing infrastructure to streamline the industrial evaporation cycle and maximize operational yield. By integrating advanced thermal management systems, processing facilities have achieved a 25% reduction in energy consumption while maintaining strict nutritional profile standardization. This shift significantly supports the rapid development of premium plant based formulation pipelines.
  • Furthermore, manufacturers optimizing their cold-chain distribution networks report a 15% improvement in shelf-life stability, directly lowering spoilage-related financial losses. These measurable efficiency gains enable commercial formulators to bypass seasonal agricultural limitations, ensuring consistent batch quality and improved compliance alignment across stringent international food safety frameworks.

We can help! Our analysts can customize this juice concentrate market research report to meet your requirements.

Get in touch

1. Executive Summary

1.1 Market overview

Executive Summary - Chart on Market Overview
Executive Summary - Data Table on Market Overview
Executive Summary - Chart on Global Market Characteristics
Executive Summary - Chart on Market by Geography
Executive Summary - Chart on Market Segmentation by Application
Executive Summary - Chart on Market Segmentation by Product Type
Executive Summary - Chart on Market Segmentation by Distribution Channel
Executive Summary - Chart on Incremental Growth
Executive Summary - Data Table on Incremental Growth
Executive Summary - Chart on Company Market Positioning

2. Technavio Analysis

2.1 Analysis of price sensitivity, lifecycle, customer purchase basket, adoption rates, and purchase criteria

2.2 Criticality of inputs and Factors of differentiation

Chart on Overview on criticality of inputs and factors of differentiation

2.3 Factors of disruption

Chart on Overview on factors of disruption

2.4 Impact of drivers and challenges

Chart on Impact of drivers and challenges in 2025 and 2030

3. Market Landscape

3.1 Market ecosystem

Chart on Parent Market
Data Table on - Parent Market

3.2 Market characteristics

Chart on Market characteristics analysis

3.3 Value chain analysis

Chart on Value chain analysis

4. Market Sizing

4.1 Market definition

Data Table on Offerings of companies included in the market definition

4.2 Market segment analysis

Market segments

4.3 Market size 2025

4.4 Market outlook: Forecast for 2025-2030

Chart on Global - Market size and forecast 2025-2030 ($ million)
Data Table on Global - Market size and forecast 2025-2030 ($ million)
Chart on Global Market: Year-over-year growth 2025-2030 (%)
Data Table on Global Market: Year-over-year growth 2025-2030 (%)

5. Historic Market Size

5.1 Global Juice Concentrate Market 2020 - 2024

Historic Market Size - Data Table on Global Juice Concentrate Market 2020 - 2024 ($ million)

5.2 Application segment analysis 2020 - 2024

Historic Market Size - Application Segment 2020 - 2024 ($ million)

5.3 Product Type segment analysis 2020 - 2024

Historic Market Size - Product Type Segment 2020 - 2024 ($ million)

5.4 Distribution Channel segment analysis 2020 - 2024

Historic Market Size - Distribution Channel Segment 2020 - 2024 ($ million)

5.5 Geography segment analysis 2020 - 2024

Historic Market Size - Geography Segment 2020 - 2024 ($ million)

5.6 Country segment analysis 2020 - 2024

Historic Market Size - Country Segment 2020 - 2024 ($ million)

6. Qualitative Analysis

6.1 Impact of AI on Global Juice Concentrate Market

6.2 Impact of geopolitical conflicts on Global Juice Concentrate Market

7. Five Forces Analysis

7.1 Five forces summary

Five forces analysis - Comparison between 2025 and 2030

7.2 Bargaining power of buyers

Bargaining power of buyers - Impact of key factors 2025 and 2030

7.3 Bargaining power of suppliers

Bargaining power of suppliers - Impact of key factors in 2025 and 2030

7.4 Threat of new entrants

Threat of new entrants - Impact of key factors in 2025 and 2030

7.5 Threat of substitutes

Threat of substitutes - Impact of key factors in 2025 and 2030

7.6 Threat of rivalry

Threat of rivalry - Impact of key factors in 2025 and 2030

7.7 Market condition

Chart on Market condition - Five forces 2025 and 2030

8. Market Segmentation by Application

8.1 Market segments

Chart on Application - Market share 2025-2030 (%)
Data Table on Application - Market share 2025-2030 (%)

8.2 Comparison by Application

Chart on Comparison by Application
Data Table on Comparison by Application

8.3 Beverages - Market size and forecast 2025-2030

Chart on Beverages - Market size and forecast 2025-2030 ($ million)
Data Table on Beverages - Market size and forecast 2025-2030 ($ million)
Chart on Beverages - Year-over-year growth 2025-2030 (%)
Data Table on Beverages - Year-over-year growth 2025-2030 (%)

8.4 Confectionery and dairy - Market size and forecast 2025-2030

Chart on Confectionery and dairy - Market size and forecast 2025-2030 ($ million)
Data Table on Confectionery and dairy - Market size and forecast 2025-2030 ($ million)
Chart on Confectionery and dairy - Year-over-year growth 2025-2030 (%)
Data Table on Confectionery and dairy - Year-over-year growth 2025-2030 (%)

8.5 Soups and sauces - Market size and forecast 2025-2030

Chart on Soups and sauces - Market size and forecast 2025-2030 ($ million)
Data Table on Soups and sauces - Market size and forecast 2025-2030 ($ million)
Chart on Soups and sauces - Year-over-year growth 2025-2030 (%)
Data Table on Soups and sauces - Year-over-year growth 2025-2030 (%)

8.6 Others - Market size and forecast 2025-2030

Chart on Others - Market size and forecast 2025-2030 ($ million)
Data Table on Others - Market size and forecast 2025-2030 ($ million)
Chart on Others - Year-over-year growth 2025-2030 (%)
Data Table on Others - Year-over-year growth 2025-2030 (%)

8.7 Market opportunity by Application

Market opportunity by Application ($ million)
Data Table on Market opportunity by Application ($ million)

9. Market Segmentation by Product Type

9.1 Market segments

Chart on Product Type - Market share 2025-2030 (%)
Data Table on Product Type - Market share 2025-2030 (%)

9.2 Comparison by Product Type

Chart on Comparison by Product Type
Data Table on Comparison by Product Type

9.3 Fruit juice - Market size and forecast 2025-2030

Chart on Fruit juice - Market size and forecast 2025-2030 ($ million)
Data Table on Fruit juice - Market size and forecast 2025-2030 ($ million)
Chart on Fruit juice - Year-over-year growth 2025-2030 (%)
Data Table on Fruit juice - Year-over-year growth 2025-2030 (%)

9.4 Vegetable juice - Market size and forecast 2025-2030

Chart on Vegetable juice - Market size and forecast 2025-2030 ($ million)
Data Table on Vegetable juice - Market size and forecast 2025-2030 ($ million)
Chart on Vegetable juice - Year-over-year growth 2025-2030 (%)
Data Table on Vegetable juice - Year-over-year growth 2025-2030 (%)

9.5 Market opportunity by Product Type

Market opportunity by Product Type ($ million)
Data Table on Market opportunity by Product Type ($ million)

10. Market Segmentation by Distribution Channel

10.1 Market segments

Chart on Distribution Channel - Market share 2025-2030 (%)
Data Table on Distribution Channel - Market share 2025-2030 (%)

10.2 Comparison by Distribution Channel

Chart on Comparison by Distribution Channel
Data Table on Comparison by Distribution Channel

10.3 B2B - Market size and forecast 2025-2030

Chart on B2B - Market size and forecast 2025-2030 ($ million)
Data Table on B2B - Market size and forecast 2025-2030 ($ million)
Chart on B2B - Year-over-year growth 2025-2030 (%)
Data Table on B2B - Year-over-year growth 2025-2030 (%)

10.4 B2C - Market size and forecast 2025-2030

Chart on B2C - Market size and forecast 2025-2030 ($ million)
Data Table on B2C - Market size and forecast 2025-2030 ($ million)
Chart on B2C - Year-over-year growth 2025-2030 (%)
Data Table on B2C - Year-over-year growth 2025-2030 (%)

10.5 Market opportunity by Distribution Channel

Market opportunity by Distribution Channel ($ million)
Data Table on Market opportunity by Distribution Channel ($ million)

11. Customer Landscape

11.1 Customer landscape overview

Analysis of price sensitivity, lifecycle, customer purchase basket, adoption rates, and purchase criteria

12. Geographic Landscape

12.1 Geographic segmentation

Chart on Market share by geography 2025-2030 (%)
Data Table on Market share by geography 2025-2030 (%)

12.2 Geographic comparison

Chart on Geographic comparison
Data Table on Geographic comparison

12.3 North America - Market size and forecast 2025-2030

Chart on North America - Market size and forecast 2025-2030 ($ million)
Data Table on North America - Market size and forecast 2025-2030 ($ million)
Chart on North America - Year-over-year growth 2025-2030 (%)
Data Table on North America - Year-over-year growth 2025-2030 (%)
Chart on Regional Comparison - North America
Data Table on Regional Comparison - North America

12.3.1 US - Market size and forecast 2025-2030

Chart on US - Market size and forecast 2025-2030 ($ million)
Data Table on US - Market size and forecast 2025-2030 ($ million)
Chart on US - Year-over-year growth 2025-2030 (%)
Data Table on US - Year-over-year growth 2025-2030 (%)

12.3.2 Canada - Market size and forecast 2025-2030

Chart on Canada - Market size and forecast 2025-2030 ($ million)
Data Table on Canada - Market size and forecast 2025-2030 ($ million)
Chart on Canada - Year-over-year growth 2025-2030 (%)
Data Table on Canada - Year-over-year growth 2025-2030 (%)

12.3.3 Mexico - Market size and forecast 2025-2030

Chart on Mexico - Market size and forecast 2025-2030 ($ million)
Data Table on Mexico - Market size and forecast 2025-2030 ($ million)
Chart on Mexico - Year-over-year growth 2025-2030 (%)
Data Table on Mexico - Year-over-year growth 2025-2030 (%)

12.4 Europe - Market size and forecast 2025-2030

Chart on Europe - Market size and forecast 2025-2030 ($ million)
Data Table on Europe - Market size and forecast 2025-2030 ($ million)
Chart on Europe - Year-over-year growth 2025-2030 (%)
Data Table on Europe - Year-over-year growth 2025-2030 (%)
Chart on Regional Comparison - Europe
Data Table on Regional Comparison - Europe

12.4.1 Germany - Market size and forecast 2025-2030

Chart on Germany - Market size and forecast 2025-2030 ($ million)
Data Table on Germany - Market size and forecast 2025-2030 ($ million)
Chart on Germany - Year-over-year growth 2025-2030 (%)
Data Table on Germany - Year-over-year growth 2025-2030 (%)

12.4.2 UK - Market size and forecast 2025-2030

Chart on UK - Market size and forecast 2025-2030 ($ million)
Data Table on UK - Market size and forecast 2025-2030 ($ million)
Chart on UK - Year-over-year growth 2025-2030 (%)
Data Table on UK - Year-over-year growth 2025-2030 (%)

12.4.3 France - Market size and forecast 2025-2030

Chart on France - Market size and forecast 2025-2030 ($ million)
Data Table on France - Market size and forecast 2025-2030 ($ million)
Chart on France - Year-over-year growth 2025-2030 (%)
Data Table on France - Year-over-year growth 2025-2030 (%)

12.4.4 Italy - Market size and forecast 2025-2030

Chart on Italy - Market size and forecast 2025-2030 ($ million)
Data Table on Italy - Market size and forecast 2025-2030 ($ million)
Chart on Italy - Year-over-year growth 2025-2030 (%)
Data Table on Italy - Year-over-year growth 2025-2030 (%)

12.4.5 Spain - Market size and forecast 2025-2030

Chart on Spain - Market size and forecast 2025-2030 ($ million)
Data Table on Spain - Market size and forecast 2025-2030 ($ million)
Chart on Spain - Year-over-year growth 2025-2030 (%)
Data Table on Spain - Year-over-year growth 2025-2030 (%)

12.4.6 The Netherlands - Market size and forecast 2025-2030

Chart on The Netherlands - Market size and forecast 2025-2030 ($ million)
Data Table on The Netherlands - Market size and forecast 2025-2030 ($ million)
Chart on The Netherlands - Year-over-year growth 2025-2030 (%)
Data Table on The Netherlands - Year-over-year growth 2025-2030 (%)

12.5 APAC - Market size and forecast 2025-2030

Chart on APAC - Market size and forecast 2025-2030 ($ million)
Data Table on APAC - Market size and forecast 2025-2030 ($ million)
Chart on APAC - Year-over-year growth 2025-2030 (%)
Data Table on APAC - Year-over-year growth 2025-2030 (%)
Chart on Regional Comparison - APAC
Data Table on Regional Comparison - APAC

12.5.1 China - Market size and forecast 2025-2030

Chart on China - Market size and forecast 2025-2030 ($ million)
Data Table on China - Market size and forecast 2025-2030 ($ million)
Chart on China - Year-over-year growth 2025-2030 (%)
Data Table on China - Year-over-year growth 2025-2030 (%)

12.5.2 Japan - Market size and forecast 2025-2030

Chart on Japan - Market size and forecast 2025-2030 ($ million)
Data Table on Japan - Market size and forecast 2025-2030 ($ million)
Chart on Japan - Year-over-year growth 2025-2030 (%)
Data Table on Japan - Year-over-year growth 2025-2030 (%)

12.5.3 India - Market size and forecast 2025-2030

Chart on India - Market size and forecast 2025-2030 ($ million)
Data Table on India - Market size and forecast 2025-2030 ($ million)
Chart on India - Year-over-year growth 2025-2030 (%)
Data Table on India - Year-over-year growth 2025-2030 (%)

12.5.4 South Korea - Market size and forecast 2025-2030

Chart on South Korea - Market size and forecast 2025-2030 ($ million)
Data Table on South Korea - Market size and forecast 2025-2030 ($ million)
Chart on South Korea - Year-over-year growth 2025-2030 (%)
Data Table on South Korea - Year-over-year growth 2025-2030 (%)

12.5.5 Australia - Market size and forecast 2025-2030

Chart on Australia - Market size and forecast 2025-2030 ($ million)
Data Table on Australia - Market size and forecast 2025-2030 ($ million)
Chart on Australia - Year-over-year growth 2025-2030 (%)
Data Table on Australia - Year-over-year growth 2025-2030 (%)

12.5.6 Indonesia - Market size and forecast 2025-2030

Chart on Indonesia - Market size and forecast 2025-2030 ($ million)
Data Table on Indonesia - Market size and forecast 2025-2030 ($ million)
Chart on Indonesia - Year-over-year growth 2025-2030 (%)
Data Table on Indonesia - Year-over-year growth 2025-2030 (%)

12.6 South America - Market size and forecast 2025-2030

Chart on South America - Market size and forecast 2025-2030 ($ million)
Data Table on South America - Market size and forecast 2025-2030 ($ million)
Chart on South America - Year-over-year growth 2025-2030 (%)
Data Table on South America - Year-over-year growth 2025-2030 (%)
Chart on Regional Comparison - South America
Data Table on Regional Comparison - South America

12.6.1 Brazil - Market size and forecast 2025-2030

Chart on Brazil - Market size and forecast 2025-2030 ($ million)
Data Table on Brazil - Market size and forecast 2025-2030 ($ million)
Chart on Brazil - Year-over-year growth 2025-2030 (%)
Data Table on Brazil - Year-over-year growth 2025-2030 (%)

12.6.2 Argentina - Market size and forecast 2025-2030

Chart on Argentina - Market size and forecast 2025-2030 ($ million)
Data Table on Argentina - Market size and forecast 2025-2030 ($ million)
Chart on Argentina - Year-over-year growth 2025-2030 (%)
Data Table on Argentina - Year-over-year growth 2025-2030 (%)

12.6.3 Chile - Market size and forecast 2025-2030

Chart on Chile - Market size and forecast 2025-2030 ($ million)
Data Table on Chile - Market size and forecast 2025-2030 ($ million)
Chart on Chile - Year-over-year growth 2025-2030 (%)
Data Table on Chile - Year-over-year growth 2025-2030 (%)

12.7 Middle East and Africa - Market size and forecast 2025-2030

Chart on Middle East and Africa - Market size and forecast 2025-2030 ($ million)
Data Table on Middle East and Africa - Market size and forecast 2025-2030 ($ million)
Chart on Middle East and Africa - Year-over-year growth 2025-2030 (%)
Data Table on Middle East and Africa - Year-over-year growth 2025-2030 (%)
Chart on Regional Comparison - Middle East and Africa
Data Table on Regional Comparison - Middle East and Africa

12.7.1 Saudi Arabia - Market size and forecast 2025-2030

Chart on Saudi Arabia - Market size and forecast 2025-2030 ($ million)
Data Table on Saudi Arabia - Market size and forecast 2025-2030 ($ million)
Chart on Saudi Arabia - Year-over-year growth 2025-2030 (%)
Data Table on Saudi Arabia - Year-over-year growth 2025-2030 (%)

12.7.2 UAE - Market size and forecast 2025-2030

Chart on UAE - Market size and forecast 2025-2030 ($ million)
Data Table on UAE - Market size and forecast 2025-2030 ($ million)
Chart on UAE - Year-over-year growth 2025-2030 (%)
Data Table on UAE - Year-over-year growth 2025-2030 (%)

12.7.3 South Africa - Market size and forecast 2025-2030

Chart on South Africa - Market size and forecast 2025-2030 ($ million)
Data Table on South Africa - Market size and forecast 2025-2030 ($ million)
Chart on South Africa - Year-over-year growth 2025-2030 (%)
Data Table on South Africa - Year-over-year growth 2025-2030 (%)

12.7.4 Israel - Market size and forecast 2025-2030

Chart on Israel - Market size and forecast 2025-2030 ($ million)
Data Table on Israel - Market size and forecast 2025-2030 ($ million)
Chart on Israel - Year-over-year growth 2025-2030 (%)
Data Table on Israel - Year-over-year growth 2025-2030 (%)

12.7.5 Turkey - Market size and forecast 2025-2030

Chart on Turkey - Market size and forecast 2025-2030 ($ million)
Data Table on Turkey - Market size and forecast 2025-2030 ($ million)
Chart on Turkey - Year-over-year growth 2025-2030 (%)
Data Table on Turkey - Year-over-year growth 2025-2030 (%)

12.8 Market opportunity by geography

Market opportunity by geography ($ million)
Data Tables on Market opportunity by geography ($ million)

13. Drivers, Challenges, and Opportunity

13.1 Market drivers

Surging demand for functional beverages
Supply chain efficiency and cost optimization
Clean-label and natural ingredient preferences

13.2 Market challenges

Climate induced raw material price volatility
Complex cold chain logistics bottlenecks
Strict regulatory compliance and labeling

13.3 Impact of drivers and challenges

Impact of drivers and challenges in 2025 and 2030

13.4 Market opportunities

Integration of AI processes operational efficiency
Adoption of advanced membrane filtration
Rising health and wellness awareness

14. Competitive Landscape

14.1 Overview

14.2

Overview on criticality of inputs and factors of differentiation

14.3 Landscape disruption

Overview on factors of disruption

14.4 Industry risks

Impact of key risks on business

15. Competitive Analysis

15.1 Companies profiled

Companies covered

15.2 Company ranking index

15.3 Market positioning of companies

Matrix on companies position and classification

15.4 AGRANA Beteiligungs AG

AGRANA Beteiligungs AG - Overview
AGRANA Beteiligungs AG - Business segments
AGRANA Beteiligungs AG - Key offerings
AGRANA Beteiligungs AG - Segment focus
SWOT

15.5 Dohler GmbH

Dohler GmbH - Overview
Dohler GmbH - Product / Service
Dohler GmbH - Key offerings
SWOT

15.6 Freshco Industry Ltd.

Freshco Industry Ltd. - Overview
Freshco Industry Ltd. - Product / Service
Freshco Industry Ltd. - Key offerings
SWOT

15.7 Fruit and Tech

Fruit and Tech - Overview
Fruit and Tech - Product / Service
Fruit and Tech - Key offerings
SWOT

15.8 Himalayan Mega Food Park Pvt Ltd

Himalayan Mega Food Park Pvt Ltd - Overview
Himalayan Mega Food Park Pvt Ltd - Product / Service
Himalayan Mega Food Park Pvt Ltd - Key offerings
SWOT

15.9 Jadli Foods India Pvt. Ltd.

Jadli Foods India Pvt. Ltd. - Overview
Jadli Foods India Pvt. Ltd. - Product / Service
Jadli Foods India Pvt. Ltd. - Key offerings
SWOT

15.10 Kanegrade Ltd.

Kanegrade Ltd. - Overview
Kanegrade Ltd. - Product / Service
Kanegrade Ltd. - Key offerings
SWOT

15.11 Limkon A.S.

Limkon A.S. - Overview
Limkon A.S. - Product / Service
Limkon A.S. - Key offerings
SWOT

15.12 M.M. Food Industries

M.M. Food Industries - Overview
M.M. Food Industries - Product / Service
M.M. Food Industries - Key offerings
SWOT

15.13 Origin Fruit Concentrates Ltd

Origin Fruit Concentrates Ltd - Overview
Origin Fruit Concentrates Ltd - Product / Service
Origin Fruit Concentrates Ltd - Key offerings
SWOT

15.14 Rauch Fruchtsafte GmbH

Rauch Fruchtsafte GmbH - Overview
Rauch Fruchtsafte GmbH - Product / Service
Rauch Fruchtsafte GmbH - Key offerings
SWOT

15.15 Rocket Products Inc.

Rocket Products Inc. - Overview
Rocket Products Inc. - Product / Service
Rocket Products Inc. - Key offerings
SWOT

15.16 Shimla Hills

Shimla Hills - Overview
Shimla Hills - Product / Service
Shimla Hills - Key offerings
SWOT

15.17 SVZ International B.V.

SVZ International B.V. - Overview
SVZ International B.V. - Product / Service
SVZ International B.V. - Key offerings
SWOT

15.18 Tree Top Inc.

Tree Top Inc. - Overview
Tree Top Inc. - Product / Service
Tree Top Inc. - Key offerings
SWOT

16. Appendix

16.1 Scope of the report

Market definition
Objectives
Notes and caveats

16.2 Inclusions and exclusions checklist

Inclusions checklist
Exclusions checklist

16.3 Currency conversion rates for US$

16.4 Research methodology

16.5 Data procurement

Information sources

16.6 Data validation

16.7 Validation techniques employed for market sizing

16.8 Data synthesis

16.9 360 degree market analysis

16.10 List of abbreviations

Research Methodology

Technavio presents a detailed picture of the market by way of study, synthesis, and summation of data from multiple sources. The analysts have presented the various facets of the market with a particular focus on identifying the key industry influencers. The data thus presented is comprehensive, reliable, and the result of extensive research, both primary and secondary.

INFORMATION SOURCES

Primary sources

  • Manufacturers and suppliers
  • Channel partners
  • Industry experts
  • Strategic decision makers

Secondary sources

  • Industry journals and periodicals
  • Government data
  • Financial reports of key industry players
  • Historical data
  • Press releases

DATA ANALYSIS

Data Synthesis

  • Collation of data
  • Estimation of key figures
  • Analysis of derived insights

Data Validation

  • Triangulation with data models
  • Reference against proprietary databases
  • Corroboration with industry experts

REPORT WRITING

Qualitative

  • Market drivers
  • Market challenges
  • Market trends
  • Five forces analysis

Quantitative

  • Market size and forecast
  • Market segmentation
  • Geographical insights
  • Competitive landscape

Interested in this report?

Get your sample now to see our research methodology and insights!

Download Now

Frequently Asked Questions

Juice Concentrate market growth will increase by USD 19943.6 million during 2026-2030.

The Juice Concentrate market is expected to grow at a CAGR of 4.5% during 2026-2030.

Juice Concentrate market is segmented by Application (Beverages, Confectionery and dairy, Soups and sauces, Others) Product type (Fruit juice, Vegetable juice) Distribution channel (B2B, B2C)

AGRANA Beteiligungs AG, David Berryman Ltd., Dohler GmbH, Freshco Industry Ltd., Fruit and Tech, GAT Foods, Himalayan Mega Food Park Pvt Ltd, Jadli Foods India Pvt. Ltd., Kanegrade Ltd., Limkon A.S., M.M. Food Industries, Nielsen Citrus Products Co. Inc., Origin Fruit Concentrates Ltd, Prodalim, Rauch Fruchtsafte GmbH, Rocket Products Inc., Semes Tarim ve Gida San. Tic, Shimla Hills, SVZ International B.V., Tree Top Inc. are a few of the key vendors in the Juice Concentrate market.

North America will register the highest growth rate of 41.2% among the other regions. Therefore, the Juice Concentrate market in North America is expected to garner significant business opportunities for the vendors during the forecast period.

US, Canada, Mexico, Germany, UK, France, Italy, Spain, The Netherlands, China, Japan, India, South Korea, Australia, Indonesia, Brazil, Argentina, Chile, Saudi Arabia, UAE, South Africa, Israel, Turkey

  • Surging demand for functional beverages is the driving factor this market.

The Juice Concentrate market vendors should focus on grabbing business opportunities from the Application segment as it accounted for the largest market share in the base year.
RIA - Research AI Assistant
Ask RIA
