Functional Drinks Market Analysis, Size, and Forecast 2026-2030: APAC (China, Japan, and India), North America (US, Canada, and Mexico), Europe (Germany, UK, and France), South America (Brazil, Argentina, and Colombia), Middle East and Africa (UAE, Saudi Arabia, and South Africa), and Rest of World (ROW)

Functional Drinks Market Analysis, Size, and Forecast 2026-2030:
APAC (China, Japan, and India), North America (US, Canada, and Mexico), Europe (Germany, UK, and France), South America (Brazil, Argentina, and Colombia), Middle East and Africa (UAE, Saudi Arabia, and South Africa), and Rest of World (ROW)

Published: Mar 2026 315 Pages SKU: IRTNTR41482

Market Overview at a Glance

$95.5 B
Market Opportunity
10.5%
CAGR 2025 - 2030
41.3%
APAC Growth
$44.5 B
Energy beverages segment 2024

Functional Drinks Market Size 2026-2030

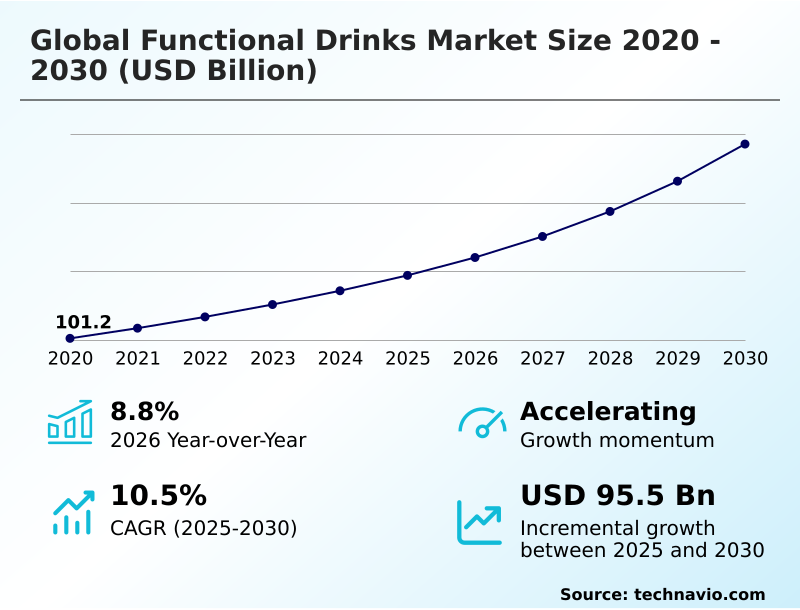
The functional drinks market size is valued to increase by USD 95.5 billion, at a CAGR of 10.5% from 2025 to 2030. Escalating consumer health consciousness and proactive wellness management will drive the functional drinks market.

Major Market Trends & Insights

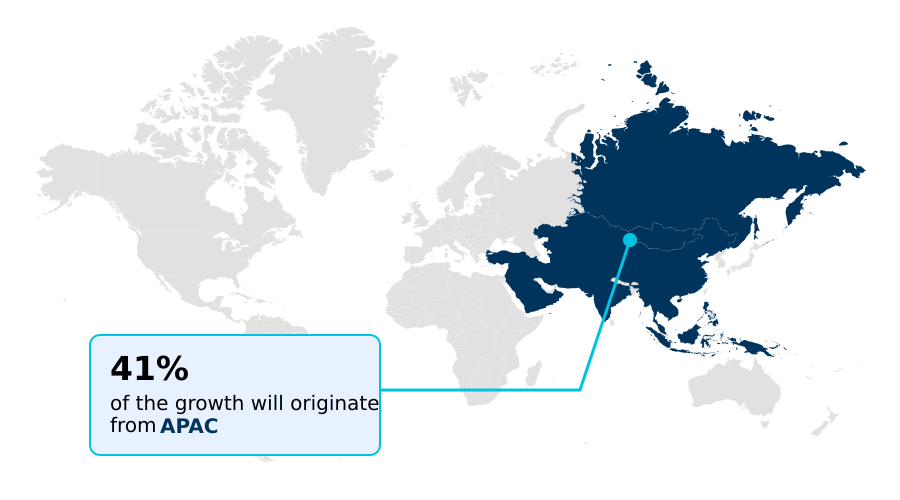
  • APAC dominated the market and accounted for a 41.3% growth during the forecast period.
  • By Product - Energy beverages segment was valued at USD 44.5 billion in 2024
  • By Application - Health and wellness segment accounted for the largest market revenue share in 2024

Market Size & Forecast

  • Market Opportunities: USD 141.3 billion
  • Market Future Opportunities: USD 95.5 billion
  • CAGR from 2025 to 2030 : 10.5%

Market Summary

  • The functional drinks market is expanding as consumers increasingly seek proactive wellness solutions. This shift moves beyond basic hydration, creating demand for beverages formulated with bioactive ingredients and botanical extracts that offer specific benefits. The market sees continuous innovation, with a focus on cognitive enhancers, immune-boosting ingredients, and products that support digestive health support.
  • A key business scenario involves balancing formulation complexity with commercial viability. For instance, developing meal replacement drinks with a clean-label formulation requires significant R&D investment to mask the taste of certain plant-based proteins and dietary fibers while keeping the final product affordable. Navigating this efficacy-taste-cost trilemma is crucial for capturing consumer loyalty.
  • Furthermore, the regulatory environment for health claims necessitates careful marketing strategies, forcing companies to invest in clinical substantiation to build brand trust and differentiate their offerings in a crowded marketplace, thereby influencing product development cycles in the functional drinks market.

What will be the Size of the Functional Drinks Market during the forecast period?

Get Key Insights on Market Forecast (PDF) Request Free Sample

How is the Functional Drinks Market Segmented?

The functional drinks industry research report provides comprehensive data (region-wise segment analysis), with forecasts and estimates in "USD billion" for the period 2026-2030, as well as historical data from 2020-2024 for the following segments.

  • Product
    • Energy beverages
    • Functional fruit and vegetable juices
    • Sports beverages
    • Prebiotic and probiotic drinks
    • Others
  • Application
    • Health and wellness
    • Weight loss
  • Distribution channel
    • Supermarkets and hypermarkets
    • Online retail
    • Convenience stores
    • Food service
    • Gyms and fitness centers
  • Geography
    • APAC
      • China
      • Japan
      • India
    • North America
      • US
      • Canada
      • Mexico
    • Europe
      • Germany
      • UK
      • France
    • South America
      • Brazil
      • Argentina
      • Colombia
    • Middle East and Africa
      • UAE
      • Saudi Arabia
      • South Africa
    • Rest of World (ROW)

By Product Insights

The energy beverages segment is estimated to witness significant growth during the forecast period.

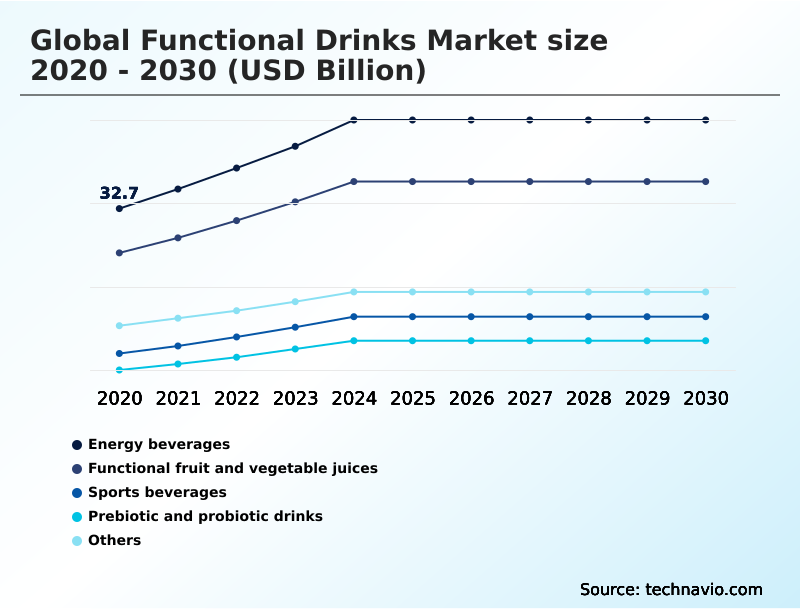
The functional drinks market is segmented by product, including energy beverages, functional fruit and vegetable juices, sports beverages, prebiotic and probiotic drinks, and others.

The energy beverages segment is evolving beyond traditional stimulants, with a growing consumer preference for natural energy drinks and clean energy solutions.

This shift reflects a broader trend toward proactive health management and holistic health solutions, where consumers seek convenient nutrition on-the-go. Manufacturers are focusing on clean-label formulation, incorporating bioactive ingredients to offer benefits aligned with personalized nutrition beverages.

This strategic pivot is critical, as the APAC region alone accounts for 41.3% of the market's incremental growth, indicating a significant opportunity for brands that can meet the demand for healthier, functional alternatives.

Request Free Sample

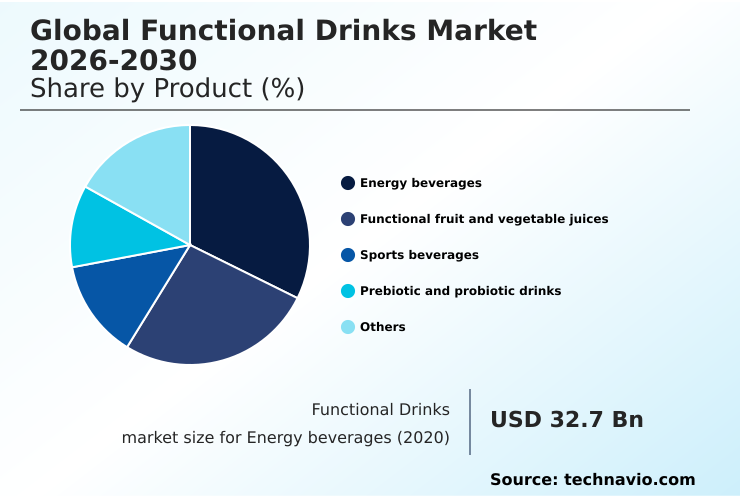
The Energy beverages segment was valued at USD 44.5 billion in 2024 and showed a gradual increase during the forecast period.

Request Free Sample

Regional Analysis

APAC is estimated to contribute 41.3% to the growth of the global market during the forecast period.Technavio’s analysts have elaborately explained the regional trends and drivers that shape the market during the forecast period.

See How Functional Drinks Market Demand is Rising in APAC Request Free Sample

The geographic landscape of the functional drinks market is led by the APAC region, which is responsible for 41.3% of the market's incremental growth, outpacing all other regions.

This expansion is driven by a demand for products like cold-pressed juices, plant-based wellness drinks, and beverages for children's functional nutrition.

In contrast, North America, which accounts for approximately 24.6% of the growth opportunity, sees strong demand for sports nutrition products and meal replacement drinks. European markets show a mature preference for organic-certified beverages and functional waters.

This regional diversity necessitates tailored product strategies, from anti-inflammatory drinks in wellness-focused markets to ready-to-drink wellness products designed for convenience.

As the market evolves, leveraging local ingredients, such as unique botanical extracts, and understanding regional wellness philosophies, including gut microbiome modulation, will be key to capturing share across these varied geographies, including the emerging demand for sleep support beverages.

Market Dynamics

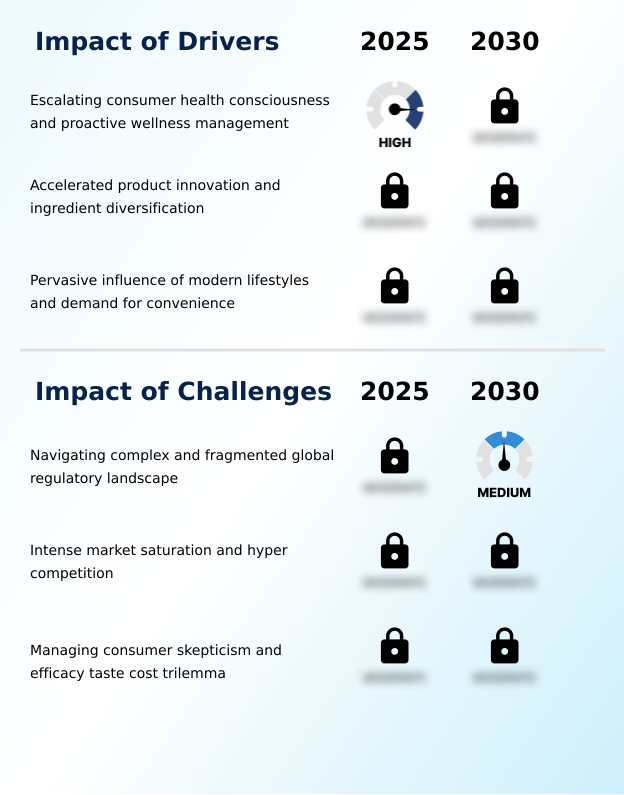
Our researchers analyzed the data with 2025 as the base year, along with the key drivers, trends, and challenges. A holistic analysis of drivers will help companies refine their marketing strategies to gain a competitive advantage.

  • Achieving success in the contemporary functional drinks market requires a nuanced understanding of specific consumer needs, moving beyond broad wellness claims. Consumers are actively searching for the best functional drink for focus and memory, leading to the rise of ready-to-drink (RTD) coffee with nootropics.
  • The probiotic vs prebiotic drinks for gut health debate is driving innovation, with firms developing advanced synbiotic formulations in drinks. The demand for natural ingredients in clean energy drinks is pushing manufacturers to highlight benefits without compromising on performance. Similarly, the need for functional drinks for managing daily stress is met by incorporating adaptogenic herbs for anxiety relief.
  • For athletes, low-sugar sports drinks for hydration and plant-based protein drinks for muscle recovery are essential. The market also sees growth in products offering benefits of collagen peptides in beverages for skin health and top-rated meal replacement shakes for weight loss.
  • Navigating dietary trends is critical, with a surge in keto-friendly beverages for sustained energy and zero-calorie functional waters with vitamins. Health-specific products like effective sleep support beverages without melatonin and immune support beverages with elderberry and zinc are gaining traction.
  • Formulations are also becoming more specialized, as seen in weight management drinks with thermogenic compounds and beauty-from-within drinks for skin health. The online retail channel, which grew by nearly 8% in the last reported year, provides a platform for niche products like organic-certified beverages for children's nutrition, allowing brands to educate consumers on what are synbiotic formulations in drinks directly.
  • This contrasts with supermarket channels, which require different logistical planning but offer broader reach. The functional drinks market trends and analysis show a clear path toward specialization and efficacy.

What are the key market drivers leading to the rise in the adoption of Functional Drinks Industry?

  • The market's primary driver is the escalating consumer health consciousness and a widespread shift toward proactive wellness management.

  • Accelerated product innovation and the pervasive demand for convenience are key drivers propelling the functional drinks market. Consumers are actively seeking ready-to-drink (RTD) formats that offer advanced hydration formulas and functional hydration solutions for their on-the-go lifestyles.
  • This has led to the expansion of vitamin-fortified drinks and products featuring natural sweeteners. The market for immune support beverages has seen particularly robust growth, with a compound annual growth rate in Europe of 11.2%, slightly outpacing APAC's 11.0% rate.
  • The focus on specific life stages is also crucial, with a growing portfolio of senior nutrition drinks. Innovation extends to traditional categories, with enhanced coffees and teas incorporating antioxidant-rich extracts and micronutrient fortification.
  • Moreover, sports recovery drinks are evolving to offer more than just electrolyte replenishment, appealing to a broader base of active consumers.

What are the market trends shaping the Functional Drinks Industry?

  • A prominent trend is the shift toward hyper-personalization and a granular approach to targeted nutrition. This reflects a consumer demand for products addressing specific, individual health goals.

  • The functional drinks market is experiencing a profound shift toward hyper-personalized and targeted nutritional solutions. This trend is creating a fragmented landscape where benefit-specific products like nootropic beverages for cognitive enhancement and drinks with adaptogenic herbs for stress relief are gaining mainstream traction.
  • The focus on digestive wellness is particularly strong, fueling demand for gut health drinks containing probiotic cultures and prebiotic fiber. For example, the market for products containing synbiotic formulations is growing 25% faster than conventional fortified juices. Furthermore, beauty-from-within drinks featuring collagen peptides are seeing accelerated adoption, particularly among consumers of women's health tonics.
  • This movement toward mindful consumption drinks and plant-based proteins reflects a deeper consumer desire for holistic wellness, with formulations addressing everything from stress to skin health.

What challenges does the Functional Drinks Industry face during its growth?

  • A key challenge affecting industry growth is the navigation of a complex and fragmented global regulatory landscape.

  • A primary challenge in the functional drinks market is navigating the complex formulation trilemma of delivering efficacy, taste, and affordability. For instance, in weight management drinks, incorporating effective thermogenic compounds and dietary fibers often imparts undesirable off-notes, requiring significant R&D to create palatable low-calorie formulations.
  • The technical hurdle of using high-pressure processing (HPP) to maintain nutrient integrity adds costs that are difficult to absorb in price-sensitive categories like men's wellness drinks. Creating effective meal replacement shakes and keto-friendly beverages with non-GMO ingredients and balanced amino acid blends while avoiding artificial sweeteners is a constant balancing act.
  • Consumer skepticism remains high; a product must deliver noticeable benefits, such as mood-enhancing compounds in a stress-relief drink. Failure to meet expectations on taste or price can result in a product being rejected, with data showing a 40% drop-off in repeat purchases for products perceived as ineffective.

Exclusive Technavio Analysis on Customer Landscape

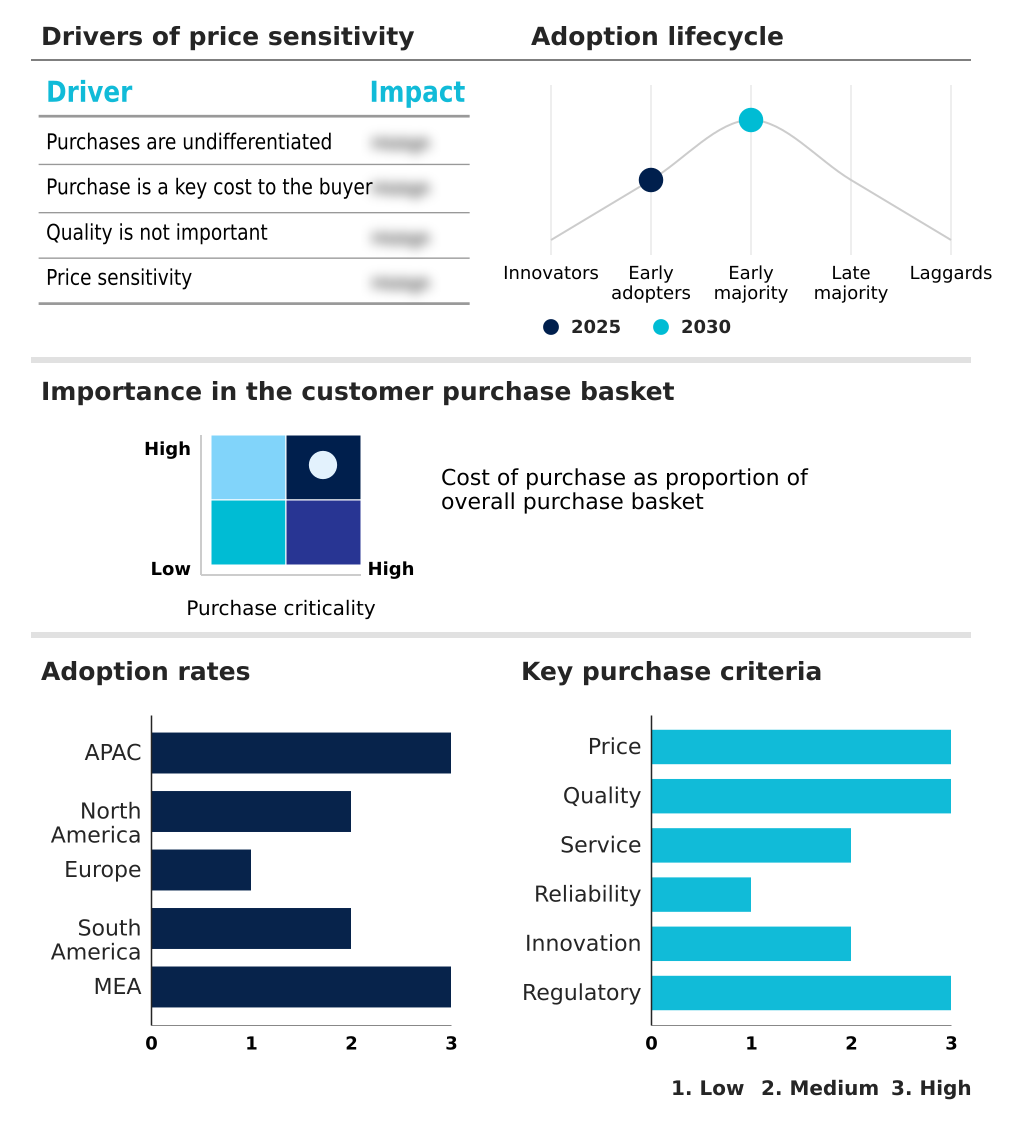
The functional drinks market forecasting report includes the adoption lifecycle of the market, covering from the innovator’s stage to the laggard’s stage. It focuses on adoption rates in different regions based on penetration. Furthermore, the functional drinks market report also includes key purchase criteria and drivers of price sensitivity to help companies evaluate and develop their market growth analysis strategies.

Customer Landscape of Functional Drinks Industry

Competitive Landscape

Companies are implementing various strategies, such as strategic alliances, functional drinks market forecast, partnerships, mergers and acquisitions, geographical expansion, and product/service launches, to enhance their presence in the industry.

Abbott Laboratories - The portfolio features performance-oriented beverages, including energy drinks and complementary sports nutrition lines, designed to support active consumer lifestyles and wellness goals.

The industry research and growth report includes detailed analyses of the competitive landscape of the market and information about key companies, including:

  • Abbott Laboratories
  • Amway Corp.
  • Campbell Soup Co.
  • Celsius Holdings Inc.
  • Danone S.A.
  • Glanbia plc
  • Herbalife International
  • Keurig Dr Pepper Inc.
  • Kirin Holdings Co. Ltd.
  • LIFEAID Beverage Co
  • Living Essentials Marketing LLC
  • Monster Energy Co.
  • NBEV Holdings
  • Nestle SA
  • Otsuka Holdings Co. Ltd.
  • PepsiCo Inc.
  • Red Bull GmbH
  • Suntory Beverage and Food Ltd.
  • The Coca Cola Co.
  • Unilever PLC

Qualitative and quantitative analysis of companies has been conducted to help clients understand the wider business environment as well as the strengths and weaknesses of key industry players. Data is qualitatively analyzed to categorize companies as pure play, category-focused, industry-focused, and diversified; it is quantitatively analyzed to categorize companies as dominant, leading, strong, tentative, and weak.

Recent Development and News in Functional drinks market

  • In February, 2025, The Coca-Cola Co. entered the prebiotic soda category with the launch of its Simply Pop product line, signaling a mainstream shift toward beverages targeting gut health.
  • In March, 2025, PepsiCo Inc. acquired Mindful Boost, a California-based startup specializing in sparkling nootropic teas, to secure a foothold in the cognitive enhancement beverage category.
  • In April, 2025, Suntory Group launched Harmony Flow, a line of ready-to-drink beverages in APAC developed with Traditional Chinese Medicine practitioners, blending traditional botanicals with clinically researched ingredients.
  • In May, 2025, Celsius Holdings Inc. acquired the Alani Nu brand to fortify its position in the better-for-you energy drink sector and appeal to health-conscious Gen Z consumers.

Dive into Technavio’s robust research methodology, blending expert interviews, extensive data synthesis, and validated models for unparalleled Functional Drinks Market insights. See full methodology.

Market Scope
Page number 315
Base year 2025
Historic period 2020-2024
Forecast period 2026-2030
Growth momentum & CAGR Accelerate at a CAGR of 10.5%
Market growth 2026-2030 USD 95.5 billion
Market structure Fragmented
YoY growth 2025-2026(%) 8.8%
Key countries China, Japan, India, South Korea, Australia, Indonesia, US, Canada, Mexico, Germany, UK, France, Italy, Spain, The Netherlands, Brazil, Argentina, Colombia, UAE, Saudi Arabia, South Africa, Turkey and Egypt
Competitive landscape Leading Companies, Market Positioning of Companies, Competitive Strategies, and Industry Risks

Request Free Sample

Research Analyst Overview

  • The functional drinks market is defined by a relentless drive toward specialization, where product success is intrinsically tied to formulation science and targeted consumer outcomes. The market is moving beyond simple micronutrient fortification into complex bioactive ingredients and synbiotic formulations.
  • Boardroom decisions are increasingly focused on navigating the high cost of R&D for products like nootropic beverages and those containing adaptogenic herbs, weighing the investment against the potential for premium pricing. For instance, the strategic allocation of capital toward achieving organic-certified beverages status can yield a significant ROI, as these products command over 15% higher price points in key demographics.
  • The landscape encompasses a vast array of products, from sports nutrition products and meal replacement drinks to enhanced coffees and teas and cold-pressed juices. Formulations often feature plant-based proteins, collagen peptides, and thermogenic compounds, delivered in convenient ready-to-drink (RTD) formats.
  • The emphasis is on clean-label formulation with natural sweeteners and non-GMO ingredients, often using high-pressure processing (HPP) to preserve antioxidant-rich extracts and botanical extracts.
  • Key categories like vitamin-fortified drinks, functional waters, and low-calorie formulations with dietary fibers and amino acid blends are engineered for specific benefits like digestive health support, gut microbiome modulation, cellular protection, mood-enhancing compounds, and cognitive enhancers, creating holistic wellness tonics that support everything from electrolyte replenishment to immune-boosting ingredients.

What are the Key Data Covered in this Functional Drinks Market Research and Growth Report?

  • What is the expected growth of the Functional Drinks Market between 2026 and 2030?

    • USD 95.5 billion, at a CAGR of 10.5%

  • What segmentation does the market report cover?

    • The report is segmented by Product (Energy beverages, Functional fruit and vegetable juices, Sports beverages, Prebiotic and probiotic drinks, and Others), Application (Health and wellness, and Weight loss), Distribution Channel (Supermarkets and hypermarkets, Online retail, Convenience stores, Food service, and Gyms and fitness centers) and Geography (APAC, North America, Europe, South America, Middle East and Africa)

  • Which regions are analyzed in the report?

    • APAC, North America, Europe, South America and Middle East and Africa

  • What are the key growth drivers and market challenges?

    • Escalating consumer health consciousness and proactive wellness management, Navigating complex and fragmented global regulatory landscape

  • Who are the major players in the Functional Drinks Market?

    • Abbott Laboratories, Amway Corp., Campbell Soup Co., Celsius Holdings Inc., Danone S.A., Glanbia plc, Herbalife International, Keurig Dr Pepper Inc., Kirin Holdings Co. Ltd., LIFEAID Beverage Co, Living Essentials Marketing LLC, Monster Energy Co., NBEV Holdings, Nestle SA, Otsuka Holdings Co. Ltd., PepsiCo Inc., Red Bull GmbH, Suntory Beverage and Food Ltd., The Coca Cola Co. and Unilever PLC

Market Research Insights

  • The market's dynamics are shaped by a pronounced consumer shift toward proactive health management and convenient nutrition on-the-go. This is evidenced by the growth of functional hydration solutions and advanced hydration formulas that deliver more than simple refreshment. Demand for personalized nutrition beverages and holistic health solutions is driving innovation across categories, from cognitive enhancement beverages to stress relief drinks.
  • The European market, for example, is forecast to expand at an 11.2% rate, outpacing North America's 10.1% growth, largely due to stringent regulations that foster high consumer trust in health claims.
  • This intense focus on validated efficacy creates a landscape where brand investment in R&D for clean energy solutions can yield a significant competitive advantage, with product efficacy directly influencing repeat purchase rates by over 40% in some segments.

We can help! Our analysts can customize this functional drinks market research report to meet your requirements.

Get in touch

1. Executive Summary

1.1 Market overview

Executive Summary - Chart on Market Overview
Executive Summary - Data Table on Market Overview
Executive Summary - Chart on Global Market Characteristics
Executive Summary - Chart on Market by Geography
Executive Summary - Chart on Market Segmentation by Product
Executive Summary - Chart on Market Segmentation by Application
Executive Summary - Chart on Market Segmentation by Distribution Channel
Executive Summary - Chart on Incremental Growth
Executive Summary - Data Table on Incremental Growth
Executive Summary - Chart on Company Market Positioning

2. Technavio Analysis

2.1 Analysis of price sensitivity, lifecycle, customer purchase basket, adoption rates, and purchase criteria

2.2 Criticality of inputs and Factors of differentiation

Chart on Overview on criticality of inputs and factors of differentiation

2.3 Factors of disruption

Chart on Overview on factors of disruption

2.4 Impact of drivers and challenges

Chart on Impact of drivers and challenges in 2025 and 2030

3. Market Landscape

3.1 Market ecosystem

Chart on Parent Market
Data Table on - Parent Market

3.2 Market characteristics

Chart on Market characteristics analysis

3.3 Value chain analysis

Chart on Value chain analysis

4. Market Sizing

4.1 Market definition

Data Table on Offerings of companies included in the market definition

4.2 Market segment analysis

Market segments

4.3 Market size 2025

4.4 Market outlook: Forecast for 2025-2030

Chart on Global - Market size and forecast 2025-2030 ($ billion)
Data Table on Global - Market size and forecast 2025-2030 ($ billion)
Chart on Global Market: Year-over-year growth 2025-2030 (%)
Data Table on Global Market: Year-over-year growth 2025-2030 (%)

5. Historic Market Size

5.1 Global Functional Drinks Market 2020 - 2024

Historic Market Size - Data Table on Global Functional Drinks Market 2020 - 2024 ($ billion)

5.2 Product segment analysis 2020 - 2024

Historic Market Size - Product Segment 2020 - 2024 ($ billion)

5.3 Application segment analysis 2020 - 2024

Historic Market Size - Application Segment 2020 - 2024 ($ billion)

5.4 Distribution Channel segment analysis 2020 - 2024

Historic Market Size - Distribution Channel Segment 2020 - 2024 ($ billion)

5.5 Geography segment analysis 2020 - 2024

Historic Market Size - Geography Segment 2020 - 2024 ($ billion)

5.6 Country segment analysis 2020 - 2024

Historic Market Size - Country Segment 2020 - 2024 ($ billion)

6. Qualitative Analysis

6.1 The impact of AI on global functional drinks market

7. Five Forces Analysis

7.1 Five forces summary

Five forces analysis - Comparison between 2025 and 2030

7.2 Bargaining power of buyers

Bargaining power of buyers - Impact of key factors 2025 and 2030

7.3 Bargaining power of suppliers

Bargaining power of suppliers - Impact of key factors in 2025 and 2030

7.4 Threat of new entrants

Threat of new entrants - Impact of key factors in 2025 and 2030

7.5 Threat of substitutes

Threat of substitutes - Impact of key factors in 2025 and 2030

7.6 Threat of rivalry

Threat of rivalry - Impact of key factors in 2025 and 2030

7.7 Market condition

Chart on Market condition - Five forces 2025 and 2030

8. Market Segmentation by Product

8.1 Market segments

Chart on Product - Market share 2025-2030 (%)
Data Table on Product - Market share 2025-2030 (%)

8.2 Comparison by Product

Chart on Comparison by Product
Data Table on Comparison by Product

8.3 Energy beverages - Market size and forecast 2025-2030

Chart on Energy beverages - Market size and forecast 2025-2030 ($ billion)
Data Table on Energy beverages - Market size and forecast 2025-2030 ($ billion)
Chart on Energy beverages - Year-over-year growth 2025-2030 (%)
Data Table on Energy beverages - Year-over-year growth 2025-2030 (%)

8.4 Functional fruit and vegetable juices - Market size and forecast 2025-2030

Chart on Functional fruit and vegetable juices - Market size and forecast 2025-2030 ($ billion)
Data Table on Functional fruit and vegetable juices - Market size and forecast 2025-2030 ($ billion)
Chart on Functional fruit and vegetable juices - Year-over-year growth 2025-2030 (%)
Data Table on Functional fruit and vegetable juices - Year-over-year growth 2025-2030 (%)

8.5 Sports beverages - Market size and forecast 2025-2030

Chart on Sports beverages - Market size and forecast 2025-2030 ($ billion)
Data Table on Sports beverages - Market size and forecast 2025-2030 ($ billion)
Chart on Sports beverages - Year-over-year growth 2025-2030 (%)
Data Table on Sports beverages - Year-over-year growth 2025-2030 (%)

8.6 Prebiotic and probiotic drinks - Market size and forecast 2025-2030

Chart on Prebiotic and probiotic drinks - Market size and forecast 2025-2030 ($ billion)
Data Table on Prebiotic and probiotic drinks - Market size and forecast 2025-2030 ($ billion)
Chart on Prebiotic and probiotic drinks - Year-over-year growth 2025-2030 (%)
Data Table on Prebiotic and probiotic drinks - Year-over-year growth 2025-2030 (%)

8.7 Others - Market size and forecast 2025-2030

Chart on Others - Market size and forecast 2025-2030 ($ billion)
Data Table on Others - Market size and forecast 2025-2030 ($ billion)
Chart on Others - Year-over-year growth 2025-2030 (%)
Data Table on Others - Year-over-year growth 2025-2030 (%)

8.8 Market opportunity by Product

Market opportunity by Product ($ billion)
Data Table on Market opportunity by Product ($ billion)

9. Market Segmentation by Application

9.1 Market segments

Chart on Application - Market share 2025-2030 (%)
Data Table on Application - Market share 2025-2030 (%)

9.2 Comparison by Application

Chart on Comparison by Application
Data Table on Comparison by Application

9.3 Health and wellness - Market size and forecast 2025-2030

Chart on Health and wellness - Market size and forecast 2025-2030 ($ billion)
Data Table on Health and wellness - Market size and forecast 2025-2030 ($ billion)
Chart on Health and wellness - Year-over-year growth 2025-2030 (%)
Data Table on Health and wellness - Year-over-year growth 2025-2030 (%)

9.4 Weight loss - Market size and forecast 2025-2030

Chart on Weight loss - Market size and forecast 2025-2030 ($ billion)
Data Table on Weight loss - Market size and forecast 2025-2030 ($ billion)
Chart on Weight loss - Year-over-year growth 2025-2030 (%)
Data Table on Weight loss - Year-over-year growth 2025-2030 (%)

9.5 Market opportunity by Application

Market opportunity by Application ($ billion)
Data Table on Market opportunity by Application ($ billion)

10. Market Segmentation by Distribution Channel

10.1 Market segments

Chart on Distribution Channel - Market share 2025-2030 (%)
Data Table on Distribution Channel - Market share 2025-2030 (%)

10.2 Comparison by Distribution Channel

Chart on Comparison by Distribution Channel
Data Table on Comparison by Distribution Channel

10.3 Supermarkets and hypermarkets - Market size and forecast 2025-2030

Chart on Supermarkets and hypermarkets - Market size and forecast 2025-2030 ($ billion)
Data Table on Supermarkets and hypermarkets - Market size and forecast 2025-2030 ($ billion)
Chart on Supermarkets and hypermarkets - Year-over-year growth 2025-2030 (%)
Data Table on Supermarkets and hypermarkets - Year-over-year growth 2025-2030 (%)

10.4 Online retail - Market size and forecast 2025-2030

Chart on Online retail - Market size and forecast 2025-2030 ($ billion)
Data Table on Online retail - Market size and forecast 2025-2030 ($ billion)
Chart on Online retail - Year-over-year growth 2025-2030 (%)
Data Table on Online retail - Year-over-year growth 2025-2030 (%)

10.5 Convenience stores - Market size and forecast 2025-2030

Chart on Convenience stores - Market size and forecast 2025-2030 ($ billion)
Data Table on Convenience stores - Market size and forecast 2025-2030 ($ billion)
Chart on Convenience stores - Year-over-year growth 2025-2030 (%)
Data Table on Convenience stores - Year-over-year growth 2025-2030 (%)

10.6 Food service - Market size and forecast 2025-2030

Chart on Food service - Market size and forecast 2025-2030 ($ billion)
Data Table on Food service - Market size and forecast 2025-2030 ($ billion)
Chart on Food service - Year-over-year growth 2025-2030 (%)
Data Table on Food service - Year-over-year growth 2025-2030 (%)

10.7 Gyms and fitness centers - Market size and forecast 2025-2030

Chart on Gyms and fitness centers - Market size and forecast 2025-2030 ($ billion)
Data Table on Gyms and fitness centers - Market size and forecast 2025-2030 ($ billion)
Chart on Gyms and fitness centers - Year-over-year growth 2025-2030 (%)
Data Table on Gyms and fitness centers - Year-over-year growth 2025-2030 (%)

10.8 Market opportunity by Distribution Channel

Market opportunity by Distribution Channel ($ billion)
Data Table on Market opportunity by Distribution Channel ($ billion)

11. Customer Landscape

11.1 Customer landscape overview

Analysis of price sensitivity, lifecycle, customer purchase basket, adoption rates, and purchase criteria

12. Geographic Landscape

12.1 Geographic segmentation

Chart on Market share by geography 2025-2030 (%)
Data Table on Market share by geography 2025-2030 (%)

12.2 Geographic comparison

Chart on Geographic comparison
Data Table on Geographic comparison

12.3 APAC - Market size and forecast 2025-2030

Chart on APAC - Market size and forecast 2025-2030 ($ billion)
Data Table on APAC - Market size and forecast 2025-2030 ($ billion)
Chart on APAC - Year-over-year growth 2025-2030 (%)
Data Table on APAC - Year-over-year growth 2025-2030 (%)
Chart on Regional Comparison - APAC
Data Table on Regional Comparison - APAC

12.3.1 China - Market size and forecast 2025-2030

Chart on China - Market size and forecast 2025-2030 ($ billion)
Data Table on China - Market size and forecast 2025-2030 ($ billion)
Chart on China - Year-over-year growth 2025-2030 (%)
Data Table on China - Year-over-year growth 2025-2030 (%)

12.3.2 Japan - Market size and forecast 2025-2030

Chart on Japan - Market size and forecast 2025-2030 ($ billion)
Data Table on Japan - Market size and forecast 2025-2030 ($ billion)
Chart on Japan - Year-over-year growth 2025-2030 (%)
Data Table on Japan - Year-over-year growth 2025-2030 (%)

12.3.3 India - Market size and forecast 2025-2030

Chart on India - Market size and forecast 2025-2030 ($ billion)
Data Table on India - Market size and forecast 2025-2030 ($ billion)
Chart on India - Year-over-year growth 2025-2030 (%)
Data Table on India - Year-over-year growth 2025-2030 (%)

12.3.4 South Korea - Market size and forecast 2025-2030

Chart on South Korea - Market size and forecast 2025-2030 ($ billion)
Data Table on South Korea - Market size and forecast 2025-2030 ($ billion)
Chart on South Korea - Year-over-year growth 2025-2030 (%)
Data Table on South Korea - Year-over-year growth 2025-2030 (%)

12.3.5 Australia - Market size and forecast 2025-2030

Chart on Australia - Market size and forecast 2025-2030 ($ billion)
Data Table on Australia - Market size and forecast 2025-2030 ($ billion)
Chart on Australia - Year-over-year growth 2025-2030 (%)
Data Table on Australia - Year-over-year growth 2025-2030 (%)

12.3.6 Indonesia - Market size and forecast 2025-2030

Chart on Indonesia - Market size and forecast 2025-2030 ($ billion)
Data Table on Indonesia - Market size and forecast 2025-2030 ($ billion)
Chart on Indonesia - Year-over-year growth 2025-2030 (%)
Data Table on Indonesia - Year-over-year growth 2025-2030 (%)

12.4 North America - Market size and forecast 2025-2030

Chart on North America - Market size and forecast 2025-2030 ($ billion)
Data Table on North America - Market size and forecast 2025-2030 ($ billion)
Chart on North America - Year-over-year growth 2025-2030 (%)
Data Table on North America - Year-over-year growth 2025-2030 (%)
Chart on Regional Comparison - North America
Data Table on Regional Comparison - North America

12.4.1 US - Market size and forecast 2025-2030

Chart on US - Market size and forecast 2025-2030 ($ billion)
Data Table on US - Market size and forecast 2025-2030 ($ billion)
Chart on US - Year-over-year growth 2025-2030 (%)
Data Table on US - Year-over-year growth 2025-2030 (%)

12.4.2 Canada - Market size and forecast 2025-2030

Chart on Canada - Market size and forecast 2025-2030 ($ billion)
Data Table on Canada - Market size and forecast 2025-2030 ($ billion)
Chart on Canada - Year-over-year growth 2025-2030 (%)
Data Table on Canada - Year-over-year growth 2025-2030 (%)

12.4.3 Mexico - Market size and forecast 2025-2030

Chart on Mexico - Market size and forecast 2025-2030 ($ billion)
Data Table on Mexico - Market size and forecast 2025-2030 ($ billion)
Chart on Mexico - Year-over-year growth 2025-2030 (%)
Data Table on Mexico - Year-over-year growth 2025-2030 (%)

12.5 Europe - Market size and forecast 2025-2030

Chart on Europe - Market size and forecast 2025-2030 ($ billion)
Data Table on Europe - Market size and forecast 2025-2030 ($ billion)
Chart on Europe - Year-over-year growth 2025-2030 (%)
Data Table on Europe - Year-over-year growth 2025-2030 (%)
Chart on Regional Comparison - Europe
Data Table on Regional Comparison - Europe

12.5.1 Germany - Market size and forecast 2025-2030

Chart on Germany - Market size and forecast 2025-2030 ($ billion)
Data Table on Germany - Market size and forecast 2025-2030 ($ billion)
Chart on Germany - Year-over-year growth 2025-2030 (%)
Data Table on Germany - Year-over-year growth 2025-2030 (%)

12.5.2 UK - Market size and forecast 2025-2030

Chart on UK - Market size and forecast 2025-2030 ($ billion)
Data Table on UK - Market size and forecast 2025-2030 ($ billion)
Chart on UK - Year-over-year growth 2025-2030 (%)
Data Table on UK - Year-over-year growth 2025-2030 (%)

12.5.3 France - Market size and forecast 2025-2030

Chart on France - Market size and forecast 2025-2030 ($ billion)
Data Table on France - Market size and forecast 2025-2030 ($ billion)
Chart on France - Year-over-year growth 2025-2030 (%)
Data Table on France - Year-over-year growth 2025-2030 (%)

12.5.4 Italy - Market size and forecast 2025-2030

Chart on Italy - Market size and forecast 2025-2030 ($ billion)
Data Table on Italy - Market size and forecast 2025-2030 ($ billion)
Chart on Italy - Year-over-year growth 2025-2030 (%)
Data Table on Italy - Year-over-year growth 2025-2030 (%)

12.5.5 Spain - Market size and forecast 2025-2030

Chart on Spain - Market size and forecast 2025-2030 ($ billion)
Data Table on Spain - Market size and forecast 2025-2030 ($ billion)
Chart on Spain - Year-over-year growth 2025-2030 (%)
Data Table on Spain - Year-over-year growth 2025-2030 (%)

12.5.6 The Netherlands - Market size and forecast 2025-2030

Chart on The Netherlands - Market size and forecast 2025-2030 ($ billion)
Data Table on The Netherlands - Market size and forecast 2025-2030 ($ billion)
Chart on The Netherlands - Year-over-year growth 2025-2030 (%)
Data Table on The Netherlands - Year-over-year growth 2025-2030 (%)

12.6 South America - Market size and forecast 2025-2030

Chart on South America - Market size and forecast 2025-2030 ($ billion)
Data Table on South America - Market size and forecast 2025-2030 ($ billion)
Chart on South America - Year-over-year growth 2025-2030 (%)
Data Table on South America - Year-over-year growth 2025-2030 (%)
Chart on Regional Comparison - South America
Data Table on Regional Comparison - South America

12.6.1 Brazil - Market size and forecast 2025-2030

Chart on Brazil - Market size and forecast 2025-2030 ($ billion)
Data Table on Brazil - Market size and forecast 2025-2030 ($ billion)
Chart on Brazil - Year-over-year growth 2025-2030 (%)
Data Table on Brazil - Year-over-year growth 2025-2030 (%)

12.6.2 Argentina - Market size and forecast 2025-2030

Chart on Argentina - Market size and forecast 2025-2030 ($ billion)
Data Table on Argentina - Market size and forecast 2025-2030 ($ billion)
Chart on Argentina - Year-over-year growth 2025-2030 (%)
Data Table on Argentina - Year-over-year growth 2025-2030 (%)

12.6.3 Colombia - Market size and forecast 2025-2030

Chart on Colombia - Market size and forecast 2025-2030 ($ billion)
Data Table on Colombia - Market size and forecast 2025-2030 ($ billion)
Chart on Colombia - Year-over-year growth 2025-2030 (%)
Data Table on Colombia - Year-over-year growth 2025-2030 (%)

12.7 Middle East and Africa - Market size and forecast 2025-2030

Chart on Middle East and Africa - Market size and forecast 2025-2030 ($ billion)
Data Table on Middle East and Africa - Market size and forecast 2025-2030 ($ billion)
Chart on Middle East and Africa - Year-over-year growth 2025-2030 (%)
Data Table on Middle East and Africa - Year-over-year growth 2025-2030 (%)
Chart on Regional Comparison - Middle East and Africa
Data Table on Regional Comparison - Middle East and Africa

12.7.1 UAE - Market size and forecast 2025-2030

Chart on UAE - Market size and forecast 2025-2030 ($ billion)
Data Table on UAE - Market size and forecast 2025-2030 ($ billion)
Chart on UAE - Year-over-year growth 2025-2030 (%)
Data Table on UAE - Year-over-year growth 2025-2030 (%)

12.7.2 Saudi Arabia - Market size and forecast 2025-2030

Chart on Saudi Arabia - Market size and forecast 2025-2030 ($ billion)
Data Table on Saudi Arabia - Market size and forecast 2025-2030 ($ billion)
Chart on Saudi Arabia - Year-over-year growth 2025-2030 (%)
Data Table on Saudi Arabia - Year-over-year growth 2025-2030 (%)

12.7.3 South Africa - Market size and forecast 2025-2030

Chart on South Africa - Market size and forecast 2025-2030 ($ billion)
Data Table on South Africa - Market size and forecast 2025-2030 ($ billion)
Chart on South Africa - Year-over-year growth 2025-2030 (%)
Data Table on South Africa - Year-over-year growth 2025-2030 (%)

12.7.4 Turkey - Market size and forecast 2025-2030

Chart on Turkey - Market size and forecast 2025-2030 ($ billion)
Data Table on Turkey - Market size and forecast 2025-2030 ($ billion)
Chart on Turkey - Year-over-year growth 2025-2030 (%)
Data Table on Turkey - Year-over-year growth 2025-2030 (%)

12.7.5 Egypt - Market size and forecast 2025-2030

Chart on Egypt - Market size and forecast 2025-2030 ($ billion)
Data Table on Egypt - Market size and forecast 2025-2030 ($ billion)
Chart on Egypt - Year-over-year growth 2025-2030 (%)
Data Table on Egypt - Year-over-year growth 2025-2030 (%)

12.8 Market opportunity by geography

Market opportunity by geography ($ billion)
Data Tables on Market opportunity by geography ($ billion)

13. Drivers, Challenges, and Opportunity

13.1 Market drivers

Escalating consumer health consciousness and proactive wellness management
Accelerated product innovation and ingredient diversification
Pervasive influence of modern lifestyles and demand for convenience

13.2 Market challenges

Navigating complex and fragmented global regulatory landscape
Intense market saturation and hyper competition
Managing consumer skepticism and efficacy taste cost trilemma

13.3 Impact of drivers and challenges

Impact of drivers and challenges in 2025 and 2030

13.4 Market opportunities

Hyper-personalization and granular approach to targeted nutrition
Ascent of mindful consumption and focus on mental well being
Sustainability and ethical sourcing as foundational value proposition

14. Competitive Landscape

14.1 Overview

14.2

Overview on criticality of inputs and factors of differentiation

14.3 Landscape disruption

Overview on factors of disruption

14.4 Industry risks

Impact of key risks on business

15. Competitive Analysis

15.1 Companies profiled

Companies covered

15.2 Company ranking index

15.3 Market positioning of companies

Matrix on companies position and classification

15.4 Amway Corp.

Amway Corp. - Overview
Amway Corp. - Product / Service
Amway Corp. - Key news
Amway Corp. - Key offerings
SWOT

15.5 Campbell Soup Co.

Campbell Soup Co. - Overview
Campbell Soup Co. - Business segments
Campbell Soup Co. - Key news
Campbell Soup Co. - Key offerings
Campbell Soup Co. - Segment focus
SWOT

15.6 Celsius Holdings Inc.

Celsius Holdings Inc. - Overview
Celsius Holdings Inc. - Product / Service
Celsius Holdings Inc. - Key offerings
SWOT

15.7 Danone S.A.

Danone S.A. - Overview
Danone S.A. - Business segments
Danone S.A. - Key news
Danone S.A. - Key offerings
Danone S.A. - Segment focus
SWOT

15.8 Herbalife International

Herbalife International - Overview
Herbalife International - Product / Service
Herbalife International - Key news
Herbalife International - Key offerings
SWOT

15.9 LIFEAID Beverage Co

LIFEAID Beverage Co - Overview
LIFEAID Beverage Co - Product / Service
LIFEAID Beverage Co - Key offerings
SWOT

15.10 Living Essentials Marketing LLC

Living Essentials Marketing LLC - Overview
Living Essentials Marketing LLC - Product / Service
Living Essentials Marketing LLC - Key offerings
SWOT

15.11 Monster Energy Co.

Monster Energy Co. - Overview
Monster Energy Co. - Product / Service
Monster Energy Co. - Key offerings
SWOT

15.12 Nestle SA

Nestle SA - Overview
Nestle SA - Business segments
Nestle SA - Key news
Nestle SA - Key offerings
Nestle SA - Segment focus
SWOT

15.13 Otsuka Holdings Co. Ltd.

Otsuka Holdings Co. Ltd. - Overview
Otsuka Holdings Co. Ltd. - Business segments
Otsuka Holdings Co. Ltd. - Key news
Otsuka Holdings Co. Ltd. - Key offerings
Otsuka Holdings Co. Ltd. - Segment focus
SWOT

15.14 PepsiCo Inc.

PepsiCo Inc. - Overview
PepsiCo Inc. - Business segments
PepsiCo Inc. - Key news
PepsiCo Inc. - Key offerings
PepsiCo Inc. - Segment focus
SWOT

15.15 Red Bull GmbH

Red Bull GmbH - Overview
Red Bull GmbH - Product / Service
Red Bull GmbH - Key offerings
SWOT

15.16 Suntory Beverage and Food Ltd.

Suntory Beverage and Food Ltd. - Overview
Suntory Beverage and Food Ltd. - Business segments
Suntory Beverage and Food Ltd. - Key news
Suntory Beverage and Food Ltd. - Key offerings
Suntory Beverage and Food Ltd. - Segment focus
SWOT

15.17 The Coca Cola Co.

The Coca Cola Co. - Overview
The Coca Cola Co. - Business segments
The Coca Cola Co. - Key news
The Coca Cola Co. - Key offerings
The Coca Cola Co. - Segment focus
SWOT

15.18 Unilever PLC

Unilever PLC - Overview
Unilever PLC - Business segments
Unilever PLC - Key offerings
Unilever PLC - Segment focus
SWOT

16. Appendix

16.1 Scope of the report

Market definition
Objectives
Notes and caveats

16.2 Inclusions and exclusions checklist

Inclusions checklist
Exclusions checklist

16.3 Currency conversion rates for US$

16.4 Research methodology

16.5 Data procurement

Information sources

16.6 Data validation

16.7 Validation techniques employed for market sizing

16.8 Data synthesis

16.9 360 degree market analysis

16.10 List of abbreviations

Research Methodology

Technavio presents a detailed picture of the market by way of study, synthesis, and summation of data from multiple sources. The analysts have presented the various facets of the market with a particular focus on identifying the key industry influencers. The data thus presented is comprehensive, reliable, and the result of extensive research, both primary and secondary.

INFORMATION SOURCES

Primary sources

  • Manufacturers and suppliers
  • Channel partners
  • Industry experts
  • Strategic decision makers

Secondary sources

  • Industry journals and periodicals
  • Government data
  • Financial reports of key industry players
  • Historical data
  • Press releases

DATA ANALYSIS

Data Synthesis

  • Collation of data
  • Estimation of key figures
  • Analysis of derived insights

Data Validation

  • Triangulation with data models
  • Reference against proprietary databases
  • Corroboration with industry experts

REPORT WRITING

Qualitative

  • Market drivers
  • Market challenges
  • Market trends
  • Five forces analysis

Quantitative

  • Market size and forecast
  • Market segmentation
  • Geographical insights
  • Competitive landscape

Interested in this report?

Get your sample now to see our research methodology and insights!

Download Now

Frequently Asked Questions

Functional Drinks market growth will increase by USD 95.5 billion during 2026-2030.

The Functional Drinks market is expected to grow at a CAGR of 10.5% during 2026-2030.

Functional Drinks market is segmented by Product (Energy beverages, Functional fruit and vegetable juices, Sports beverages, Prebiotic and probiotic drinks, Others) Application (Health and wellness, Weight loss) Distribution channel (Supermarkets and hypermarkets, Online retail, Convenience stores, Food service, Gyms and fitness centers)

Abbott Laboratories, Amway Corp., Campbell Soup Co., Celsius Holdings Inc., Danone S.A., Glanbia plc, Herbalife International, Keurig Dr Pepper Inc., Kirin Holdings Co. Ltd., LIFEAID Beverage Co, Living Essentials Marketing LLC, Monster Energy Co., NBEV Holdings, Nestle SA, Otsuka Holdings Co. Ltd., PepsiCo Inc., Red Bull GmbH, Suntory Beverage and Food Ltd., The Coca Cola Co., Unilever PLC are a few of the key vendors in the Functional Drinks market.

APAC will register the highest growth rate of 41.3% among the other regions. Therefore, the Functional Drinks market in APAC is expected to garner significant business opportunities for the vendors during the forecast period.

China, Japan, India, South Korea, Australia, Indonesia, US, Canada, Mexico, Germany, UK, France, Italy, Spain, The Netherlands, Brazil, Argentina, Colombia, UAE, Saudi Arabia, South Africa, Turkey, Egypt

  • Escalating consumer health consciousness and proactive wellness management is the driving factor this market.

The Functional Drinks market vendors should focus on grabbing business opportunities from the Product segment as it accounted for the largest market share in the base year.