Juices Market Size 2026-2030
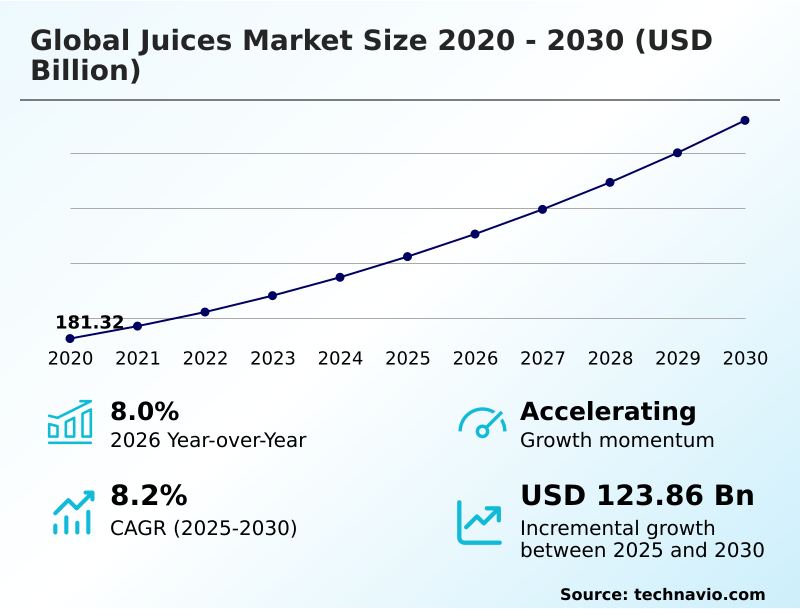
The juices market size is valued to increase by USD 123.86 billion, at a CAGR of 8.2% from 2025 to 2030. Surging consumer focus on health and wellness will drive the juices market.
Major Market Trends & Insights
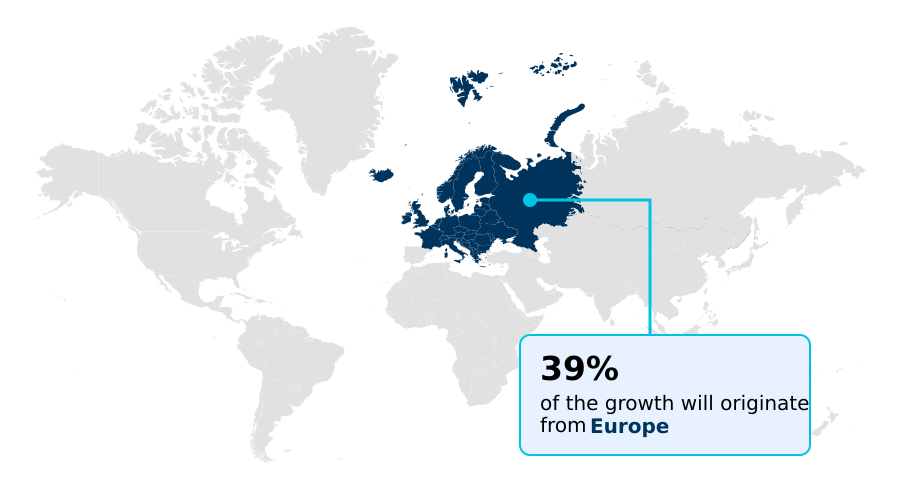
- Europe dominated the market and accounted for a 39% growth during the forecast period.
- By Product - Fruit juices segment was valued at USD 189.89 billion in 2024
- By Distribution Channel - Offline segment accounted for the largest market revenue share in 2024
Market Size & Forecast
- Market Opportunities: USD 198.34 billion
- Market Future Opportunities: USD 123.86 billion
- CAGR from 2025 to 2030 : 8.2%
Market Summary
- The juices market is evolving beyond traditional refreshments into a key component of proactive health management. A significant driver is the consumer pivot toward functional ingredients and clean label ingredients, compelling producers to innovate with vegetable-centric blends and probiotic fortified beverages.
- This shift prioritizes nutritional value over simple taste, with high-pressure processing becoming a standard for preserving the integrity of cold-pressed juices. Sustainability has also become a central pillar, influencing the entire value chain from regenerative agriculture and sustainable sourcing to carbon-neutral production.
- For instance, a beverage manufacturer might leverage advanced traceability technologies not just for compliance but to provide consumer-facing transparency into its ethical sourcing practices, enhancing brand trust. This complex landscape is further shaped by the challenge of sugar reduction technology, as companies race to reformulate juice drinks without compromising flavor.
- Success hinges on balancing health, convenience, and a commitment to environmental stewardship through the adoption of plant-based diet support and customized juice assortments that meet personalized nutrition services demands.
What will be the Size of the Juices Market during the forecast period?
Get Key Insights on Market Forecast (PDF) Get Free Sample
How is the Juices Market Segmented?
The juices industry research report provides comprehensive data (region-wise segment analysis), with forecasts and estimates in "USD million" for the period 2026-2030, as well as historical data from 2020-2024 for the following segments.
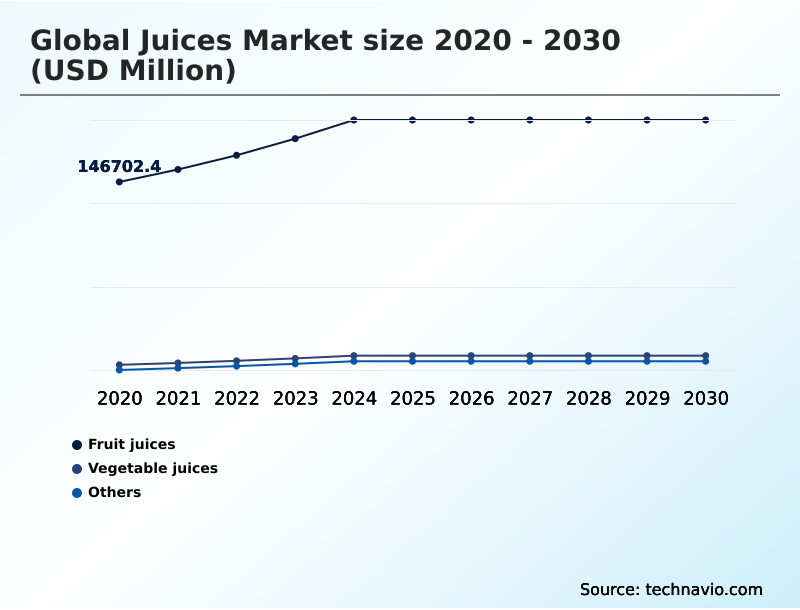
- Product
- Fruit juices
- Vegetable juices
- Others
- Distribution channel
- Offline
- Online
- Type
- Complete fruit juice
- Nectars
- Juice drinks
- Concentrates
- Others
- Geography
- Europe
- Germany
- UK
- France
- North America
- US
- Canada
- Mexico
- APAC
- China
- India
- Japan
- South America
- Brazil
- Argentina
- Middle East and Africa
- Saudi Arabia
- UAE
- South Africa
- Rest of World (ROW)
- Europe
By Product Insights
The fruit juices segment is estimated to witness significant growth during the forecast period.
The fruit juices segment, which accounts for approximately 80% of the total market volume, is undergoing a significant transformation. The market is increasingly driven by a premiumization strategy, shifting away from conventional products toward not-from-concentrate and cold-pressed juices.
This evolution is a direct response to consumer demand for clean label ingredients and minimal processing techniques. Brands are leveraging single-origin sourcing and highlighting fruit varietal specificity to create an artisanal juice experience that builds brand trust.
Furthermore, the introduction of exotic flavor profiles is expanding the category, appealing to consumers seeking novel and sophisticated beverage options that support a proactive health management lifestyle, making this a pivotal area for value-added products and plant-based diet support.
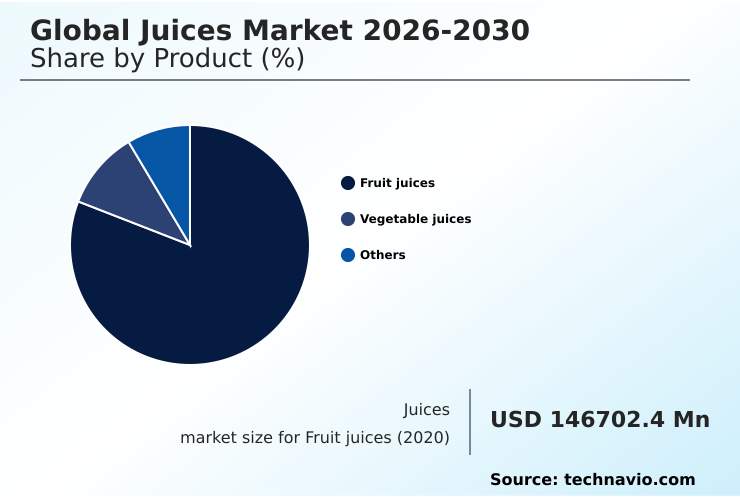
The Fruit juices segment was valued at USD 189.89 billion in 2024 and showed a gradual increase during the forecast period.
Regional Analysis
Europe is estimated to contribute 39% to the growth of the global market during the forecast period.Technavio’s analysts have elaborately explained the regional trends and drivers that shape the market during the forecast period.
See How Juices Market Demand is Rising in Europe Get Free Sample
The geographic landscape of the juices market is diverse, with regional dynamics shaping growth trajectories.
Europe is set to contribute approximately 39% of the market's incremental growth, driven by stringent regulations that accelerate sugar reduction technology and demand for organic certification.
In contrast, North America focuses on a premiumization strategy, with high adoption of cold-pressed juices and functional ingredients. The region has seen operational efficiency improve by over 15% in facilities using high-pressure processing.
APAC is the fastest-growing region, with a projected expansion of 9.0%, fueled by rising health consciousness and demand for immunity-boosting drinks and affordable luxury drinks.
Companies here are leveraging direct-to-consumer models to reach a fragmented consumer base, while also focusing on value-added products that incorporate local botanical extracts and support a plant-based diet.
Market Dynamics
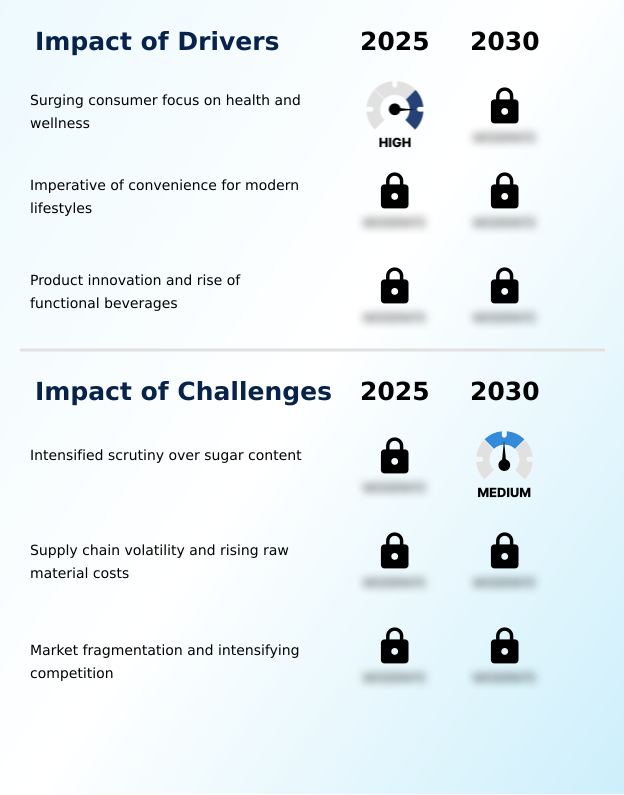
Our researchers analyzed the data with 2025 as the base year, along with the key drivers, trends, and challenges. A holistic analysis of drivers will help companies refine their marketing strategies to gain a competitive advantage.
- Strategic decision-making in the current market requires a deep understanding of several interconnected factors. The impact of sugar taxes on juice formulation is compelling a rapid shift in R&D, where the central question is no longer just flavor but also compliance and health perception.
- This directly ties into the growing consumer preference for clean label juice, which necessitates transparency in sourcing and processing. The role of e-commerce in juice distribution has fundamentally altered market access, with direct-to-consumer subscription models for juice reporting customer retention rates that are over 30% higher than those for products sold only through traditional retail.
- However, this channel introduces significant challenges in cold chain logistics for juice, demanding investment in sophisticated infrastructure. Innovation is a key battleground, with the debate between high-pressure processing versus pasteurization shaping product quality and cost structures. Concurrently, there is a push for innovation in natural sweeteners for nectars to appeal to sugar-conscious consumers.
- Marketing fortified juices for immune support and adapting to savory flavor profile trends are crucial for differentiation, as is the strategic decision to acquire niche brands for portfolio expansion. Ultimately, companies must balance consumer demands, regulatory pressures, and intense competition from functional water and teas by fortifying juice with plant-based proteins and ensuring a resilient supply chain.
What are the key market drivers leading to the rise in the adoption of Juices Industry?
- A key driver for the market is the surging consumer focus on health and wellness, which is steering preferences toward natural and nutritionally beneficial beverage options.
- Market growth is primarily fueled by the consumer shift toward proactive health management and the demand for convenience.
- The integration of functional ingredients to create immunity-boosting drinks and products offering digestive health support has expanded market reach by over 15% into new consumer segments. This innovation in value-added products includes probiotic fortified beverages and plant-based protein infusion.
- Simultaneously, the need for on-the-go nutrition has accelerated the adoption of direct-to-consumer models and subscription-based delivery, which have been shown to reduce distribution costs by up to 25% for emerging brands.
- These platforms enable a high degree of personalization through customized juice assortments, effectively catering to the demand for clean energy beverages and active lifestyle beverages.
What are the market trends shaping the Juices Industry?
- A defining market trend is the shift toward holistic sustainability and transparent sourcing. This movement reflects a growing consumer demand for comprehensive ethical and environmental accountability throughout the entire value chain.
- Key trends are reshaping the market, moving it toward a more sophisticated and transparent model. The premiumization strategy is evident as brands leverage single-origin sourcing and an artisanal juice experience, with such products commanding price premiums of up to 20%.
- This is coupled with a strong push for consumer-facing transparency, where the use of advanced traceability technologies to showcase ethical sourcing practices has been linked to a 10% increase in repeat purchases. The craft beverage movement is also influencing savory flavor profiles and vegetable-centric blends, creating new categories like liquid snack alternatives.
- Furthermore, the focus on holistic wellness beverages and sustainable packaging solutions is driving consumer eco-consciousness and building brand trust through tangible commitments to regenerative agriculture and carbon-neutral production.
What challenges does the Juices Industry face during its growth?
- Intensified scrutiny over sugar content from both consumers and regulators presents a key challenge to the industry's growth, compelling widespread product reformulation.
- The market faces significant challenges, primarily from intense scrutiny over sugar content, which has forced widespread juice drink reformulation. The impact of sugar taxes on juice formulation has increased R&D costs by up to 30% for companies needing to implement new sugar reduction technology with natural sweeteners.
- Another critical issue is supply chain volatility; climate-related disruptions have caused raw material costs for not-from-concentrate products to spike by over 40% in some quarters, threatening margins. This necessitates diversification and investment in cold chain logistics.
- Competition from functional beverages is also intensifying, compelling juice brands to innovate with options like ambient juice shots and shelf-stable juices to defend their position and appeal to consumers seeking family-friendly healthy options.
Exclusive Technavio Analysis on Customer Landscape
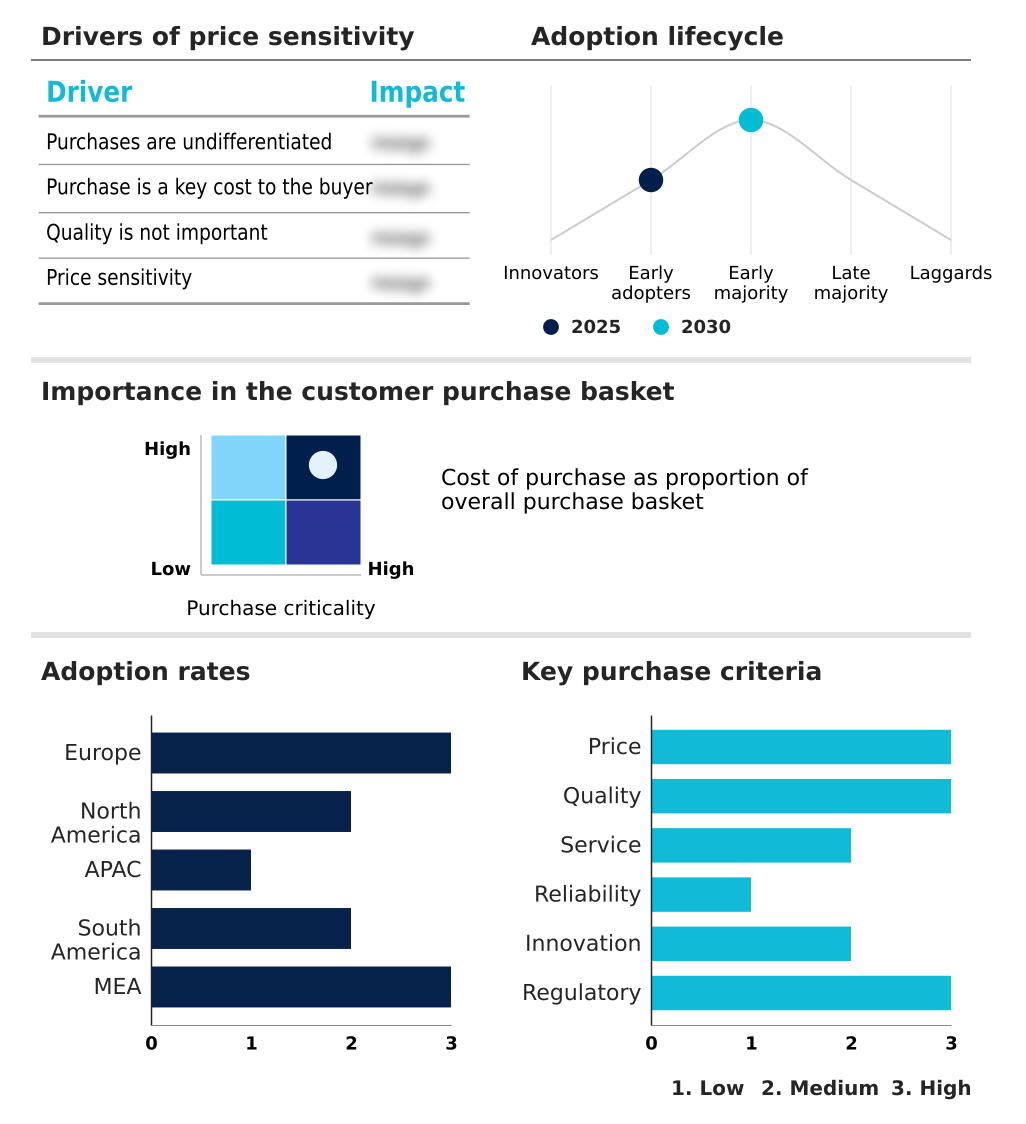
The juices market forecasting report includes the adoption lifecycle of the market, covering from the innovator’s stage to the laggard’s stage. It focuses on adoption rates in different regions based on penetration. Furthermore, the juices market report also includes key purchase criteria and drivers of price sensitivity to help companies evaluate and develop their market growth analysis strategies.
Customer Landscape of Juices Industry
Competitive Landscape
Companies are implementing various strategies, such as strategic alliances, juices market forecast, partnerships, mergers and acquisitions, geographical expansion, and product/service launches, to enhance their presence in the industry.
Bolthouse Farms Inc. - Key offerings consist of a dynamic portfolio of fruit-based juice drinks and blended beverages, catering to a wide range of global consumer preferences.
The industry research and growth report includes detailed analyses of the competitive landscape of the market and information about key companies, including:
- Bolthouse Farms Inc.
- Britvic plc
- Campbell Soup Co.
- Dabur India Ltd.
- Del Monte Foods Corp
- Dole Packaged Foods LLC
- Eckes Granini Group GmbH
- Floridas Natural Growers Inc
- Grupo Jumex
- Keurig Dr Pepper Inc.
- Lassonde Industries Inc.
- Ocean Spray Cranberries Inc.
- PepsiCo Inc.
- POM Wonderful LLC
- Rauch Fruchtsafte GmbH
- Refresco Group BV
- Suja Life LLC
- The Coca Cola Co.
- The Kraft Heinz Co.
- Tropicana Brands Group Inc
Qualitative and quantitative analysis of companies has been conducted to help clients understand the wider business environment as well as the strengths and weaknesses of key industry players. Data is qualitatively analyzed to categorize companies as pure play, category-focused, industry-focused, and diversified; it is quantitatively analyzed to categorize companies as dominant, leading, strong, tentative, and weak.
Recent Development and News in Juices market
- In March, 2025, PepsiCo Inc. launched Naked Truth, a new line of cold-pressed, high-pressure processed juices made from 100% organic, traceable produce to cater to health-conscious consumers.
- In March, 2025, Nestle SA announced a comprehensive reformulation initiative for its juice drink portfolio across Southeast Asia, committing to a phased reduction of added sugars by an average of 30% over two years.
- In May, 2025, Campbell Soup Co. launched a new direct-to-consumer initiative for its V8 brand called V8 Vitality Box, an online subscription service allowing customized weekly or monthly assortments.
- In February, 2025, Keurig Dr Pepper Inc. announced the acquisition of a fast-growing independent brand specializing in shelf-stable, plant-based protein smoothies to strengthen its portfolio in the active lifestyle beverage segment.
Dive into Technavio’s robust research methodology, blending expert interviews, extensive data synthesis, and validated models for unparalleled Juices Market insights. See full methodology.
| Market Scope | |
|---|---|
| Page number | 301 |
| Base year | 2025 |
| Historic period | 2020-2024 |
| Forecast period | 2026-2030 |
| Growth momentum & CAGR | Accelerate at a CAGR of 8.2% |
| Market growth 2026-2030 | USD 123856.6 million |
| Market structure | Fragmented |
| YoY growth 2025-2026(%) | 8.0% |
| Key countries | Germany, UK, France, Italy, Spain, Russia, US, Canada, Mexico, China, India, Japan, South Korea, Australia, Indonesia, Brazil, Argentina, Chile, Saudi Arabia, UAE, South Africa, Egypt and Turkey |
| Competitive landscape | Leading Companies, Market Positioning of Companies, Competitive Strategies, and Industry Risks |
Research Analyst Overview
- The juices market is undergoing a fundamental realignment, driven by consumer demand for healthier and more sustainable options. This shift has elevated concepts like single-origin sourcing and fruit varietal specificity from niche interests to mainstream value propositions.
- Boardroom decisions are now heavily influenced by the need for supply chain traceability and sustainable sourcing, which are critical for mitigating risks and building brand equity. Investment in regenerative agriculture and carbon-neutral production is increasingly seen as essential for long-term viability.
- The market is characterized by rapid innovation, including the development of high-retention concentrates and the fortification of beverages with probiotics, plant-based proteins, and micronutrients. Technologies such as high-pressure processing and advanced traceability systems are enabling manufacturers to deliver on promises of quality and transparency.
- For instance, firms utilizing minimal processing techniques for their cold-pressed juices have achieved a notable extension in shelf life, enhancing cold chain logistics efficiency. This focus on value-added products, combined with sophisticated direct-to-consumer models and the use of natural sweeteners to execute juice drink reformulation, defines the competitive landscape.
What are the Key Data Covered in this Juices Market Research and Growth Report?
-
What is the expected growth of the Juices Market between 2026 and 2030?
-
USD 123.86 billion, at a CAGR of 8.2%
-
-
What segmentation does the market report cover?
-
The report is segmented by Product (Fruit juices, Vegetable juices, and Others), Distribution Channel (Offline, and Online), Type (Complete fruit juice, Nectars, Juice drinks, Concentrates, and Others) and Geography (Europe, North America, APAC, South America, Middle East and Africa)
-
-
Which regions are analyzed in the report?
-
Europe, North America, APAC, South America and Middle East and Africa
-
-
What are the key growth drivers and market challenges?
-
Surging consumer focus on health and wellness, Intensified scrutiny over sugar content
-
-
Who are the major players in the Juices Market?
-
Bolthouse Farms Inc., Britvic plc, Campbell Soup Co., Dabur India Ltd., Del Monte Foods Corp, Dole Packaged Foods LLC, Eckes Granini Group GmbH, Floridas Natural Growers Inc, Grupo Jumex, Keurig Dr Pepper Inc., Lassonde Industries Inc., Ocean Spray Cranberries Inc., PepsiCo Inc., POM Wonderful LLC, Rauch Fruchtsafte GmbH, Refresco Group BV, Suja Life LLC, The Coca Cola Co., The Kraft Heinz Co. and Tropicana Brands Group Inc
-
Market Research Insights
- Market dynamics are increasingly shaped by the pursuit of holistic wellness beverages and on-the-go nutrition. The craft beverage movement has introduced an element of affordable luxury drinks, compelling established players to innovate.
- Active lifestyle beverages and immunity-boosting drinks are creating high-growth niches, with brands that offer customized juice assortments through subscription-based delivery seeing customer loyalty rates improve by up to 25%. Furthermore, the emphasis on digestive health support and stress management beverages is influencing product development.
- The strategic use of data-driven marketing to promote these benefits has resulted in a 15% higher conversion rate for targeted online campaigns. As consumers seek out liquid snack alternatives and midday reset drinks, the ability to offer family-friendly healthy options through convenient, ready-to-drink formats is critical for optimizing shelf-space and capturing market share.
We can help! Our analysts can customize this juices market research report to meet your requirements.
 RIA -
RIA - 
