Kid Snacks Market Analysis, Size, and Forecast 2026-2030: APAC (China, India, and Japan), North America (US, Canada, and Mexico), Europe (Germany, UK, and France), South America (Brazil, Argentina, and Colombia), Middle East and Africa (South Africa, Saudi Arabia, and UAE), and Rest of World (ROW)

Kid Snacks Market Analysis, Size, and Forecast 2026-2030:
APAC (China, India, and Japan), North America (US, Canada, and Mexico), Europe (Germany, UK, and France), South America (Brazil, Argentina, and Colombia), Middle East and Africa (South Africa, Saudi Arabia, and UAE), and Rest of World (ROW)

Published: Dec 2025 321 Pages SKU: IRTNTR81189

Market Overview at a Glance

$35.12 B
Market Opportunity
7.9%
CAGR 2025 - 2030
42.6%
APAC Growth
$20.40 B
Biscuits and cookies segment 2024

Kid Snacks Market Size 2026-2030

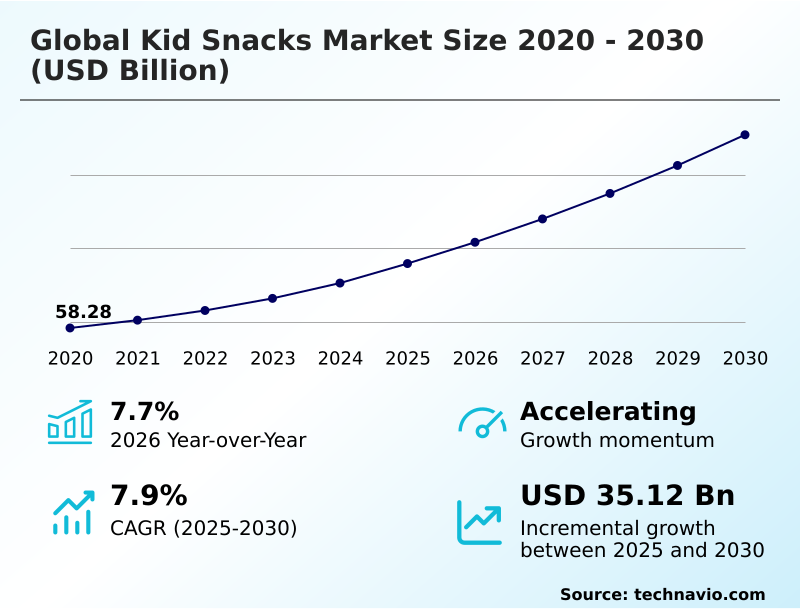
The kid snacks market size is valued to increase by USD 35.12 billion, at a CAGR of 7.9% from 2025 to 2030. Escalating parental emphasis on health, wellness, and nutritional transparency will drive the kid snacks market.

Major Market Trends & Insights

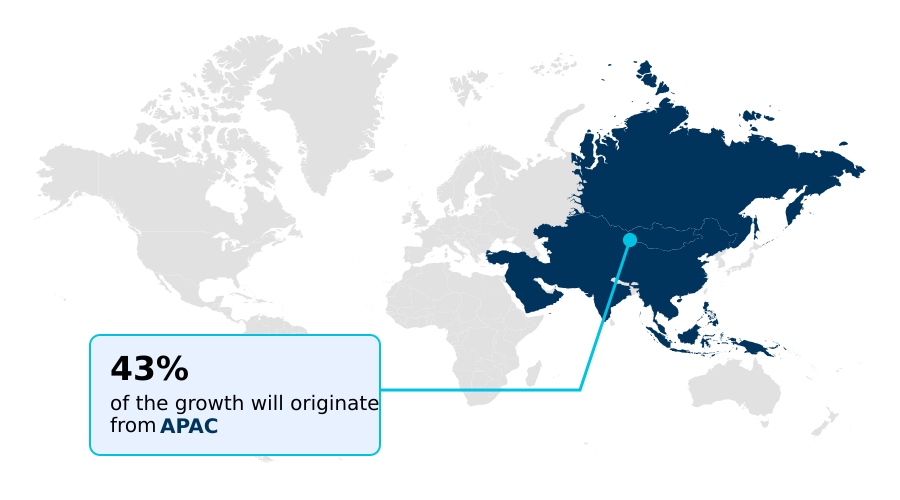
  • APAC dominated the market and accounted for a 42.6% growth during the forecast period.
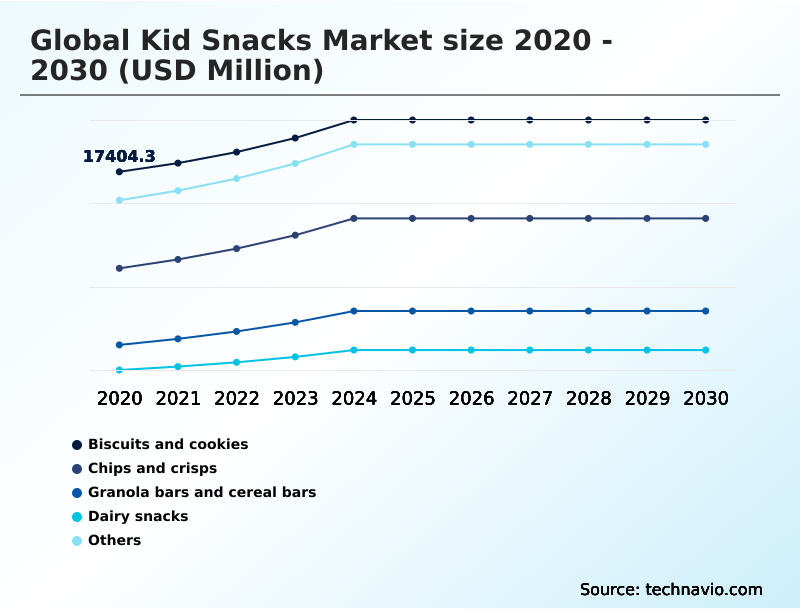
  • By Product Type - Biscuits and cookies segment was valued at USD 20.40 billion in 2024
  • By Distribution Channel - Supermarkets and hypermarkets segment accounted for the largest market revenue share in 2024

Market Size & Forecast

  • Market Opportunities: USD 52.68 billion
  • Market Future Opportunities: USD 35.12 billion
  • CAGR from 2025 to 2030 : 7.9%

Market Summary

  • The kid snacks market is undergoing a profound transformation, moving beyond simple treats to address a complex set of parental demands for health and convenience. The industry is now defined by a pivot towards clean-label formulation and snacks fortified with beneficial compounds.
  • This shift necessitates a complete overhaul of sourcing and production, as seen when companies re-engineer their supply chains to guarantee non-gmo ingredients and secure organic certification. This process, while increasing operational costs, is crucial for building consumer trust and mitigating the significant financial risks associated with product recalls due to contaminants.
  • The demand for on-the-go snacking solutions continues to grow, but now these products must also deliver tangible nutritional benefits, incorporating high-fiber snacks and plant-based proteins. Success in this evolving landscape depends on a brand's ability to seamlessly integrate nutritional science with the practical needs of modern family life, delivering products that are both trustworthy and convenient.
  • This balance is the new benchmark for innovation and market leadership, forcing companies to rethink value beyond just price and flavor.

What will be the Size of the Kid Snacks Market during the forecast period?

Get Key Insights on Market Forecast (PDF) Request Free Sample

How is the Kid Snacks Market Segmented?

The kid snacks industry research report provides comprehensive data (region-wise segment analysis), with forecasts and estimates in "USD million" for the period 2026-2030, as well as historical data from 2020-2024 for the following segments.

  • Product type
    • Biscuits and cookies
    • Chips and crisps
    • Granola bars and cereal bars
    • Dairy snacks
    • Others
  • Distribution channel
    • Supermarkets and hypermarkets
    • Convenience stores
    • Online Retail
    • Specialty stores
    • Others
  • Source
    • Conventional
    • Organic
  • Geography
    • APAC
      • China
      • India
      • Japan
    • North America
      • US
      • Canada
      • Mexico
    • Europe
      • Germany
      • UK
      • France
    • South America
      • Brazil
      • Argentina
      • Colombia
    • Middle East and Africa
      • South Africa
      • Saudi Arabia
      • UAE
    • Rest of World (ROW)

By Product Type Insights

The biscuits and cookies segment is estimated to witness significant growth during the forecast period.

The biscuits and cookies segment is undergoing a significant evolution, driven by parental demand for healthier options. Manufacturers are now focused on sugar reduction strategy and replacing refined flours with whole grain snacks.

To meet consumer expectations for clean-label formulation, there's a strong emphasis on using natural food colors and non-gmo ingredients. Fortified ingredients are increasingly added to improve nutritional value, making these treats suitable as healthy school lunchbox ideas.

However, the core challenge remains balancing this nutritional pivot with the classic child-friendly flavors and textures kids expect.

Reformulation efforts have enabled some brands to lower sugar content by 30% without compromising taste, a key performance indicator in this competitive space. This shift reflects a broader market movement toward functional snacking and dairy-free alternatives.

Request Free Sample

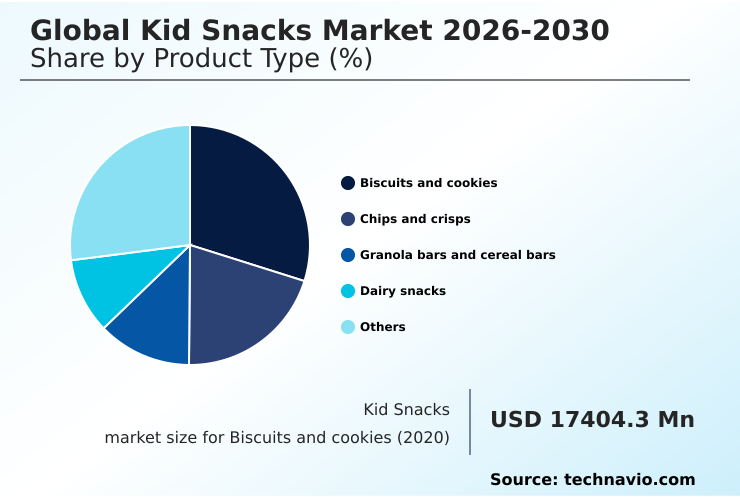
The Biscuits and cookies segment was valued at USD 20.40 billion in 2024 and showed a gradual increase during the forecast period.

Request Free Sample

Regional Analysis

APAC is estimated to contribute 42.6% to the growth of the global market during the forecast period.Technavio’s analysts have elaborately explained the regional trends and drivers that shape the market during the forecast period.

See How Kid Snacks Market Demand is Rising in APAC Request Free Sample

The global landscape for kid snacks presents a study in contrasts, with regional dynamics shaping innovation and market strategy.

In mature markets like North America, the demand is intense for allergen-free snacks and plant-based protein snacks to meet specific health and lifestyle needs.

In contrast, the high-growth APAC region is driven by rising disposable incomes and an increasing demand for convenient, fortified snacks.

Across Europe, adapting to diverse front-of-pack labeling (FOPL) schemes can increase compliance costs by an average of 20% for manufacturers, a significant operational hurdle.

In APAC, however, successful localization of child-friendly flavors has boosted market penetration by over 15% in key urban centers.

This geographic divergence requires a nuanced approach, balancing the push for high-fiber snacks and low-sodium formulation with regional taste preferences and regulatory realities.

Market Dynamics

Our researchers analyzed the data with 2025 as the base year, along with the key drivers, trends, and challenges. A holistic analysis of drivers will help companies refine their marketing strategies to gain a competitive advantage.

  • Navigating the modern kid snacks market requires a multifaceted strategy that addresses complex consumer and regulatory pressures. The impact of HFSS regulations on kid snacks is forcing a widespread reformulation, making the ability to navigate front-of-pack labels for kid snacks a critical operational skill.
  • This regulatory environment amplifies the consumer perception of ultra-processed kid snacks, creating significant challenges in reducing sugar in baked snacks and formulating snacks without artificial preservatives.
  • Forward-thinking companies are turning these challenges into opportunities by focusing on the opportunities in the functional kid snacks market, exploring the benefits of probiotic snacks for children and developing DHA fortified snacks for brain development.
  • Success hinges on clear strategies for launching a new kid snack, which often involves leveraging the growth of direct-to-consumer kid snack brands to bypass crowded retail shelves. Marketing snacks to millennial parents requires a deep understanding of their values, from comparing organic vs conventional kid snacks to appreciating innovations in sustainable snack packaging.
  • Companies that understand the nuanced role of texture in childrens snack preferences, a factor that can double product acceptance rates compared to focusing on flavor alone, will gain a distinct advantage. This extends to catering to the demand for savory kid snacks and low-glycemic snacks for childrens energy.
  • Furthermore, the impact of character licensing on snack sales remains a powerful tool, while the supply chain for allergen-free snack production presents both a challenge and a significant growth area for specialized plant-based snack options for kids with allergies.

What are the key market drivers leading to the rise in the adoption of Kid Snacks Industry?

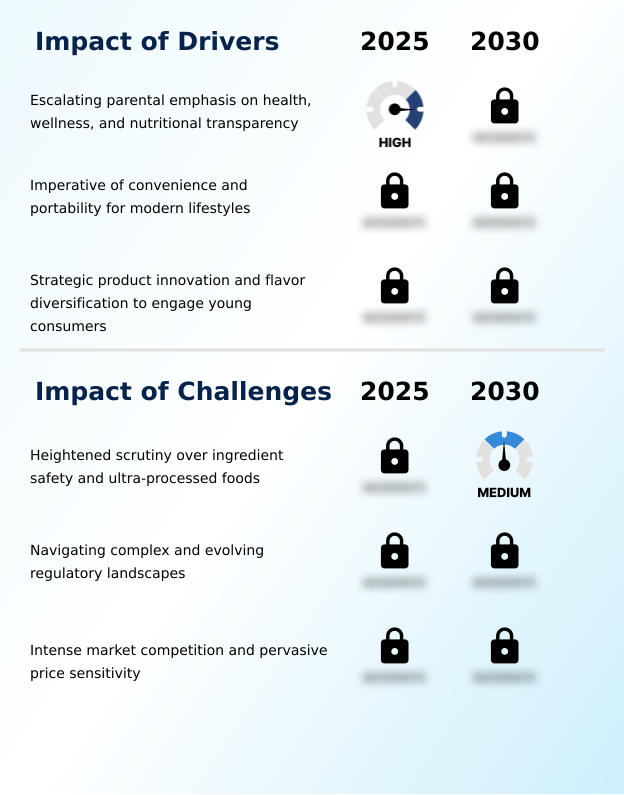
  • The market is primarily driven by an escalating parental emphasis on health, wellness, and nutritional transparency in children's snack choices.

  • Parental demand for healthy and convenient options remains the primary market driver. The need for on-the-go snacking solutions and convenient after-school snacks has made portability a key product attribute.
  • The adoption of easy-to-open snack packaging has been linked to a 10% increase in consumption frequency by young children, boosting overall volume.
  • Brands offering snacks that align with a healthy profile report a 25% faster sell-through rate in major supermarket chains. This driver is also influencing ingredients, with a strong preference for non-gmo ingredients and products that feature hidden vegetable snack recipes.
  • Formats that promise mess-free consumption and portion-controlled packaging are no longer niche but have become standard expectations for busy families seeking to balance nutrition with practicality in their daily routines, shaping the entire product development lifecycle.

What are the market trends shaping the Kid Snacks Industry?

  • A significant market trend is the increasing consumer prioritization of nutrition over simple indulgence. This shift is reshaping product development and marketing strategies across the industry.

  • Dietary inclusivity is a dominant trend, compelling manufacturers to innovate beyond traditional formulations. The demand for allergen-free snacks and nut-free classroom snacks is surging, driving a 20% higher repeat purchase rate for brands with clear 'free-from' labeling.
  • This movement is not limited to allergies; the rise of plant-based diets has spurred the development of dairy-free alternatives and plant-based snacks for children. The incorporation of nutrient-dense ingredients has enabled brands to achieve a 15% price premium in specialty retail.
  • A core component of this trend is a rigorous sugar reduction strategy, evident in the popularity of organic fruit snacks for toddlers and other low-sugar options. This health-forward movement is creating significant opportunities for brands that can deliver on safety, lifestyle choice, and nutritional value, with gluten-free crackers for kids becoming a staple.

What challenges does the Kid Snacks Industry face during its growth?

  • A key challenge affecting industry growth is the heightened scrutiny over ingredient safety and the health implications of ultra-processed foods.

  • Intense scrutiny over ingredients and processing presents a significant market challenge. The negative consumer perception surrounding ultra-processed foods (UPFs) puts pressure on brands to deliver clean-label formulation, which can increase R&D investment by over 50% compared to a simple flavor extension.
  • Navigating divergent international regulations for front-of-pack labeling (FOPL) can increase product launch costs by up to 35% for companies expanding globally. These complexities challenge manufacturers to achieve a difficult balance, delivering the taste and texture expected in high-protein snacks for active kids while adhering to strict low-sodium formulation guidelines.
  • The push for wholesome options means even developing the best on-the-go snacks for travel requires a deep focus on nutritional transparency and simpler processing methods to maintain consumer trust and avoid regulatory hurdles.

Exclusive Technavio Analysis on Customer Landscape

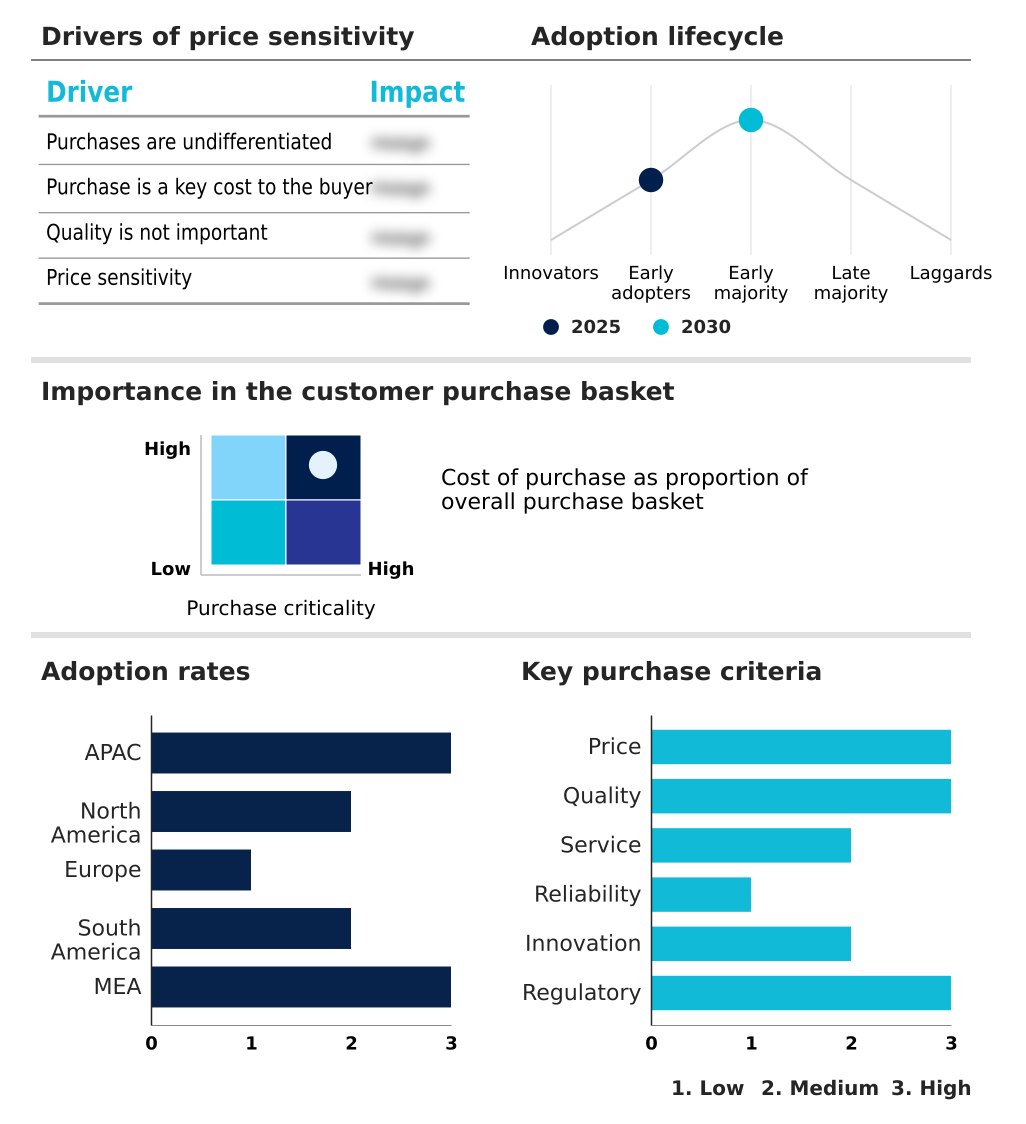
The kid snacks market forecasting report includes the adoption lifecycle of the market, covering from the innovator’s stage to the laggard’s stage. It focuses on adoption rates in different regions based on penetration. Furthermore, the kid snacks market report also includes key purchase criteria and drivers of price sensitivity to help companies evaluate and develop their market growth analysis strategies.

Customer Landscape of Kid Snacks Industry

Competitive Landscape

Companies are implementing various strategies, such as strategic alliances, kid snacks market forecast, partnerships, mergers and acquisitions, geographical expansion, and product/service launches, to enhance their presence in the industry.

Britannia Industries Ltd. - Key offerings include iconic crackers and cookies, alongside a portfolio of organic snacks catering to babies and toddlers, reflecting a focus on mainstream and health-conscious segments.

The industry research and growth report includes detailed analyses of the competitive landscape of the market and information about key companies, including:

  • Britannia Industries Ltd.
  • Campbell Soup Co.
  • Clif Bar and Co.
  • Conagra Brands Inc.
  • Corporativo Bimbo SA de CV
  • Danone S.A.
  • Ferrero International S.A.
  • General Mills Inc.
  • Intersnack Group GmbH and Co. KG
  • Kellanova
  • Mars Inc.
  • Mondelez International Inc.
  • Nestle SA
  • PepsiCo Inc.
  • The Hain Celestial Group
  • The Hershey Co.
  • The J.M. Smucker Co.
  • The Kraft Heinz Co
  • Unilever PLC
  • Utz Brands

Qualitative and quantitative analysis of companies has been conducted to help clients understand the wider business environment as well as the strengths and weaknesses of key industry players. Data is qualitatively analyzed to categorize companies as pure play, category-focused, industry-focused, and diversified; it is quantitatively analyzed to categorize companies as dominant, leading, strong, tentative, and weak.

Recent Development and News in Kid snacks market

  • In August, 2024, PepsiCo Inc. launched a new line of baked veggie straws under its Frito-Lay division, formulated with 40% less sodium to meet parental demand for healthier savory snacks.
  • In November, 2024, Mondelez International Inc. entered a strategic partnership with a plant-based ingredient firm to develop a new line of dairy-free, protein-fortified snack bars for children.
  • In February, 2025, The Kraft Heinz Co. acquired a fast-growing startup specializing in organic, cold-pressed fruit and vegetable pouches, bolstering its portfolio in the clean-label snacking segment.
  • In May, 2025, General Mills Inc. announced it had achieved its goal of sourcing 100% cage-free eggs for all its baked snack lines, responding to consumer focus on ethical sourcing.

Dive into Technavio’s robust research methodology, blending expert interviews, extensive data synthesis, and validated models for unparalleled Kid Snacks Market insights. See full methodology.

Market Scope
Page number 321
Base year 2025
Historic period 2020-2024
Forecast period 2026-2030
Growth momentum & CAGR Accelerate at a CAGR of 7.9%
Market growth 2026-2030 USD 35115.7 million
Market structure Fragmented
YoY growth 2025-2026(%) 7.7%
Key countries China, India, Japan, South Korea, Australia, Indonesia, US, Canada, Mexico, Germany, UK, France, Italy, The Netherlands, Spain, Brazil, Argentina, Colombia, South Africa, Saudi Arabia, UAE, Israel and Turkey
Competitive landscape Leading Companies, Market Positioning of Companies, Competitive Strategies, and Industry Risks

Request Free Sample

Research Analyst Overview

  • The kid snacks market's trajectory is now dictated by a consumer-led push for nutritional integrity and transparency, compelling a strategic pivot at the boardroom level. The focus is on product development that prioritizes clean-label formulation, incorporating non-gmo ingredients and fortified ingredients to create genuinely functional snacking options.
  • This evolution away from traditional treats towards whole grain snacks, high-fiber snacks, and low-sodium formulation is reshaping portfolios. Adherence to new health standards is not optional; avoiding regulatory penalties, which can cost brands up to 5% of their marketing budgets, is a significant financial incentive. The rise of dairy-free alternatives and plant-based protein snacks reflects a broader dietary shift.
  • This landscape demands innovation in every aspect, from textural innovation and the use of natural food colors to the adoption of sustainable packaging solutions and portion-controlled packaging.
  • Success is no longer measured just by taste but by a product's alignment with a health-conscious ethos, encompassing everything from organic certification to the development of probiotic-fortified snacks and mess-free consumption formats that fit modern lifestyles. This shift pressures brands to deliver on-the-go snacking solutions without compromising on health.

What are the Key Data Covered in this Kid Snacks Market Research and Growth Report?

  • What is the expected growth of the Kid Snacks Market between 2026 and 2030?

    • USD 35.12 billion, at a CAGR of 7.9%

  • What segmentation does the market report cover?

    • The report is segmented by Product Type (Biscuits and cookies, Chips and crisps, Granola bars and cereal bars, Dairy snacks, and Others), Distribution Channel (Supermarkets and hypermarkets, Convenience stores, Online Retail, Specialty stores, and Others), Source (Conventional, and Organic) and Geography (APAC, North America, Europe, South America, Middle East and Africa)

  • Which regions are analyzed in the report?

    • APAC, North America, Europe, South America and Middle East and Africa

  • What are the key growth drivers and market challenges?

    • Escalating parental emphasis on health, wellness, and nutritional transparency, Heightened scrutiny over ingredient safety and ultra-processed foods

  • Who are the major players in the Kid Snacks Market?

    • Britannia Industries Ltd., Campbell Soup Co., Clif Bar and Co., Conagra Brands Inc., Corporativo Bimbo SA de CV, Danone S.A., Ferrero International S.A., General Mills Inc., Intersnack Group GmbH and Co. KG, Kellanova, Mars Inc., Mondelez International Inc., Nestle SA, PepsiCo Inc., The Hain Celestial Group, The Hershey Co., The J.M. Smucker Co., The Kraft Heinz Co, Unilever PLC and Utz Brands

Market Research Insights

  • Market dynamics are increasingly shaped by parental demand for convenient after-school snacks and healthy school lunchbox ideas that meet stringent nutritional standards. The move towards products with hidden vegetable snack recipes and fortified ingredients reflects a significant shift in purchasing behavior. Brands adopting transparent, clean-label formulations have seen customer loyalty increase by up to 25% compared to competitors.
  • Furthermore, the integration of sustainable packaging solutions has been shown to improve brand perception among millennial parents by over 30%, directly influencing purchasing decisions. This focus on both health and ethics is compelling companies to innovate beyond traditional offerings, with offerings like a toddler snack subscription box becoming a popular way to provide curated, healthy options.
  • The demand for low-sugar yogurt for kids and other nutritionally superior products is now a primary driver of product development and market positioning.

We can help! Our analysts can customize this kid snacks market research report to meet your requirements.

Get in touch

1. Executive Summary

1.1 Market overview

Executive Summary - Chart on Market Overview
Executive Summary - Data Table on Market Overview
Executive Summary - Chart on Global Market Characteristics
Executive Summary - Chart on Market by Geography
Executive Summary - Chart on Market Segmentation by Product Type
Executive Summary - Chart on Market Segmentation by Distribution Channel
Executive Summary - Chart on Market Segmentation by Source
Executive Summary - Chart on Incremental Growth
Executive Summary - Data Table on Incremental Growth
Executive Summary - Chart on Company Market Positioning

2. Technavio Analysis

2.1 Analysis of price sensitivity, lifecycle, customer purchase basket, adoption rates, and purchase criteria

2.2 Criticality of inputs and Factors of differentiation

Chart on Overview on criticality of inputs and factors of differentiation

2.3 Factors of disruption

Chart on Overview on factors of disruption

2.4 Impact of drivers and challenges

Chart on Impact of drivers and challenges in 2025 and 2030

3. Market Landscape

3.1 Market ecosystem

Chart on Parent Market
Data Table on - Parent Market

3.2 Market characteristics

Chart on Market characteristics analysis

3.3 Value chain analysis

Chart on Value chain analysis

4. Market Sizing

4.1 Market definition

Data Table on Offerings of companies included in the market definition

4.2 Market segment analysis

Market segments

4.3 Market size 2025

4.4 Market outlook: Forecast for 2025-2030

Chart on Global - Market size and forecast 2025-2030 ($ million)
Data Table on Global - Market size and forecast 2025-2030 ($ million)
Chart on Global Market: Year-over-year growth 2025-2030 (%)
Data Table on Global Market: Year-over-year growth 2025-2030 (%)

5. Historic Market Size

5.1 Global Kid Snacks Market 2020 - 2024

Historic Market Size - Data Table on Global Kid Snacks Market 2020 - 2024 ($ million)

5.2 Product Type segment analysis 2020 - 2024

Historic Market Size - Product Type Segment 2020 - 2024 ($ million)

5.3 Distribution Channel segment analysis 2020 - 2024

Historic Market Size - Distribution Channel Segment 2020 - 2024 ($ million)

5.4 Source segment analysis 2020 - 2024

Historic Market Size - Source Segment 2020 - 2024 ($ million)

5.5 Geography segment analysis 2020 - 2024

Historic Market Size - Geography Segment 2020 - 2024 ($ million)

5.6 Country segment analysis 2020 - 2024

Historic Market Size - Country Segment 2020 - 2024 ($ million)

6. Qualitative Analysis

6.1 Impact of AI on Global Kid Snacks Market

7. Five Forces Analysis

7.1 Five forces summary

Five forces analysis - Comparison between 2025 and 2030

7.2 Bargaining power of buyers

Bargaining power of buyers - Impact of key factors 2025 and 2030

7.3 Bargaining power of suppliers

Bargaining power of suppliers - Impact of key factors in 2025 and 2030

7.4 Threat of new entrants

Threat of new entrants - Impact of key factors in 2025 and 2030

7.5 Threat of substitutes

Threat of substitutes - Impact of key factors in 2025 and 2030

7.6 Threat of rivalry

Threat of rivalry - Impact of key factors in 2025 and 2030

7.7 Market condition

Chart on Market condition - Five forces 2025 and 2030

8. Market Segmentation by Product Type

8.1 Market segments

Chart on Product Type - Market share 2025-2030 (%)
Data Table on Product Type - Market share 2025-2030 (%)

8.2 Comparison by Product Type

Chart on Comparison by Product Type
Data Table on Comparison by Product Type

8.3 Biscuits and cookies - Market size and forecast 2025-2030

Chart on Biscuits and cookies - Market size and forecast 2025-2030 ($ million)
Data Table on Biscuits and cookies - Market size and forecast 2025-2030 ($ million)
Chart on Biscuits and cookies - Year-over-year growth 2025-2030 (%)
Data Table on Biscuits and cookies - Year-over-year growth 2025-2030 (%)

8.4 Chips and crisps - Market size and forecast 2025-2030

Chart on Chips and crisps - Market size and forecast 2025-2030 ($ million)
Data Table on Chips and crisps - Market size and forecast 2025-2030 ($ million)
Chart on Chips and crisps - Year-over-year growth 2025-2030 (%)
Data Table on Chips and crisps - Year-over-year growth 2025-2030 (%)

8.5 Granola bars and cereal bars - Market size and forecast 2025-2030

Chart on Granola bars and cereal bars - Market size and forecast 2025-2030 ($ million)
Data Table on Granola bars and cereal bars - Market size and forecast 2025-2030 ($ million)
Chart on Granola bars and cereal bars - Year-over-year growth 2025-2030 (%)
Data Table on Granola bars and cereal bars - Year-over-year growth 2025-2030 (%)

8.6 Dairy snacks - Market size and forecast 2025-2030

Chart on Dairy snacks - Market size and forecast 2025-2030 ($ million)
Data Table on Dairy snacks - Market size and forecast 2025-2030 ($ million)
Chart on Dairy snacks - Year-over-year growth 2025-2030 (%)
Data Table on Dairy snacks - Year-over-year growth 2025-2030 (%)

8.7 Others - Market size and forecast 2025-2030

Chart on Others - Market size and forecast 2025-2030 ($ million)
Data Table on Others - Market size and forecast 2025-2030 ($ million)
Chart on Others - Year-over-year growth 2025-2030 (%)
Data Table on Others - Year-over-year growth 2025-2030 (%)

8.8 Market opportunity by Product Type

Market opportunity by Product Type ($ million)
Data Table on Market opportunity by Product Type ($ million)

9. Market Segmentation by Distribution Channel

9.1 Market segments

Chart on Distribution Channel - Market share 2025-2030 (%)
Data Table on Distribution Channel - Market share 2025-2030 (%)

9.2 Comparison by Distribution Channel

Chart on Comparison by Distribution Channel
Data Table on Comparison by Distribution Channel

9.3 Supermarkets and hypermarkets - Market size and forecast 2025-2030

Chart on Supermarkets and hypermarkets - Market size and forecast 2025-2030 ($ million)
Data Table on Supermarkets and hypermarkets - Market size and forecast 2025-2030 ($ million)
Chart on Supermarkets and hypermarkets - Year-over-year growth 2025-2030 (%)
Data Table on Supermarkets and hypermarkets - Year-over-year growth 2025-2030 (%)

9.4 Convenience stores - Market size and forecast 2025-2030

Chart on Convenience stores - Market size and forecast 2025-2030 ($ million)
Data Table on Convenience stores - Market size and forecast 2025-2030 ($ million)
Chart on Convenience stores - Year-over-year growth 2025-2030 (%)
Data Table on Convenience stores - Year-over-year growth 2025-2030 (%)

9.5 Online Retail - Market size and forecast 2025-2030

Chart on Online Retail - Market size and forecast 2025-2030 ($ million)
Data Table on Online Retail - Market size and forecast 2025-2030 ($ million)
Chart on Online Retail - Year-over-year growth 2025-2030 (%)
Data Table on Online Retail - Year-over-year growth 2025-2030 (%)

9.6 Specialty stores - Market size and forecast 2025-2030

Chart on Specialty stores - Market size and forecast 2025-2030 ($ million)
Data Table on Specialty stores - Market size and forecast 2025-2030 ($ million)
Chart on Specialty stores - Year-over-year growth 2025-2030 (%)
Data Table on Specialty stores - Year-over-year growth 2025-2030 (%)

9.7 Others - Market size and forecast 2025-2030

Chart on Others - Market size and forecast 2025-2030 ($ million)
Data Table on Others - Market size and forecast 2025-2030 ($ million)
Chart on Others - Year-over-year growth 2025-2030 (%)
Data Table on Others - Year-over-year growth 2025-2030 (%)

9.8 Market opportunity by Distribution Channel

Market opportunity by Distribution Channel ($ million)
Data Table on Market opportunity by Distribution Channel ($ million)

10. Market Segmentation by Source

10.1 Market segments

Chart on Source - Market share 2025-2030 (%)
Data Table on Source - Market share 2025-2030 (%)

10.2 Comparison by Source

Chart on Comparison by Source
Data Table on Comparison by Source

10.3 Conventional - Market size and forecast 2025-2030

Chart on Conventional - Market size and forecast 2025-2030 ($ million)
Data Table on Conventional - Market size and forecast 2025-2030 ($ million)
Chart on Conventional - Year-over-year growth 2025-2030 (%)
Data Table on Conventional - Year-over-year growth 2025-2030 (%)

10.4 Organic - Market size and forecast 2025-2030

Chart on Organic - Market size and forecast 2025-2030 ($ million)
Data Table on Organic - Market size and forecast 2025-2030 ($ million)
Chart on Organic - Year-over-year growth 2025-2030 (%)
Data Table on Organic - Year-over-year growth 2025-2030 (%)

10.5 Market opportunity by Source

Market opportunity by Source ($ million)
Data Table on Market opportunity by Source ($ million)

11. Customer Landscape

11.1 Customer landscape overview

Analysis of price sensitivity, lifecycle, customer purchase basket, adoption rates, and purchase criteria

12. Geographic Landscape

12.1 Geographic segmentation

Chart on Market share by geography 2025-2030 (%)
Data Table on Market share by geography 2025-2030 (%)

12.2 Geographic comparison

Chart on Geographic comparison
Data Table on Geographic comparison

12.3 APAC - Market size and forecast 2025-2030

Chart on APAC - Market size and forecast 2025-2030 ($ million)
Data Table on APAC - Market size and forecast 2025-2030 ($ million)
Chart on APAC - Year-over-year growth 2025-2030 (%)
Data Table on APAC - Year-over-year growth 2025-2030 (%)
Chart on Regional Comparison - APAC
Data Table on Regional Comparison - APAC

12.3.1 China - Market size and forecast 2025-2030

Chart on China - Market size and forecast 2025-2030 ($ million)
Data Table on China - Market size and forecast 2025-2030 ($ million)
Chart on China - Year-over-year growth 2025-2030 (%)
Data Table on China - Year-over-year growth 2025-2030 (%)

12.3.2 India - Market size and forecast 2025-2030

Chart on India - Market size and forecast 2025-2030 ($ million)
Data Table on India - Market size and forecast 2025-2030 ($ million)
Chart on India - Year-over-year growth 2025-2030 (%)
Data Table on India - Year-over-year growth 2025-2030 (%)

12.3.3 Japan - Market size and forecast 2025-2030

Chart on Japan - Market size and forecast 2025-2030 ($ million)
Data Table on Japan - Market size and forecast 2025-2030 ($ million)
Chart on Japan - Year-over-year growth 2025-2030 (%)
Data Table on Japan - Year-over-year growth 2025-2030 (%)

12.3.4 South Korea - Market size and forecast 2025-2030

Chart on South Korea - Market size and forecast 2025-2030 ($ million)
Data Table on South Korea - Market size and forecast 2025-2030 ($ million)
Chart on South Korea - Year-over-year growth 2025-2030 (%)
Data Table on South Korea - Year-over-year growth 2025-2030 (%)

12.3.5 Australia - Market size and forecast 2025-2030

Chart on Australia - Market size and forecast 2025-2030 ($ million)
Data Table on Australia - Market size and forecast 2025-2030 ($ million)
Chart on Australia - Year-over-year growth 2025-2030 (%)
Data Table on Australia - Year-over-year growth 2025-2030 (%)

12.3.6 Indonesia - Market size and forecast 2025-2030

Chart on Indonesia - Market size and forecast 2025-2030 ($ million)
Data Table on Indonesia - Market size and forecast 2025-2030 ($ million)
Chart on Indonesia - Year-over-year growth 2025-2030 (%)
Data Table on Indonesia - Year-over-year growth 2025-2030 (%)

12.4 North America - Market size and forecast 2025-2030

Chart on North America - Market size and forecast 2025-2030 ($ million)
Data Table on North America - Market size and forecast 2025-2030 ($ million)
Chart on North America - Year-over-year growth 2025-2030 (%)
Data Table on North America - Year-over-year growth 2025-2030 (%)
Chart on Regional Comparison - North America
Data Table on Regional Comparison - North America

12.4.1 US - Market size and forecast 2025-2030

Chart on US - Market size and forecast 2025-2030 ($ million)
Data Table on US - Market size and forecast 2025-2030 ($ million)
Chart on US - Year-over-year growth 2025-2030 (%)
Data Table on US - Year-over-year growth 2025-2030 (%)

12.4.2 Canada - Market size and forecast 2025-2030

Chart on Canada - Market size and forecast 2025-2030 ($ million)
Data Table on Canada - Market size and forecast 2025-2030 ($ million)
Chart on Canada - Year-over-year growth 2025-2030 (%)
Data Table on Canada - Year-over-year growth 2025-2030 (%)

12.4.3 Mexico - Market size and forecast 2025-2030

Chart on Mexico - Market size and forecast 2025-2030 ($ million)
Data Table on Mexico - Market size and forecast 2025-2030 ($ million)
Chart on Mexico - Year-over-year growth 2025-2030 (%)
Data Table on Mexico - Year-over-year growth 2025-2030 (%)

12.5 Europe - Market size and forecast 2025-2030

Chart on Europe - Market size and forecast 2025-2030 ($ million)
Data Table on Europe - Market size and forecast 2025-2030 ($ million)
Chart on Europe - Year-over-year growth 2025-2030 (%)
Data Table on Europe - Year-over-year growth 2025-2030 (%)
Chart on Regional Comparison - Europe
Data Table on Regional Comparison - Europe

12.5.1 Germany - Market size and forecast 2025-2030

Chart on Germany - Market size and forecast 2025-2030 ($ million)
Data Table on Germany - Market size and forecast 2025-2030 ($ million)
Chart on Germany - Year-over-year growth 2025-2030 (%)
Data Table on Germany - Year-over-year growth 2025-2030 (%)

12.5.2 UK - Market size and forecast 2025-2030

Chart on UK - Market size and forecast 2025-2030 ($ million)
Data Table on UK - Market size and forecast 2025-2030 ($ million)
Chart on UK - Year-over-year growth 2025-2030 (%)
Data Table on UK - Year-over-year growth 2025-2030 (%)

12.5.3 France - Market size and forecast 2025-2030

Chart on France - Market size and forecast 2025-2030 ($ million)
Data Table on France - Market size and forecast 2025-2030 ($ million)
Chart on France - Year-over-year growth 2025-2030 (%)
Data Table on France - Year-over-year growth 2025-2030 (%)

12.5.4 Italy - Market size and forecast 2025-2030

Chart on Italy - Market size and forecast 2025-2030 ($ million)
Data Table on Italy - Market size and forecast 2025-2030 ($ million)
Chart on Italy - Year-over-year growth 2025-2030 (%)
Data Table on Italy - Year-over-year growth 2025-2030 (%)

12.5.5 The Netherlands - Market size and forecast 2025-2030

Chart on The Netherlands - Market size and forecast 2025-2030 ($ million)
Data Table on The Netherlands - Market size and forecast 2025-2030 ($ million)
Chart on The Netherlands - Year-over-year growth 2025-2030 (%)
Data Table on The Netherlands - Year-over-year growth 2025-2030 (%)

12.5.6 Spain - Market size and forecast 2025-2030

Chart on Spain - Market size and forecast 2025-2030 ($ million)
Data Table on Spain - Market size and forecast 2025-2030 ($ million)
Chart on Spain - Year-over-year growth 2025-2030 (%)
Data Table on Spain - Year-over-year growth 2025-2030 (%)

12.6 South America - Market size and forecast 2025-2030

Chart on South America - Market size and forecast 2025-2030 ($ million)
Data Table on South America - Market size and forecast 2025-2030 ($ million)
Chart on South America - Year-over-year growth 2025-2030 (%)
Data Table on South America - Year-over-year growth 2025-2030 (%)
Chart on Regional Comparison - South America
Data Table on Regional Comparison - South America

12.6.1 Brazil - Market size and forecast 2025-2030

Chart on Brazil - Market size and forecast 2025-2030 ($ million)
Data Table on Brazil - Market size and forecast 2025-2030 ($ million)
Chart on Brazil - Year-over-year growth 2025-2030 (%)
Data Table on Brazil - Year-over-year growth 2025-2030 (%)

12.6.2 Argentina - Market size and forecast 2025-2030

Chart on Argentina - Market size and forecast 2025-2030 ($ million)
Data Table on Argentina - Market size and forecast 2025-2030 ($ million)
Chart on Argentina - Year-over-year growth 2025-2030 (%)
Data Table on Argentina - Year-over-year growth 2025-2030 (%)

12.6.3 Colombia - Market size and forecast 2025-2030

Chart on Colombia - Market size and forecast 2025-2030 ($ million)
Data Table on Colombia - Market size and forecast 2025-2030 ($ million)
Chart on Colombia - Year-over-year growth 2025-2030 (%)
Data Table on Colombia - Year-over-year growth 2025-2030 (%)

12.7 Middle East and Africa - Market size and forecast 2025-2030

Chart on Middle East and Africa - Market size and forecast 2025-2030 ($ million)
Data Table on Middle East and Africa - Market size and forecast 2025-2030 ($ million)
Chart on Middle East and Africa - Year-over-year growth 2025-2030 (%)
Data Table on Middle East and Africa - Year-over-year growth 2025-2030 (%)
Chart on Regional Comparison - Middle East and Africa
Data Table on Regional Comparison - Middle East and Africa

12.7.1 South Africa - Market size and forecast 2025-2030

Chart on South Africa - Market size and forecast 2025-2030 ($ million)
Data Table on South Africa - Market size and forecast 2025-2030 ($ million)
Chart on South Africa - Year-over-year growth 2025-2030 (%)
Data Table on South Africa - Year-over-year growth 2025-2030 (%)

12.7.2 Saudi Arabia - Market size and forecast 2025-2030

Chart on Saudi Arabia - Market size and forecast 2025-2030 ($ million)
Data Table on Saudi Arabia - Market size and forecast 2025-2030 ($ million)
Chart on Saudi Arabia - Year-over-year growth 2025-2030 (%)
Data Table on Saudi Arabia - Year-over-year growth 2025-2030 (%)

12.7.3 UAE - Market size and forecast 2025-2030

Chart on UAE - Market size and forecast 2025-2030 ($ million)
Data Table on UAE - Market size and forecast 2025-2030 ($ million)
Chart on UAE - Year-over-year growth 2025-2030 (%)
Data Table on UAE - Year-over-year growth 2025-2030 (%)

12.7.4 Israel - Market size and forecast 2025-2030

Chart on Israel - Market size and forecast 2025-2030 ($ million)
Data Table on Israel - Market size and forecast 2025-2030 ($ million)
Chart on Israel - Year-over-year growth 2025-2030 (%)
Data Table on Israel - Year-over-year growth 2025-2030 (%)

12.7.5 Turkey - Market size and forecast 2025-2030

Chart on Turkey - Market size and forecast 2025-2030 ($ million)
Data Table on Turkey - Market size and forecast 2025-2030 ($ million)
Chart on Turkey - Year-over-year growth 2025-2030 (%)
Data Table on Turkey - Year-over-year growth 2025-2030 (%)

12.8 Market opportunity by geography

Market opportunity by geography ($ million)
Data Tables on Market opportunity by geography ($ million)

13. Drivers, Challenges, and Opportunity

13.1 Market drivers

Escalating parental emphasis on health, wellness, and nutritional transparency
Imperative of convenience and portability for modern lifestyles
Strategic product innovation and flavor diversification to engage young consumers

13.2 Market challenges

Heightened scrutiny over ingredient safety and ultra-processed foods
Navigating complex and evolving regulatory landscapes
Intense market competition and pervasive price sensitivity

13.3 Impact of drivers and challenges

Impact of drivers and challenges in 2025 and 2030

13.4 Market opportunities

Consumers prioritizing nutrition over indulgence
Rise of dietary inclusivity
High demand for smart packaging and on-the-go solutions

14. Competitive Landscape

14.1 Overview

14.2

Overview on criticality of inputs and factors of differentiation

14.3 Landscape disruption

Overview on factors of disruption

14.4 Industry risks

Impact of key risks on business

15. Competitive Analysis

15.1 Companies profiled

Companies covered

15.2 Company ranking index

15.3 Market positioning of companies

Matrix on companies position and classification

15.4 Campbell Soup Co.

Campbell Soup Co. - Overview
Campbell Soup Co. - Business segments
Campbell Soup Co. - Key news
Campbell Soup Co. - Key offerings
Campbell Soup Co. - Segment focus
SWOT

15.5 Conagra Brands Inc.

Conagra Brands Inc. - Overview
Conagra Brands Inc. - Business segments
Conagra Brands Inc. - Key news
Conagra Brands Inc. - Key offerings
Conagra Brands Inc. - Segment focus
SWOT

15.6 Corporativo Bimbo SA de CV

Corporativo Bimbo SA de CV - Overview
Corporativo Bimbo SA de CV - Business segments
Corporativo Bimbo SA de CV - Key news
Corporativo Bimbo SA de CV - Key offerings
Corporativo Bimbo SA de CV - Segment focus
SWOT

15.7 Danone S.A.

Danone S.A. - Overview
Danone S.A. - Business segments
Danone S.A. - Key news
Danone S.A. - Key offerings
Danone S.A. - Segment focus
SWOT

15.8 Ferrero International S.A.

Ferrero International S.A. - Overview
Ferrero International S.A. - Product / Service
Ferrero International S.A. - Key news
Ferrero International S.A. - Key offerings
SWOT

15.9 General Mills Inc.

General Mills Inc. - Overview
General Mills Inc. - Business segments
General Mills Inc. - Key news
General Mills Inc. - Key offerings
General Mills Inc. - Segment focus
SWOT

15.10 Kellanova

Kellanova - Overview
Kellanova - Business segments
Kellanova - Key offerings
Kellanova - Segment focus
SWOT

15.11 Mars Inc.

Mars Inc. - Overview
Mars Inc. - Product / Service
Mars Inc. - Key news
Mars Inc. - Key offerings
SWOT

15.12 Mondelez International Inc.

Mondelez International Inc. - Overview
Mondelez International Inc. - Business segments
Mondelez International Inc. - Key news
Mondelez International Inc. - Key offerings
Mondelez International Inc. - Segment focus
SWOT

15.13 Nestle SA

Nestle SA - Overview
Nestle SA - Business segments
Nestle SA - Key news
Nestle SA - Key offerings
Nestle SA - Segment focus
SWOT

15.14 PepsiCo Inc.

PepsiCo Inc. - Overview
PepsiCo Inc. - Business segments
PepsiCo Inc. - Key news
PepsiCo Inc. - Key offerings
PepsiCo Inc. - Segment focus
SWOT

15.15 The Hershey Co.

The Hershey Co. - Overview
The Hershey Co. - Business segments
The Hershey Co. - Key news
The Hershey Co. - Key offerings
The Hershey Co. - Segment focus
SWOT

15.16 The J.M. Smucker Co.

The J.M. Smucker Co. - Overview
The J.M. Smucker Co. - Business segments
The J.M. Smucker Co. - Key news
The J.M. Smucker Co. - Key offerings
The J.M. Smucker Co. - Segment focus
SWOT

15.17 The Kraft Heinz Co

The Kraft Heinz Co - Overview
The Kraft Heinz Co - Business segments
The Kraft Heinz Co - Key news
The Kraft Heinz Co - Key offerings
The Kraft Heinz Co - Segment focus
SWOT

15.18 Unilever PLC

Unilever PLC - Overview
Unilever PLC - Business segments
Unilever PLC - Key offerings
Unilever PLC - Segment focus
SWOT

16. Appendix

16.1 Scope of the report

Market definition
Objectives
Notes and caveats

16.2 Inclusions and exclusions checklist

Inclusions checklist
Exclusions checklist

16.3 Currency conversion rates for US$

16.4 Research methodology

16.5 Data procurement

Information sources

16.6 Data validation

16.7 Validation techniques employed for market sizing

16.8 Data synthesis

16.9 360 degree market analysis

16.10 List of abbreviations

Research Methodology

Technavio presents a detailed picture of the market by way of study, synthesis, and summation of data from multiple sources. The analysts have presented the various facets of the market with a particular focus on identifying the key industry influencers. The data thus presented is comprehensive, reliable, and the result of extensive research, both primary and secondary.

INFORMATION SOURCES

Primary sources

  • Manufacturers and suppliers
  • Channel partners
  • Industry experts
  • Strategic decision makers

Secondary sources

  • Industry journals and periodicals
  • Government data
  • Financial reports of key industry players
  • Historical data
  • Press releases

DATA ANALYSIS

Data Synthesis

  • Collation of data
  • Estimation of key figures
  • Analysis of derived insights

Data Validation

  • Triangulation with data models
  • Reference against proprietary databases
  • Corroboration with industry experts

REPORT WRITING

Qualitative

  • Market drivers
  • Market challenges
  • Market trends
  • Five forces analysis

Quantitative

  • Market size and forecast
  • Market segmentation
  • Geographical insights
  • Competitive landscape

Interested in this report?

Get your sample now to see our research methodology and insights!

Download Now

Frequently Asked Questions

Kid Snacks market growth will increase by USD 35115.7 million during 2026-2030 .

The Kid Snacks market is expected to grow at a CAGR of 7.9% during 2026-2030 .

Kid Snacks market is segmented by Product type (Biscuits and cookies, Chips and crisps, Granola bars and cereal bars, Dairy snacks, Others) Distribution channel (Supermarkets and hypermarkets, Convenience stores, Online Retail, Specialty stores, Others) Source (Conventional, Organic)

Britannia Industries Ltd., Campbell Soup Co., Clif Bar and Co., Conagra Brands Inc., Corporativo Bimbo SA de CV, Danone S.A., Ferrero International S.A., General Mills Inc., Intersnack Group GmbH and Co. KG, Kellanova, Mars Inc., Mondelez International Inc., Nestle SA, PepsiCo Inc., The Hain Celestial Group, The Hershey Co., The J.M. Smucker Co., The Kraft Heinz Co, Unilever PLC, Utz Brands are a few of the key vendors in the Kid Snacks market.

APAC will register the highest growth rate of 42.6% among the other regions. Therefore, the Kid Snacks market in APAC is expected to garner significant business opportunities for the vendors during the forecast period.

China, India, Japan, South Korea, Australia, Indonesia, US, Canada, Mexico, Germany, UK, France, Italy, The Netherlands, Spain, Brazil, Argentina, Colombia, South Africa, Saudi Arabia, UAE, Israel, Turkey

  • Escalating parental emphasis on health, wellness, and nutritional transparency is the driving factor this market.

The Kid Snacks market vendors should focus on grabbing business opportunities from the Product type segment as it accounted for the largest market share in the base year.