
Yogurt Market Size 2025-2029
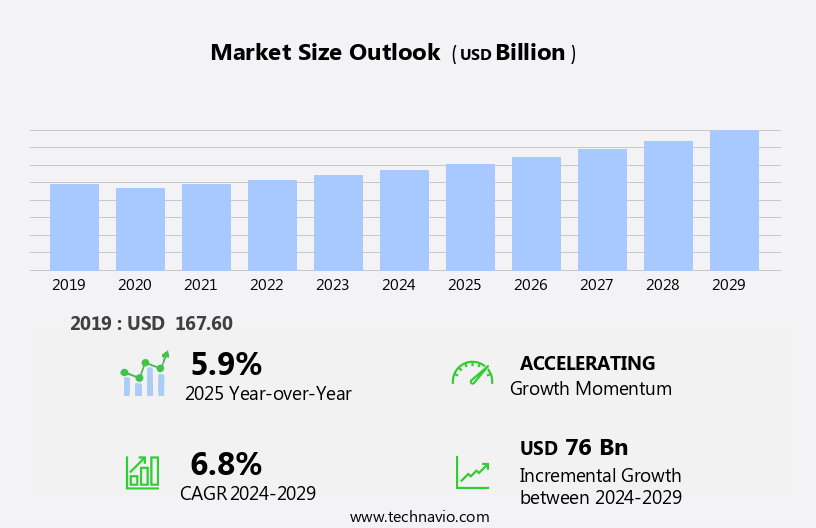
The yogurt market size is forecast to increase by USD 76 billion at a CAGR of 6.8% between 2024 and 2029.
- The market is experiencing significant growth, driven primarily by the health benefits associated with its consumption. Yogurt is renowned for its probiotic properties, which contribute to digestive health and boost the immune system. This health consciousness trend, coupled with the increasing popularity of plant-based diets, has led to a in demand for yogurt alternatives made from soy, almond, and other non-dairy sources. However, market expansion is not without challenges. Yogurt is known for its high protein content, probiotics, and thick, creamy texture, making it a popular choice among health-conscious consumers. Regulatory hurdles impact adoption, as stringent labeling requirements and safety standards can increase production costs. Furthermore, supply chain inconsistencies, particularly in sourcing raw materials and ensuring a steady supply of fresh milk, can temper growth potential. Greek yogurt, known for its thick and creamy texture, is preferred by fitness enthusiasts as a snack option due to its nutritional benefits.
- To capitalize on market opportunities, companies must navigate these challenges effectively by implementing robust supply chain management strategies and adhering to regulatory guidelines. Additionally, innovation remains key, with the incorporation of superfruits and other natural ingredients enhancing product offerings and catering to evolving consumer preferences.
What will be the Size of the Yogurt Market during the forecast period?
- In the dynamic market, various product offerings cater to diverse consumer preferences. Demographics and psychographics shape the demand for yogurt tubs, pouches, bars, and cups. Regulations, including microbiome and labeling requirements, influence production and marketing strategies. Yogurt alternatives, such as cashew, soy, almond, coconut, and vegan options, expand the market landscape. Consumption frequency is influenced by lifestyle choices and health benefits. Strawberry, as a popular flavor, dominates the market with strawberry flavored yogurt and berry-based yogurts being top choices.
- Yogurt's nutritional value, certifications, and shelf life are crucial factors in consumer decision-making. Yogurt lids and containers ensure convenience and freshness, while standards and storage considerations maintain product quality. The yogurt industry continues to evolve, responding to shifting consumer trends and expectations. Unique flavors and unique production methods, including automated production lines and the integration of Artificial Intelligence (AI) in online and e-commerce channels, have expanded the market.
How is this Yogurt Industry segmented?
The yogurt industry research report provides comprehensive data (region-wise segment analysis), with forecasts and estimates in "USD billion" for the period 2025-2029, as well as historical data from 2019-2023 for the following segments.
- Product
- Spoonable yogurt
- Drinkable yogurt
- Flavor
- Plain
- Flavored
- Form Factor
- Conventional yogurt
- Greek yogurt
- Set yogurt
- Frozen yogurt
- Yogurt drinks
- Distribution Channel
- Off-trade
- On-trade
- Geography
- North America
- US
- Canada
- Europe
- France
- Germany
- Italy
- UK
- APAC
- China
- India
- Japan
- South Korea
- Rest of World (ROW)
- North America
By Product Insights
The spoonable yogurt segment is estimated to witness significant growth during the forecast period. The spoonable the market encompasses yogurts that are meant to be spooned or squeezed, typically sold in cups or tubes. This category includes both refrigerated and frozen yogurts, with Greek yogurt being a significant segment. The thick and creamy consistency of spoonable yogurt, coupled with its numerous health benefits, has led to its increasing popularity among consumers. Applications of spoonable yogurt extend beyond consumption as a standalone snack, with its use in food and salad dressings further boosting demand. The in preference for Greek yogurt has been a primary growth driver for this market. As consumers continue to seek out new flavors and innovations, the demand for various yogurt offerings, such as low-fat, sugar-free, lactose-free, plant-based, and organic options, has risen. Artificial Intelligence (AI) and automated production lines have streamlined the manufacturing process, reducing costs and increasing efficiency in food service.
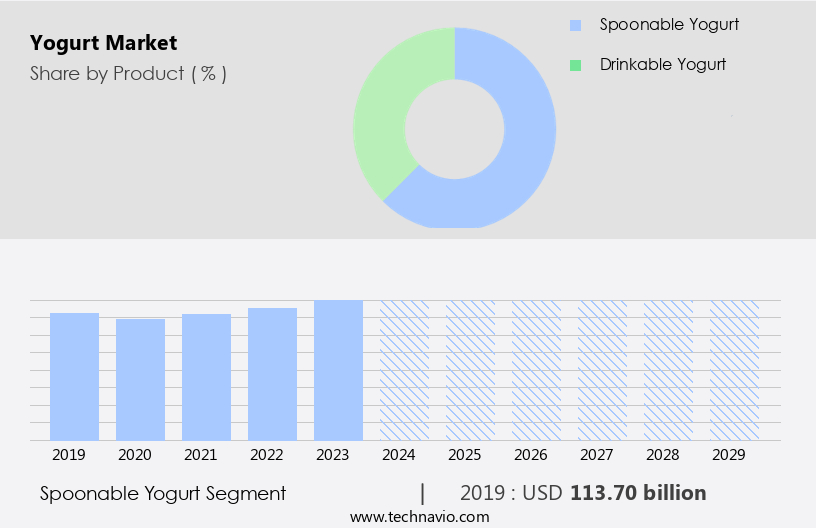
The Spoonable yogurt segment was valued at USD 113.70 billion in 2019 and showed a gradual increase during the forecast period. Yogurt's versatility as an ingredient in various dishes, including parfaits, dips, breakfast bowls, and even dinner options, has expanded its reach. Sustainability, safety, and quality are essential considerations for both retailers and consumers in the market. Processing techniques, such as fermentation and the use of starter cultures, play a crucial role in maintaining the desired consistency, taste, and texture of yogurt. The market also includes various packaging formats, including refrigerated, shelf-stable, and online sales channels. Yogurt brands continually innovate to cater to evolving consumer preferences, offering new flavors, textures, and health benefits. Yogurt's role as a source of calcium, protein, and immune support further strengthens its position as a popular and essential food item.
Regional Analysis
APAC is estimated to contribute 49% to the growth of the global market during the forecast period.Technavio's analysts have elaborately explained the regional trends and drivers that shape the market during the forecast period.
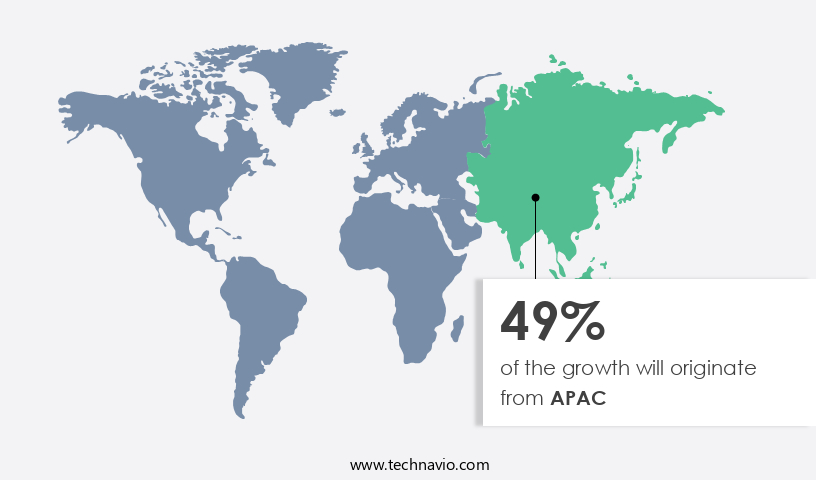
In the Asia Pacific region, major markets for yogurt include China, India, Australia, Vietnam, Japan, and New Zealand, showcasing significant growth potential. Factors fueling this expansion include an increasing preference for a health-conscious lifestyle, the rise of organized retail outlets, and the growing popularity of flavored yogurt beverages. The market is fragmented, with numerous regional and global players catering to the demand for both spoonable and drinkable yogurt. Key companies in APAC include COYO, DSG, Fonterra, Meiji, and Danone. International dairy companies are also capitalizing on the region's growing demand for yogurt, particularly in India. The health benefits of dairy products, including their nutritional value and role in a balanced diet, drive continued consumer demand.
Yogurt innovation continues to thrive, with offerings such as Greek yogurt, low-fat and sugar-free options, lactose-free alternatives, plant-based yogurt, and various flavors and textures. Yogurt processing and sustainability are essential considerations, with a focus on maintaining yogurt's natural consistency, calcium content, and cultured milk quality. Yogurt advertising and branding play a significant role in consumer choice, emphasizing taste, texture, safety, and immune support. Yogurt is versatile, used for breakfast, lunch, dinner, snacks, and desserts, as well as in smoothies and parfaits. Yogurt dips, starter cultures, and fermentation processes are also integral to the industry. Overall, the market in APAC is dynamic and evolving, driven by consumer preferences and the continuous pursuit of innovation.
Market Dynamics
Our researchers analyzed the data with 2024 as the base year, along with the key drivers, trends, and challenges. A holistic analysis of drivers will help companies refine their marketing strategies to gain a competitive advantage.
What are the Yogurt market drivers leading to the rise in the adoption of Industry?
- The health benefits associated with consuming yogurt serve as the primary driver for the market's growth. The market experiences steady growth due to increasing consumer health consciousness and the product's nutritional benefits. Yogurt is a fermented milk product created by adding Lactobacillus bulgaricus and Streptococcus thermophilus cultures to milk, resulting in the production of lactic acid. This process thickens the milk, giving it a distinctive sour taste and a rich source of protein, calcium, and potassium. Innovation in the yogurt industry includes lactose-free options, plant-based alternatives, and various flavors catering to diverse consumer preferences.
- Yogurt parfaits, dips, and snacks offer versatility, while yogurt subscriptions provide convenience. Brands focus on enhancing taste and texture to meet consumer expectations. Ingredients such as fruits, nuts, and granola add to the appeal, making yogurt a popular choice for health-conscious consumers.
What are the Yogurt market trends shaping the Industry?
- The use of superfruits in yogurts is gaining significant traction in the market as a noteworthy trend. This emerging development reflects the increasing consumer preference for health-conscious food choices. In response to the rising health concerns among consumers, the market has witnessed notable trends towards increased safety, natural ingredients, and added value. Consumers are shifting towards healthier options, such as full-fat and plain yogurt, for breakfast or as a dinner alternative, seeking immune system support. Superfruits and berries, including acai, goji berry, noni, pomegranate, and grapes, are increasingly incorporated into Greek yogurt production for their antioxidant, vitamin, and mineral properties.
- The marketing strategies focuses on these health benefits, while distribution channels expand to include online platforms. Dairy-free yogurt options cater to consumers with dietary restrictions, further broadening the market's reach. The yogurt industry continues to evolve, prioritizing consumer health and preferences.
How does Yogurt market faces challenges face during its growth?
- Product recalls posing a significant challenge to industry growth, the number of which is continually increasing, necessitates the attention of industry professionals. Yogurt, a popular choice for a nutritious lunch option, faces challenges due to product recalls. These incidents, resulting from contamination or undeclared allergens, can significantly impact a company's reputation, consumer trust, and financial and operational well-being. For instance, Danone recalled certain yogurt products due to potential metal contamination, raising concerns about consumer safety. Organic yogurt, yogurt smoothies, and even shelf-stable yogurt are not immune to these issues. The fermentation process and yogurt cultures used in production must adhere to stringent quality standards to ensure the final product's safety and maintain consumer confidence.
- Yogurt's health benefits, such as its high protein content and calcium, make it a preferred choice for many. However, recalls can lead consumers to explore alternative options, potentially impacting the market's growth. Companies must prioritize product quality, invest in robust testing procedures, and maintain transparency to mitigate the risks and consequences of product recalls.
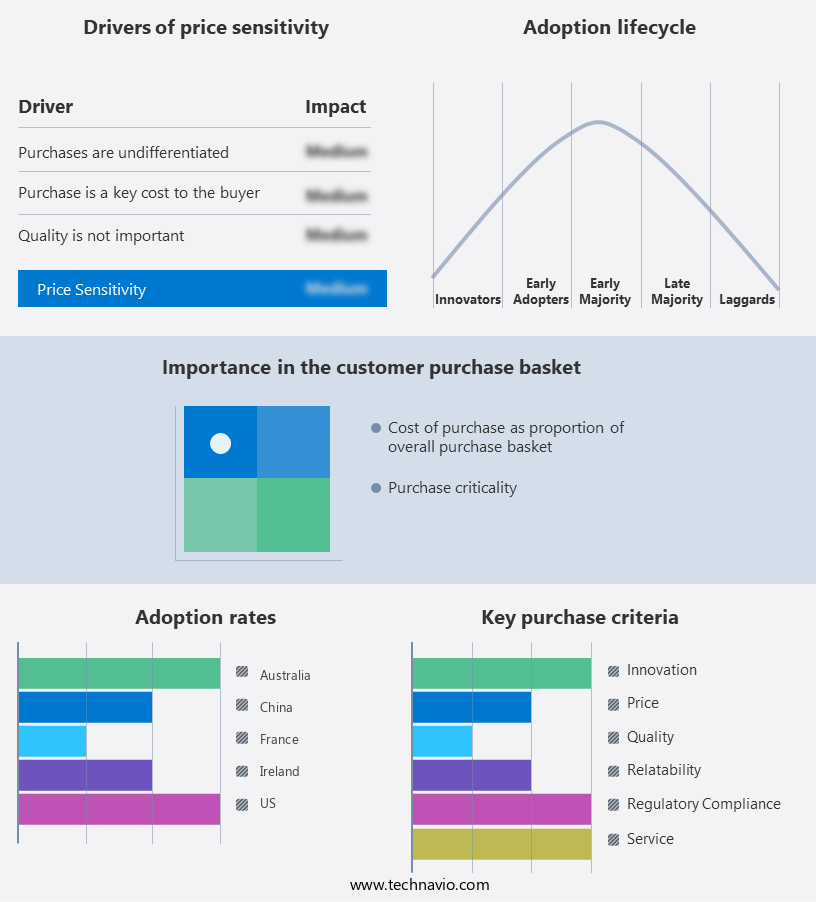
Exclusive Customer Landscape
The yogurt market forecasting report includes the adoption lifecycle of the market, covering from the innovator's stage to the laggard's stage. It focuses on adoption rates in different regions based on penetration. Furthermore, the yogurt market report also includes key purchase criteria and drivers of price sensitivity to help companies evaluate and develop their market growth analysis strategies.
Customer Landscape
Key Companies & Market Insights
Companies are implementing various strategies, such as strategic alliances, yogurt market forecast, partnerships, mergers and acquisitions, geographical expansion, and product/service launches, to enhance their presence in the industry.
Arla Foods amba - Arla, a leading international dairy company, provides a range of high-quality yogurt options for consumers.
The industry research and growth report includes detailed analyses of the competitive landscape of the market and information about key companies, including:
- Arla Foods amba
- Chobani Global Holdings LLC
- COFCO Corp.
- COYO Pty Ltd.
- Danone SA
- EHRMANN SE
- Emmi Group
- Fage International SA
- Fonterra Cooperative Group Ltd.
- General Mills Inc.
- Lactalis American Group Inc.
- Maple Hill Creamery LLC
- Meiji Holdings Co. Ltd.
- Nestle SA
- Sovos Brands Inc.
- The Hain Celestial Group Inc.
- Unternehmensgruppe Theo Muller
- Yeo Valley Organic Ltd.
Qualitative and quantitative analysis of companies has been conducted to help clients understand the wider business environment as well as the strengths and weaknesses of key industry players. Data is qualitatively analyzed to categorize companies as pure play, category-focused, industry-focused, and diversified; it is quantitatively analyzed to categorize companies as dominant, leading, strong, tentative, and weak.
Recent Development and News in Yogurt Market
- In February 2024, Danone, a leading global food company, introduced a new line of plant-based yogurt alternatives called "Silk Dairy-Free Yogurt Alternatives" in the United States (Danone Press Release, 2024). This expansion marks a significant response to the growing demand for plant-based food options.
- In August 2024, Chobani, the largest yogurt manufacturer in the US, formed a strategic partnership with Starbucks to produce and distribute yogurt parfaits for Starbucks stores (Chobani Press Release, 2024). This collaboration represents a notable expansion of Chobani's reach into the foodservice sector.
- In March 2025, Lactalis, the world's largest dairy cooperative, acquired a majority stake in the US-based yogurt company, Siggi's, for approximately USD1.3 billion (Reuters, 2025). This acquisition strengthens Lactalis' position in the high-protein the market and expands its presence in the US.
- In June 2025, the European Commission approved a new regulation allowing the use of plant-based proteins in yogurt production, marking a significant shift in the European the market (European Commission Press Release, 2025). This regulatory change opens new opportunities for plant-based yogurt manufacturers and could lead to increased competition in the sector.
Research Analyst Overview
The market continues to evolve, with dynamic trends shaping its various sectors. Yogurt's role extends beyond breakfast and snacks, as it increasingly becomes a dinner option with the rise of yogurt dinner recipes. Refrigerated yogurt remains a staple, but the market also sees growth in shelf-stable and online sales. These outlets offer consumers a wide range of fruit-floured dairy products to choose from under a single roof. Yogurt's applications span numerous sectors. Safety remains a top priority, with continuous innovation in processing and packaging ensuring the highest standards. Full-fat and plain yogurt retain popularity, while low-fat, sugar-free, and lactose-free options cater to diverse consumer preferences. Immune support and plant-based offerings are on the rise, with dairy-free yogurt gaining traction.
Yogurt's versatility is showcased through its use in parfaits, desserts, and even dips. Brands continue to differentiate themselves through taste, texture, and branding, while sustainability and innovation drive industry progress. Yogurt trends include the integration of probiotics, protein, and calcium for enhanced health benefits. Cultures and fermentation processes are refined to create unique flavors and consistencies. The market's continuous unfolding is reflected in the diverse offerings of yogurt, from Greek to organic, and the ongoing exploration of new applications and product forms. The Yogurt Market is thriving as consumers explore diverse options like yogurt snacks and yogurt desserts, incorporating yogurt granola for added texture. Health-conscious buyers prioritize yogurt breakfast and yogurt lunch, benefiting from yogurt protein and yogurt calcium for nutrition. Functional advantages such as yogurt gut health and yogurt immune support drive demand for yogurt lactose-free and yogurt sugar-free varieties. Preferences for yogurt full-fat, yogurt shelf-stable, and yogurt refrigerated influence buying decisions. Innovations in yogurt fermentation, yogurt starter cultures, and premium yogurt ingredients enhance product quality. Effective yogurt packaging, yogurt distribution, yogurt retail, yogurt online, and yogurt subscription models boost accessibility. Growing focus on yogurt sustainability, yogurt safety, yogurt quality, and yogurt taste shapes industry trends.
The Yogurt Market is expanding as consumers seek diverse options, including yogurt substitutes like vegan yogurt, featuring varieties such as coconut yogurt, almond yogurt, soy yogurt, cashew yogurt, and oat yogurt. Convenience-driven demand fuels products like yogurt bars, yogurt pouches, and yogurt cups, with innovative yogurt containers enhancing freshness. Strict yogurt labels, yogurt certifications, yogurt regulations, and yogurt standards ensure quality and compliance. Factors like yogurt shelf life and yogurt storage impact purchasing decisions, while yogurt consumption patterns reflect evolving preferences. Understanding yogurt frequency, yogurt demographics, and yogurt psychographics helps brands cater to targeted audiences.
Dive into Technavio's robust research methodology, blending expert interviews, extensive data synthesis, and validated models for unparalleled Yogurt Market insights. See full methodology.
|
Market Scope |
|
|
Report Coverage |
Details |
|
Page number |
237 |
|
Base year |
2024 |
|
Historic period |
2019-2023 |
|
Forecast period |
2025-2029 |
|
Growth momentum & CAGR |
Accelerate at a CAGR of 6.8% |
|
Market growth 2025-2029 |
USD 76 billion |
|
Market structure |
Fragmented |
|
YoY growth 2024-2025(%) |
5.9 |
|
Key countries |
Japan, US, Germany, India, UK, South Korea, Canada, China, Italy, and France |
|
Competitive landscape |
Leading Companies, Market Positioning of Companies, Competitive Strategies, and Industry Risks |
What are the Key Data Covered in this Yogurt Market Research and Growth Report?
- CAGR of the Yogurt industry during the forecast period
- Detailed information on factors that will drive the growth and forecasting between 2025 and 2029
- Precise estimation of the size of the market and its contribution of the industry in focus to the parent market
- Accurate predictions about upcoming growth and trends and changes in consumer behaviour
- Growth of the market across APAC, Europe, North America, South America, and Middle East and Africa
- Thorough analysis of the market's competitive landscape and detailed information about companies
- Comprehensive analysis of factors that will challenge the yogurt market growth of industry companies
We can help! Our analysts can customize this yogurt market research report to meet your requirements.
 RIA -
RIA - 
