Laptop Touchscreen Market Analysis, Size, and Forecast 2025-2029: APAC (China, India, Japan, South Korea), North America (US and Canada), Europe (France, Germany, Spain, UK), South America , and Middle East and Africa

Laptop Touchscreen Market Analysis, Size, and Forecast 2025-2029:
APAC (China, India, Japan, South Korea), North America (US and Canada), Europe (France, Germany, Spain, UK), South America , and Middle East and Africa

Published: Mar 2025 184 Pages SKU: IRTNTR80605

Market Overview at a Glance

$1.89 B
Market Opportunity
12.2%
CAGR
11.1
YoY growth 2024-2025(%)

Laptop Touchscreen Market Size 2025-2029

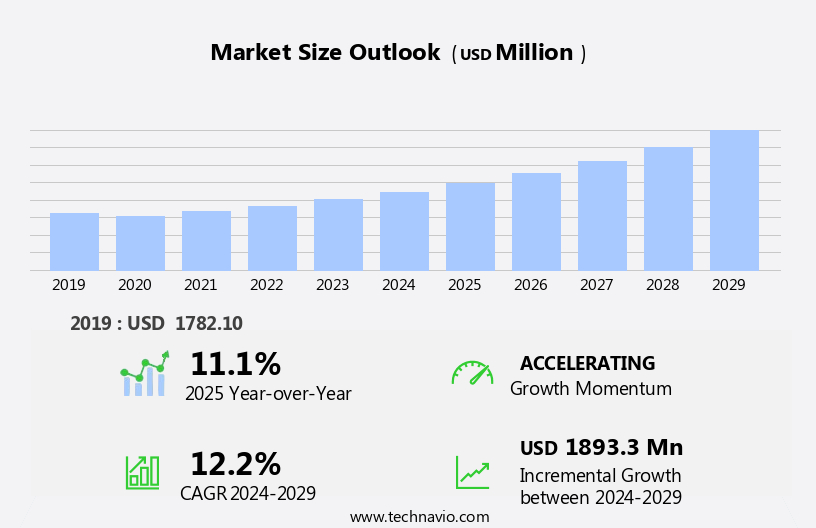
The laptop touchscreen market size is forecast to increase by USD 1.89 billion at a CAGR of 12.2% between 2024 and 2029.

  • The market is experiencing significant growth, driven by the increasing demand for hybrid and convertible laptops. These devices offer the convenience of a tablet and the functionality of a laptop, making them an attractive option for consumers. Additionally, the demand for slimmer and lighter touchscreen laptops continues to rise, as portability becomes a key consideration for many users. However, this market faces challenges from tablets and smartphones, which offer similar touchscreen capabilities in more compact form factors. To capitalize on opportunities and navigate these challenges effectively, companies in the laptop industry must focus on innovation, such as developing advanced touchscreen technologies and integrating productivity-enhancing features. They should also consider expanding their product offerings to cater to the diverse needs of consumers in the evolving digital landscape.

What will be the Size of the Laptop Touchscreen Market during the forecast period?

Laptop Touchscreen Market Size

 Request Free Sample

  • The market is experiencing significant growth as the demand for smart devices with high-speed data transfer capabilities and interactive touchscreens continues to rise. With the increasing reliance on internet connection for productivity apps, content consumption, and remote work, the market for laptops with touchscreens is expanding. Machine learning and predictive analytics are driving innovation in this space, enabling user-specific features and speech recognition. Touchscreens are becoming increasingly popular in various industries, from creative creation to smart home appliances, due to their attractive and interactive displays. The integration of 5G technology further enhances the user experience by enabling faster data transfer and real-time interaction.
  • Moreover, the flexibility of touchscreens in various environments, including outdoors and manual work, is making them a preferred choice for consumers. High-resolution displays and anti-uv coatings are essential features for laptops in this market, ensuring optimal visual experience and durability. Strategic marketing efforts are focusing on the benefits of touchscreens for productivity and convenience, making them an attractive option for consumers seeking to enhance their digital lifestyle. The integration of AI-based touchscreens and conventional displays is also gaining traction, offering a blend of traditional and advanced technology. Overall, the market is poised for continued growth as the trend towards smart devices and flexible work schedules continues.

How is this Laptop Touchscreen Industry segmented?

The laptop touchscreen industry research report provides comprehensive data (region-wise segment analysis), with forecasts and estimates in "USD billion" for the period 2025-2029, as well as historical data from 2019-2023 for the following segments. 

  • Technology
    • Capacitive
    • Resistive
    • SAW
  • Distribution Channel
    • OEM
    • Aftermarket
  • Application
    • Consumer Laptops
    • Gaming Laptops
    • Business Laptops
  • End-Use
    • Personal Use
    • Enterprise
    • Education
  • Geography
    • APAC
      • China
      • India
      • Japan
      • South Korea
    • North America
      • US
      • Canada
    • Europe
      • France
      • Germany
      • Spain
      • UK
    • South America
      • Middle East and Africa

      By Technology Insights

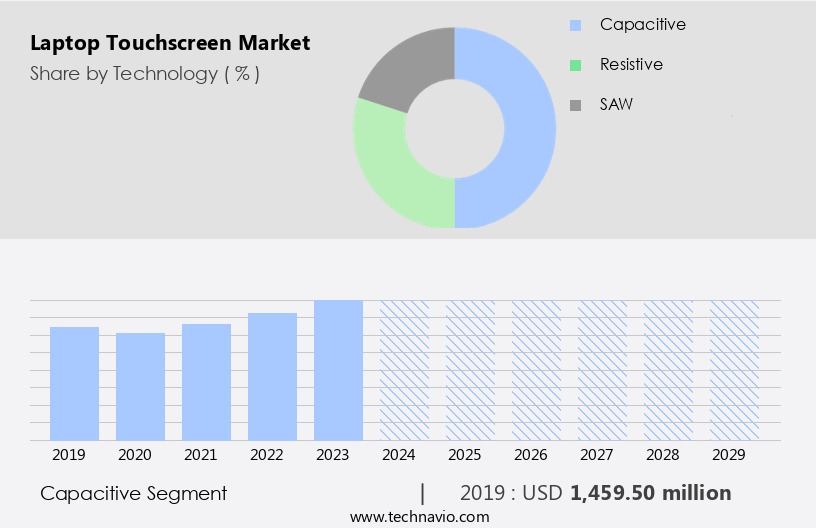
      The capacitive segment is estimated to witness significant growth during the forecast period. Capacitive touchscreen technology is the primary driver of the market, accounting for a significant market share. This technology functions by detecting electrical changes in a conductive layer, typically indium tin oxide, integrated within the screen. When a conductive object, such as a fingertip, interacts with the display, it alters the field, accurately identifying the touchpoint. This feature enables multi-touch capabilities, facilitating intuitive gestures like pinching, zooming, and swiping, which are common among smartphone and tablet users. The integration of touchscreens in laptops, particularly in premium and mid-range models, underscores their importance in market expansion. This technology offers various advantages, including wireless connectivity, personalized recommendations, seamless integration with smart devices, content creation tools, and user-friendly design.

      Laptop Touchscreen Market Size

      Get a glance at the market report of share of various segments Request Free Sample

      The capacitive segment was valued at USD 1.46 billion in 2019 and showed a gradual increase during the forecast period.

      Regional Analysis

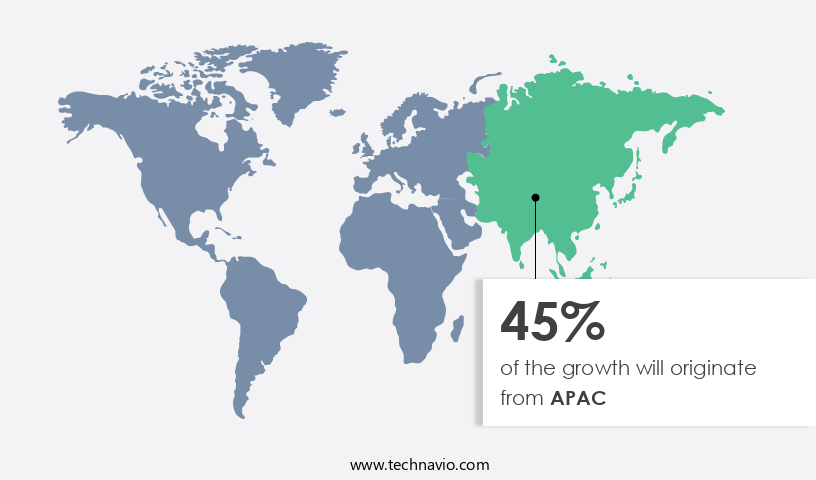
      APAC is estimated to contribute 45% to the growth of the global market during the forecast period.Technavio's analysts have elaborately explained the regional trends and drivers that shape the market during the forecast period.

      Laptop Touchscreen Market Share by Geography

      For more insights on the market size of various regions, Request Free Sample

      The Asia-Pacific (APAC) region leads The market due to economic growth, increasing disposable incomes, and high-tech adoption, particularly in countries like China, India, Japan, and South Korea. The expanding middle class in these nations is fueling demand for premium and high-performance devices, including touchscreen laptops. In China, per capita disposable income reached approximately USD 5,511 in 2023, marking a 6.3% year-on-year increase (National Bureau of Statistics of China). This income growth is driving consumer spending on advanced technological products, including touchscreen laptops. India has also experienced significant economic progress, with per capita income rising by 35%. Touchscreens offer intuitive interfaces, personalized recommendations, wireless connectivity, and device compatibility, making them ideal for digital transformation, online entertainment, and productivity hacks.

      Market Dynamics

      Our researchers analyzed the data with 2024 as the base year, along with the key drivers, trends, and challenges. A holistic analysis of drivers will help companies refine their marketing strategies to gain a competitive advantage.

      What are the key market drivers leading to the rise in the adoption of Laptop Touchscreen Industry?

      • Increasing demand for hybrid and convertible laptops is the key driver of the market. The market is experiencing significant growth due to the increasing preference for hybrid and convertible laptops. These devices offer the convenience of a tablet and the functionality of a laptop, making them a versatile solution for various sectors, including education, business, and creative industries. Leading companies, such as Microsoft, HP, Lenovo, Dell, and ASUS, have responded to this trend by introducing touchscreen-enabled convertible models.
      • For example, Microsoft's Surface Pro series features a detachable keyboard, enabling users to transform their laptops into tablets for enhanced mobility. The adaptability and interactive interfaces of these devices are essential in sectors where flexibility is crucial.

      What are the market trends shaping the Laptop Touchscreen Industry?

      • Increasing demand for slimmer and lighter touchscreen laptops is the upcoming market trend. The market is witnessing significant growth due to the increasing preference for portable and lightweight devices. With the rise of remote work and online learning, the demand for laptops that offer high performance and mobility is on the rise. Slimmer and lighter touchscreen laptops are particularly popular among professionals, students, and frequent travelers, as they can easily be carried in bags or briefcases. Advancements in materials and manufacturing technologies have enabled the production of laptops that are both lightweight and powerful. These innovations have made it possible to reduce the size and weight of laptops without compromising performance.
      • As a result, touchscreen laptops are becoming an essential tool for those who need to work or study on the go. The market is expected to continue its growth trajectory, driven by the increasing demand for portable devices and the ongoing advancements in technology. The market is poised for continued growth, offering significant opportunities for companies and investors alike.

      What challenges does the Laptop Touchscreen Industry face during its growth?

      • Competition from tablets and smartphones is a key challenge affecting the industry growth. The market faces significant competition from tablets and high-end smartphones, which offer comparable functionality with greater portability and affordability. These devices, such as the iPad Pro and Samsung Galaxy Tab, boast advanced touch interfaces, long battery life, and extensive application ecosystems, making them viable alternatives for casual users. 
      • For tasks like browsing, streaming, and light productivity, tablets and smartphones often suffice, potentially diminishing the demand for touchscreen laptops. This overlap cannibalizes the market, particularly in segments where convenience and affordability take precedence over a full-fledged laptop experience.

      Exclusive Customer Landscape

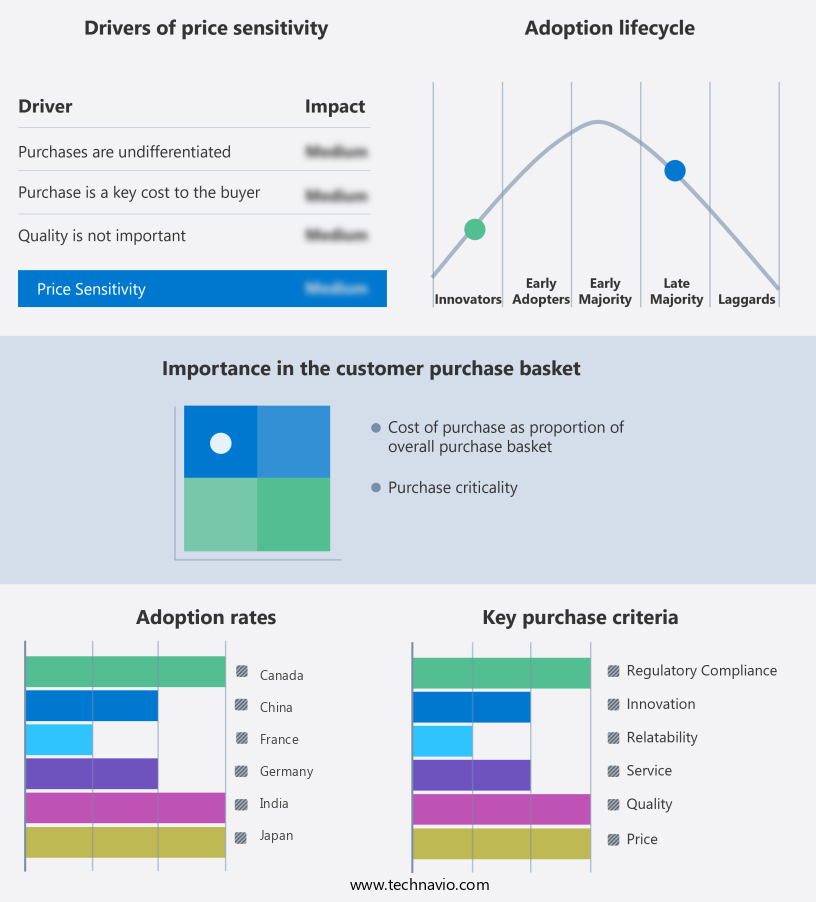
      The laptop touchscreen market forecasting report includes the adoption lifecycle of the market, covering from the innovator's stage to the laggard's stage. It focuses on adoption rates in different regions based on penetration. Furthermore, the laptop touchscreen market report also includes key purchase criteria and drivers of price sensitivity to help companies evaluate and develop their market growth analysis strategies.

      Laptop Touchscreen Market Share by Geography

       Customer Landscape

      Key Companies & Market Insights

      Companies are implementing various strategies, such as strategic alliances, laptop touchscreen market forecast, partnerships, mergers and acquisitions, geographical expansion, and product/service launches, to enhance their presence in the industry.

      AUO Corp. The company offers laptop touchscreen such as low-temperature polysilicon (LTPS) panels that improves user experience with a smoother and higher frame rate.

      The industry research and growth report includes detailed analyses of the competitive landscape of the market and information about key companies, including:

      • BOE Technology Group Co. Ltd.
      • HannsTouch Solution Inc.
      • Innolux Corp.
      • LG Display Co. Ltd.
      • MELFAS BD
      • Samsung Display Co. Ltd.
      • TPK Holding Co. Ltd.

      Qualitative and quantitative analysis of companies has been conducted to help clients understand the wider business environment as well as the strengths and weaknesses of key industry players. Data is qualitatively analyzed to categorize companies as pure play, category-focused, industry-focused, and diversified; it is quantitatively analyzed to categorize companies as dominant, leading, strong, tentative, and weak.

      Research Analyst Overview

      The market is experiencing significant growth as digital transformation continues to shape the way we work and consume content. Touchscreens offer intuitive interfaces that enable personalized recommendations, seamless integration with wireless connectivity, and compatibility with various devices. These advanced features have made touchscreens an essential component of the digital lifestyle. Touchscreens are revolutionizing the way we interact with our devices, providing a more user-friendly experience for online entertainment, content creation tools, and wearable technology trends. The increasing popularity of touchscreen displays in laptops is driven by the need for efficient and productive workspaces, remote collaboration, and smart home automation.

      In addition, touchscreens offer a range of benefits for users, including data security, voice control, and user-friendly design. With touchscreens, users can navigate apps with ease, access personalized user experiences, and manage their devices more efficiently. Intelligent ecosystems are also becoming increasingly popular, offering advanced laptop features such as touchscreen display installation, maintenance, and customization. Touchscreen display design is a critical factor in the success of this market. Advanced touchscreen technology, such as capacitive displays and touch sensors, provides high definition displays and touch sensitivity, making for an intuitive experience. Anti-scratch coatings and anti-glare coatings ensure durability and readability in various lighting conditions.

      Furthermore, touchscreen displays are also becoming more accessible, with solutions for outdoor use and high definition displays that offer improved visibility and clarity. Power consumption is a concern for many users, but touchscreen technology has made strides in reducing power consumption, making touchscreen laptops a viable option for creative professionals and those who require a traditional laptop setup. Touchscreen display software and hardware continue to evolve, offering new features and functionalities that enhance the user experience. The cost of touchscreen displays is also decreasing, making them more affordable for a wider range of users. Manual work reduction is another significant benefit of touchscreens, with touchscreen display solutions offering efficient display features that streamline workflows and increase productivity.

      Moreover, touchscreens are also being integrated into digital signage solutions, providing new opportunities for businesses to engage with customers and promote their products and services. Touchscreens offer a range of benefits, including improved productivity, data security, and user-friendly design. The future of work is increasingly reliant on touchscreens, making them an essential component of the digital lifestyle.

      Market Scope

      Report Coverage

      Details

      Page number

      184

      Base year

      2024

      Historic period

      2019-2023

      Forecast period

      2025-2029

      Growth momentum & CAGR

      Accelerate at a CAGR of 12.2%

      Market growth 2025-2029

      USD 1.89 billion

      Market structure

      Concentrated

      YoY growth 2024-2025(%)

      11.1

      Key countries

      China, US, South Korea, Japan, Germany, UK, Canada, France, India, and Spain

      Competitive landscape

      Leading Companies, market growth and forecasting , Market Positioning of Companies, Competitive Strategies, and Industry Risks

      Request Free Sample

      What are the Key Data Covered in this Laptop Touchscreen Market Research and Growth Report?

      • CAGR of the Laptop Touchscreen industry during the forecast period
      • Detailed information on factors that will drive the growth and forecasting between 2025 and 2029
      • Precise estimation of the size of the market and its contribution of the industry in focus to the parent market
      • Accurate predictions about upcoming growth and trends and changes in consumer behaviour
      • Growth of the market across APAC, North America, Europe, South America, and Middle East and Africa
      • Thorough analysis of the market's competitive landscape and detailed information about companies
      • Comprehensive analysis of factors that will challenge the laptop touchscreen market growth of industry companies

      We can help! Our analysts can customize this laptop touchscreen market research report to meet your requirements.

      Get in touch

      1 Executive Summary

      • 1.1 Market overview
        • Executive Summary - Chart on Market Overview
        • Executive Summary - Data Table on Market Overview
        • Executive Summary - Chart on Global Market Characteristics
        • Executive Summary - Chart on Market by Geography
        • Executive Summary - Chart on Market Segmentation by Technology
        • Executive Summary - Chart on Market Segmentation by Distribution Channel
        • Executive Summary - Chart on Incremental Growth
        • Executive Summary - Data Table on Incremental Growth
        • Executive Summary - Chart on Company Market Positioning

      2 Technavio Analysis

      • 2.1 Analysis of price sensitivity, lifecycle, customer purchase basket, adoption rates, and purchase criteria
        • Analysis of price sensitivity, lifecycle, customer purchase basket, adoption rates, and purchase criteria
      • 2.2 Criticality of inputs and Factors of differentiation
        • Overview on criticality of inputs and factors of differentiation
      • 2.3 Factors of disruption
        • Overview on factors of disruption
      • 2.4 Impact of drivers and challenges
        • Impact of drivers and challenges in 2024 and 2029

      3 Market Landscape

      • 3.1 Market ecosystem
        • Parent Market
        • Data Table on - Parent Market
      • 3.2 Market characteristics
        • Market characteristics analysis
      • 3.3 Value chain analysis
        • Value chain analysis

      4 Market Sizing

      • 4.1 Market definition
        • Offerings of companies included in the market definition
      • 4.2 Market segment analysis
        • Market segments
      • 4.3 Market size 2024
        • 4.4 Market outlook: Forecast for 2024-2029
          • Chart on Global - Market size and forecast 2024-2029 ($ million)
          • Data Table on Global - Market size and forecast 2024-2029 ($ million)
          • Chart on Global Market: Year-over-year growth 2024-2029 (%)
          • Data Table on Global Market: Year-over-year growth 2024-2029 (%)

        5 Historic Market Size

        • 5.1 Global Laptop Touchscreen Market 2019 - 2023
          • Historic Market Size - Data Table on Global Laptop Touchscreen Market 2019 - 2023 ($ million)
        • 5.2 Technology segment analysis 2019 - 2023
          • Historic Market Size - Technology Segment 2019 - 2023 ($ million)
        • 5.3 Distribution Channel segment analysis 2019 - 2023
          • Historic Market Size - Distribution Channel Segment 2019 - 2023 ($ million)
        • 5.4 Geography segment analysis 2019 - 2023
          • Historic Market Size - Geography Segment 2019 - 2023 ($ million)
        • 5.5 Country segment analysis 2019 - 2023
          • Historic Market Size - Country Segment 2019 - 2023 ($ million)

        6 Qualitative Analysis

        • 6.1 Impact of AI on Global Laptop Touchscreen Market

          7 Five Forces Analysis

          • 7.1 Five forces summary
            • Five forces analysis - Comparison between 2024 and 2029
          • 7.2 Bargaining power of buyers
            • Bargaining power of buyers - Impact of key factors 2024 and 2029
          • 7.3 Bargaining power of suppliers
            • Bargaining power of suppliers - Impact of key factors in 2024 and 2029
          • 7.4 Threat of new entrants
            • Threat of new entrants - Impact of key factors in 2024 and 2029
          • 7.5 Threat of substitutes
            • Threat of substitutes - Impact of key factors in 2024 and 2029
          • 7.6 Threat of rivalry
            • Threat of rivalry - Impact of key factors in 2024 and 2029
          • 7.7 Market condition
            • Chart on Market condition - Five forces 2024 and 2029

          8 Market Segmentation by Technology

          • 8.1 Market segments
            • Chart on Technology - Market share (2024-2029) (%)
            • Data Table on Technology - Market share (2024-2029) (%)
          • 8.2 Comparison by Technology
            • Chart on Comparison by Technology
            • Data Table on Comparison by Technology
          • 8.3 Capacitive - Market size and forecast (2024-2029)
            • Chart on Capacitive - Market size and forecast (2024-2029) ($ million)
            • Data Table on Capacitive - Market size and forecast (2024-2029) ($ million)
            • Chart on Capacitive - Year-over-year growth (2024-2029) (%)
            • Data Table on Capacitive - Year-over-year growth (2024-2029) (%)
          • 8.4 Resistive - Market size and forecast (2024-2029)
            • Chart on Resistive - Market size and forecast (2024-2029) ($ million)
            • Data Table on Resistive - Market size and forecast (2024-2029) ($ million)
            • Chart on Resistive - Year-over-year growth (2024-2029) (%)
            • Data Table on Resistive - Year-over-year growth (2024-2029) (%)
          • 8.5 SAW - Market size and forecast (2024-2029)
            • Chart on SAW - Market size and forecast (2024-2029) ($ million)
            • Data Table on SAW - Market size and forecast (2024-2029) ($ million)
            • Chart on SAW - Year-over-year growth (2024-2029) (%)
            • Data Table on SAW - Year-over-year growth (2024-2029) (%)
          • 8.6 Market opportunity by Technology
            • Market opportunity by Technology ($ million)
            • Data Table on Market opportunity by Technology ($ million)

          9 Market Segmentation by Distribution Channel

          • 9.1 Market segments
            • Chart on Distribution Channel - Market share (2024-2029) (%)
            • Data Table on Distribution Channel - Market share (2024-2029) (%)
          • 9.2 Comparison by Distribution Channel
            • Chart on Comparison by Distribution Channel
            • Data Table on Comparison by Distribution Channel
          • 9.3 OEM - Market size and forecast (2024-2029)
            • Chart on OEM - Market size and forecast (2024-2029) ($ million)
            • Data Table on OEM - Market size and forecast (2024-2029) ($ million)
            • Chart on OEM - Year-over-year growth (2024-2029) (%)
            • Data Table on OEM - Year-over-year growth (2024-2029) (%)
          • 9.4 Aftermarket - Market size and forecast (2024-2029)
            • Chart on Aftermarket - Market size and forecast (2024-2029) ($ million)
            • Data Table on Aftermarket - Market size and forecast (2024-2029) ($ million)
            • Chart on Aftermarket - Year-over-year growth (2024-2029) (%)
            • Data Table on Aftermarket - Year-over-year growth (2024-2029) (%)
          • 9.5 Market opportunity by Distribution Channel
            • Market opportunity by Distribution Channel ($ million)
            • Data Table on Market opportunity by Distribution Channel ($ million)

          10 Market Segmentation by Application

          • 10.1 Market segments
            • Chart on Application - Market share (2024-2029) (%)
            • Data Table on Application - Market share (2024-2029) (%)
          • 10.2 Comparison by Application
            • Chart on Comparison by Application
            • Data Table on Comparison by Application
          • 10.3 Consumer Laptops - Market size and forecast (2024-2029)
            • Chart on Consumer Laptops - Market size and forecast (2024-2029) ($ million)
            • Data Table on Consumer Laptops - Market size and forecast (2024-2029) ($ million)
            • Chart on Consumer Laptops - Year-over-year growth (2024-2029) (%)
            • Data Table on Consumer Laptops - Year-over-year growth (2024-2029) (%)
          • 10.4 Gaming Laptops - Market size and forecast (2024-2029)
            • Chart on Gaming Laptops - Market size and forecast (2024-2029) ($ million)
            • Data Table on Gaming Laptops - Market size and forecast (2024-2029) ($ million)
            • Chart on Gaming Laptops - Year-over-year growth (2024-2029) (%)
            • Data Table on Gaming Laptops - Year-over-year growth (2024-2029) (%)
          • 10.5 Business Laptops - Market size and forecast (2024-2029)
            • Chart on Business Laptops - Market size and forecast (2024-2029) ($ million)
            • Data Table on Business Laptops - Market size and forecast (2024-2029) ($ million)
            • Chart on Business Laptops - Year-over-year growth (2024-2029) (%)
            • Data Table on Business Laptops - Year-over-year growth (2024-2029) (%)
          • 10.6 Market opportunity by Application
            • Market opportunity by Application ($ million)
            • Data Table on Market opportunity by Application ($ million)

          11 Market Segmentation by End-Use

          • 11.1 Market segments
            • Chart on End-Use - Market share (2024-2029) (%)
            • Data Table on End-Use - Market share (2024-2029) (%)
          • 11.2 Comparison by End-Use
            • Chart on Comparison by End-Use
            • Data Table on Comparison by End-Use
          • 11.3 Personal Use - Market size and forecast (2024-2029)
            • Chart on Personal Use - Market size and forecast (2024-2029) ($ million)
            • Data Table on Personal Use - Market size and forecast (2024-2029) ($ million)
            • Chart on Personal Use - Year-over-year growth (2024-2029) (%)
            • Data Table on Personal Use - Year-over-year growth (2024-2029) (%)
          • 11.4 Enterprise - Market size and forecast (2024-2029)
            • Chart on Enterprise - Market size and forecast (2024-2029) ($ million)
            • Data Table on Enterprise - Market size and forecast (2024-2029) ($ million)
            • Chart on Enterprise - Year-over-year growth (2024-2029) (%)
            • Data Table on Enterprise - Year-over-year growth (2024-2029) (%)
          • 11.5 Education - Market size and forecast (2024-2029)
            • Chart on Education - Market size and forecast (2024-2029) ($ million)
            • Data Table on Education - Market size and forecast (2024-2029) ($ million)
            • Chart on Education - Year-over-year growth (2024-2029) (%)
            • Data Table on Education - Year-over-year growth (2024-2029) (%)
          • 11.6 Market opportunity by End-Use
            • Market opportunity by End-Use ($ million)
            • Data Table on Market opportunity by End-Use ($ million)

          12 Customer Landscape

          • 12.1 Customer landscape overview
            • Analysis of price sensitivity, lifecycle, customer purchase basket, adoption rates, and purchase criteria

          13 Geographic Landscape

          • 13.1 Geographic segmentation
            • Chart on Market share by geography 2024-2029 (%)
            • Data Table on Market share by geography 2024-2029 (%)
          • 13.2 Geographic comparison
            • Chart on Geographic comparison
            • Data Table on Geographic comparison
          • 13.3 APAC - Market size and forecast 2024-2029
            • Chart on APAC - Market size and forecast 2024-2029 ($ million)
            • Data Table on APAC - Market size and forecast 2024-2029 ($ million)
            • Chart on APAC - Year-over-year growth 2024-2029 (%)
            • Data Table on APAC - Year-over-year growth 2024-2029 (%)
          • 13.4 North America - Market size and forecast 2024-2029
            • Chart on North America - Market size and forecast 2024-2029 ($ million)
            • Data Table on North America - Market size and forecast 2024-2029 ($ million)
            • Chart on North America - Year-over-year growth 2024-2029 (%)
            • Data Table on North America - Year-over-year growth 2024-2029 (%)
          • 13.5 Europe - Market size and forecast 2024-2029
            • Chart on Europe - Market size and forecast 2024-2029 ($ million)
            • Data Table on Europe - Market size and forecast 2024-2029 ($ million)
            • Chart on Europe - Year-over-year growth 2024-2029 (%)
            • Data Table on Europe - Year-over-year growth 2024-2029 (%)
          • 13.6 South America - Market size and forecast 2024-2029
            • Chart on South America - Market size and forecast 2024-2029 ($ million)
            • Data Table on South America - Market size and forecast 2024-2029 ($ million)
            • Chart on South America - Year-over-year growth 2024-2029 (%)
            • Data Table on South America - Year-over-year growth 2024-2029 (%)
          • 13.7 Middle East and Africa - Market size and forecast 2024-2029
            • Chart on Middle East and Africa - Market size and forecast 2024-2029 ($ million)
            • Data Table on Middle East and Africa - Market size and forecast 2024-2029 ($ million)
            • Chart on Middle East and Africa - Year-over-year growth 2024-2029 (%)
            • Data Table on Middle East and Africa - Year-over-year growth 2024-2029 (%)
          • 13.8 China - Market size and forecast 2024-2029
            • Chart on China - Market size and forecast 2024-2029 ($ million)
            • Data Table on China - Market size and forecast 2024-2029 ($ million)
            • Chart on China - Year-over-year growth 2024-2029 (%)
            • Data Table on China - Year-over-year growth 2024-2029 (%)
          • 13.9 US - Market size and forecast 2024-2029
            • Chart on US - Market size and forecast 2024-2029 ($ million)
            • Data Table on US - Market size and forecast 2024-2029 ($ million)
            • Chart on US - Year-over-year growth 2024-2029 (%)
            • Data Table on US - Year-over-year growth 2024-2029 (%)
          • 13.10 South Korea - Market size and forecast 2024-2029
            • Chart on South Korea - Market size and forecast 2024-2029 ($ million)
            • Data Table on South Korea - Market size and forecast 2024-2029 ($ million)
            • Chart on South Korea - Year-over-year growth 2024-2029 (%)
            • Data Table on South Korea - Year-over-year growth 2024-2029 (%)
          • 13.11 Japan - Market size and forecast 2024-2029
            • Chart on Japan - Market size and forecast 2024-2029 ($ million)
            • Data Table on Japan - Market size and forecast 2024-2029 ($ million)
            • Chart on Japan - Year-over-year growth 2024-2029 (%)
            • Data Table on Japan - Year-over-year growth 2024-2029 (%)
          • 13.12 UK - Market size and forecast 2024-2029
            • Chart on UK - Market size and forecast 2024-2029 ($ million)
            • Data Table on UK - Market size and forecast 2024-2029 ($ million)
            • Chart on UK - Year-over-year growth 2024-2029 (%)
            • Data Table on UK - Year-over-year growth 2024-2029 (%)
          • 13.13 Germany - Market size and forecast 2024-2029
            • Chart on Germany - Market size and forecast 2024-2029 ($ million)
            • Data Table on Germany - Market size and forecast 2024-2029 ($ million)
            • Chart on Germany - Year-over-year growth 2024-2029 (%)
            • Data Table on Germany - Year-over-year growth 2024-2029 (%)
          • 13.14 Canada - Market size and forecast 2024-2029
            • Chart on Canada - Market size and forecast 2024-2029 ($ million)
            • Data Table on Canada - Market size and forecast 2024-2029 ($ million)
            • Chart on Canada - Year-over-year growth 2024-2029 (%)
            • Data Table on Canada - Year-over-year growth 2024-2029 (%)
          • 13.15 France - Market size and forecast 2024-2029
            • Chart on France - Market size and forecast 2024-2029 ($ million)
            • Data Table on France - Market size and forecast 2024-2029 ($ million)
            • Chart on France - Year-over-year growth 2024-2029 (%)
            • Data Table on France - Year-over-year growth 2024-2029 (%)
          • 13.16 India - Market size and forecast 2024-2029
            • Chart on India - Market size and forecast 2024-2029 ($ million)
            • Data Table on India - Market size and forecast 2024-2029 ($ million)
            • Chart on India - Year-over-year growth 2024-2029 (%)
            • Data Table on India - Year-over-year growth 2024-2029 (%)
          • 13.17 Spain - Market size and forecast 2024-2029
            • Chart on Spain - Market size and forecast 2024-2029 ($ million)
            • Data Table on Spain - Market size and forecast 2024-2029 ($ million)
            • Chart on Spain - Year-over-year growth 2024-2029 (%)
            • Data Table on Spain - Year-over-year growth 2024-2029 (%)
          • 13.18 Market opportunity by geography
            • Market opportunity by geography ($ million)
            • Data Tables on Market opportunity by geography ($ million)
          • 13.19 Rest of World (ROW) - Market size and forecast (2024-2029)
            • Chart on Rest of World (ROW) - Market size and forecast (2024-2029) ($ million)
            • Data Table on Rest of World (ROW) - Market size and forecast (2024-2029) ($ million)
            • Chart on Rest of World (ROW) - Year-over-year growth (2024-2029) (%)
            • Data Table on Rest of World (ROW) - Year-over-year growth (2024-2029) (%)

          14 Drivers, Challenges, and Opportunity/Restraints

          • 14.1 Market drivers
            • 14.2 Market challenges
              • 14.3 Impact of drivers and challenges
                • Impact of drivers and challenges in 2024 and 2029
              • 14.4 Market opportunities/restraints

                15 Competitive Landscape

                • 15.1 Overview
                  • 15.2 Competitive Landscape
                    • Overview on criticality of inputs and factors of differentiation
                  • 15.3 Landscape disruption
                    • Overview on factors of disruption
                  • 15.4 Industry risks
                    • Impact of key risks on business

                  16 Competitive Analysis

                  • 16.1 Companies profiled
                    • Companies covered
                  • 16.2 Company ranking index
                    • Company ranking index
                  • 16.3 Market positioning of companies
                    • Matrix on companies position and classification
                  • 16.4 AUO Corp.
                    • AUO Corp. - Overview
                    • AUO Corp. - Business segments
                    • AUO Corp. - Key news
                    • AUO Corp. - Key offerings
                    • AUO Corp. - Segment focus
                    • SWOT
                  • 16.5 BOE Technology Group Co. Ltd.
                    • BOE Technology Group Co. Ltd. - Overview
                    • BOE Technology Group Co. Ltd. - Business segments
                    • BOE Technology Group Co. Ltd. - Key offerings
                    • BOE Technology Group Co. Ltd. - Segment focus
                    • SWOT
                  • 16.6 HannsTouch Solution Inc.
                    • HannsTouch Solution Inc. - Overview
                    • HannsTouch Solution Inc. - Business segments
                    • HannsTouch Solution Inc. - Key offerings
                    • HannsTouch Solution Inc. - Segment focus
                    • SWOT
                  • 16.7 Innolux Corp.
                    • Innolux Corp. - Overview
                    • Innolux Corp. - Product / Service
                    • Innolux Corp. - Key offerings
                    • SWOT
                  • 16.8 LG Display Co. Ltd.
                    • LG Display Co. Ltd. - Overview
                    • LG Display Co. Ltd. - Product / Service
                    • LG Display Co. Ltd. - Key offerings
                    • SWOT
                  • 16.9 MELFAS BD
                    • MELFAS BD - Overview
                    • MELFAS BD - Product / Service
                    • MELFAS BD - Key offerings
                    • SWOT
                  • 16.10 Samsung Display Co. Ltd.
                    • Samsung Display Co. Ltd. - Overview
                    • Samsung Display Co. Ltd. - Product / Service
                    • Samsung Display Co. Ltd. - Key offerings
                    • SWOT
                  • 16.11 TPK Holding Co. Ltd.
                    • TPK Holding Co. Ltd. - Overview
                    • TPK Holding Co. Ltd. - Product / Service
                    • TPK Holding Co. Ltd. - Key offerings
                    • SWOT

                  17 Appendix

                  • 17.1 Scope of the report
                    • 17.2 Inclusions and exclusions checklist
                      • Inclusions checklist
                      • Exclusions checklist
                    • 17.3 Currency conversion rates for US$
                      • Currency conversion rates for US$
                    • 17.4 Research methodology
                      • Research methodology
                    • 17.5 Data procurement
                      • Information sources
                    • 17.6 Data validation
                      • Data validation
                    • 17.7 Validation techniques employed for market sizing
                      • Validation techniques employed for market sizing
                    • 17.8 Data synthesis
                      • Data synthesis
                    • 17.9 360 degree market analysis
                      • 360 degree market analysis
                    • 17.10 List of abbreviations
                      • List of abbreviations

                    Research Methodology

                    Technavio presents a detailed picture of the market by way of study, synthesis, and summation of data from multiple sources. The analysts have presented the various facets of the market with a particular focus on identifying the key industry influencers. The data thus presented is comprehensive, reliable, and the result of extensive research, both primary and secondary.

                    INFORMATION SOURCES

                    Primary sources

                    • Manufacturers and suppliers
                    • Channel partners
                    • Industry experts
                    • Strategic decision makers

                    Secondary sources

                    • Industry journals and periodicals
                    • Government data
                    • Financial reports of key industry players
                    • Historical data
                    • Press releases

                    DATA ANALYSIS

                    Data Synthesis

                    • Collation of data
                    • Estimation of key figures
                    • Analysis of derived insights

                    Data Validation

                    • Triangulation with data models
                    • Reference against proprietary databases
                    • Corroboration with industry experts

                    REPORT WRITING

                    Qualitative

                    • Market drivers
                    • Market challenges
                    • Market trends
                    • Five forces analysis

                    Quantitative

                    • Market size and forecast
                    • Market segmentation
                    • Geographical insights
                    • Competitive landscape

                    Interested in this report?

                    Get your sample now to see our research methodology and insights!

                    Download Now

                    Frequently Asked Questions

                    Laptop Touchscreen market growth will increase by $ 1893.3 mn during 2025-2029.

                    The Laptop Touchscreen market is expected to grow at a CAGR of 12.2% during 2025-2029.

                    Laptop Touchscreen market is segmented by Technology( Capacitive, Resistive, SAW) Distribution Channel( OEM, Aftermarket)

                    AUO Corp., BOE Technology Group Co. Ltd., HannsTouch Solution Inc., Innolux Corp., LG Display Co. Ltd., MELFAS BD, Samsung Display Co. Ltd., TPK Holding Co. Ltd. are a few of the key vendors in the Laptop Touchscreen market.

                    APAC will register the highest growth rate of 45% among the other regions. Therefore, the Laptop Touchscreen market in APAC is expected to garner significant business opportunities for the vendors during the forecast period.

                    China, US, South Korea, Japan, Germany, UK, Canada, France, India, Spain

                    • Increasing demand for hybrid and convertible laptopsThe increasing demand for hybrid and convertible laptops has become a significant driver for the global laptop touchscreen market. These devices combine the functionality of a traditional laptop with the flexibility of a tablet is the driving factor this market.
                    • offering a versatile solution for both personal and professional use. Hybrid and convertible laptops are particularly popular in sectors such as education is the driving factor this market.
                    • business is the driving factor this market.
                    • and creative industries is the driving factor this market.
                    • where adaptability and interactive interfaces are crucial.Leading brands such as Microsoft is the driving factor this market.
                    • HP is the driving factor this market.
                    • Lenovo is the driving factor this market.
                    • Dell is the driving factor this market.
                    • and ASUS have introduced a range of touchscreen-enabled convertible models that cater to diverse user needs. For instance is the driving factor this market.
                    • the Microsoft Surface Pro series offers a detachable keyboard is the driving factor this market.
                    • transforming the laptop into a tablet for added mobility. Similarly is the driving factor this market.
                    • the Lenovo Yoga series features a 360-degree hinge is the driving factor this market.
                    • allowing the screen to fold back completely for flexible usage in multiple modes such as laptop is the driving factor this market.
                    • tent is the driving factor this market.
                    • or tablet. These designs make touchscreen functionality integral is the driving factor this market.
                    • enhancing productivity and user experience.In the education sector is the driving factor this market.
                    • touchscreen Chromebooks have gained significant traction. Schools and universities increasingly adopt these devices due to their intuitive interfaces and compatibility with interactive learning platforms. Students benefit from features such as handwriting recognition is the driving factor this market.
                    • stylus support is the driving factor this market.
                    • and easy note-taking is the driving factor this market.
                    • improving engagement and collaboration.For business users is the driving factor this market.
                    • hybrid devices provide convenience during presentations is the driving factor this market.
                    • video conferencing is the driving factor this market.
                    • and creative tasks. Devices such as the HP Spectre x360 and Dell XPS 13 2-in-1 combine high-performance hardware with touchscreen capabilities is the driving factor this market.
                    • making them ideal for professionals seeking enhanced versatility.As consumer preferences shift toward lightweight is the driving factor this market.
                    • portable is the driving factor this market.
                    • and flexible computing solutions is the driving factor this market.
                    • the demand for touchscreen-enabled hybrid and convertible laptops is expected to grow further. Advancements in touchscreen durability is the driving factor this market.
                    • battery efficiency is the driving factor this market.
                    • and display technologies will continue to drive this trend is the driving factor this market.
                    • contributing to the expansion of the global laptop touchscreen market. is the driving factor this market.

                    The Laptop Touchscreen market vendors should focus on grabbing business opportunities from the Capacitive segment as it accounted for the largest market share in the base year.