5G Services Market Size 2026-2030
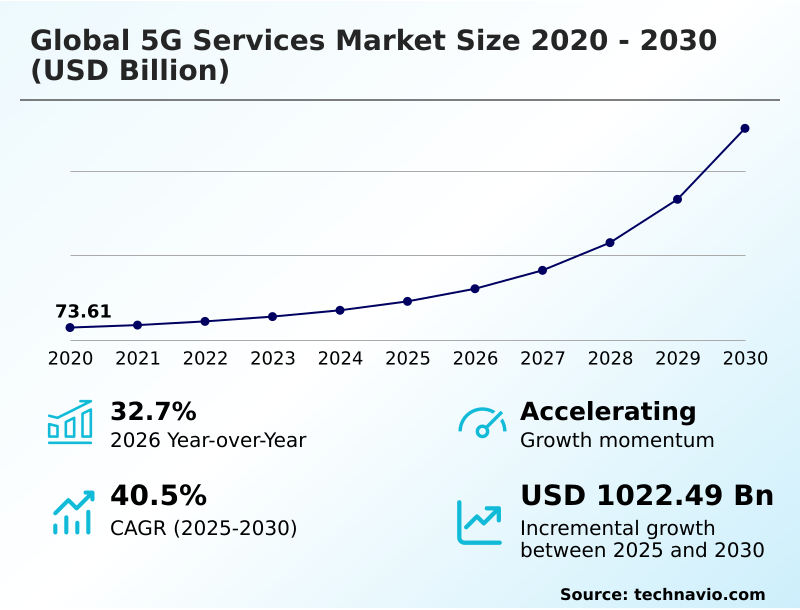
The 5g services market size is valued to increase by USD 1,022.49 billion, at a CAGR of 40.5% from 2025 to 2030. Surge in enterprise digital transformation and industry 4.0 adoption will drive the 5g services market.
Major Market Trends & Insights
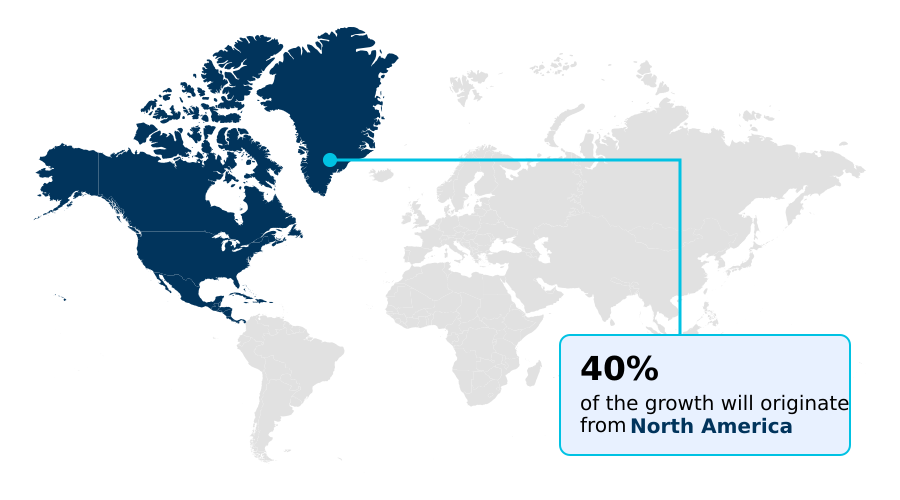
- North America dominated the market and accounted for a 39.8% growth during the forecast period.
- By Technology - eMBB segment was valued at USD 81.21 billion in 2024
- By End-user - Consumers segment accounted for the largest market revenue share in 2024
Market Size & Forecast
- Market Opportunities: USD 1,177.17 billion
- Market Future Opportunities: USD 1,022.49 billion
- CAGR from 2025 to 2030 : 40.5%
Market Summary
- The 5G services market is defined by its role as a catalyst for digital transformation across industries. The transition to cloud-native architectures and standalone 5G networks enables advanced capabilities such as network slicing and ultra-reliable low-latency communications (uRLLC), which are fundamental for mission-critical applications.
- In manufacturing, a private 5G network facilitates real-time data processing from thousands of IoT sensors, enabling predictive maintenance and improving production uptime by double-digit percentages. This shift moves beyond simple connectivity, creating ecosystems for industrial automation, smart city infrastructure, and immersive content through augmented reality (AR) and virtual reality (VR).
- However, realizing this potential requires overcoming significant capital expenditure for dense network rollouts and addressing complex cybersecurity vulnerabilities. The successful monetization of services hinges on developing high-value enterprise use cases, particularly in areas like fixed wireless access (FWA) and massive machine-type communications (mMTC), which promise new revenue streams beyond traditional mobile broadband.
- The market's evolution is shaped by the interplay between technological innovation, strategic investment, and regulatory frameworks governing spectrum harmonization.
What will be the Size of the 5G Services Market during the forecast period?
Get Key Insights on Market Forecast (PDF) Get Free Sample
How is the 5G Services Market Segmented?
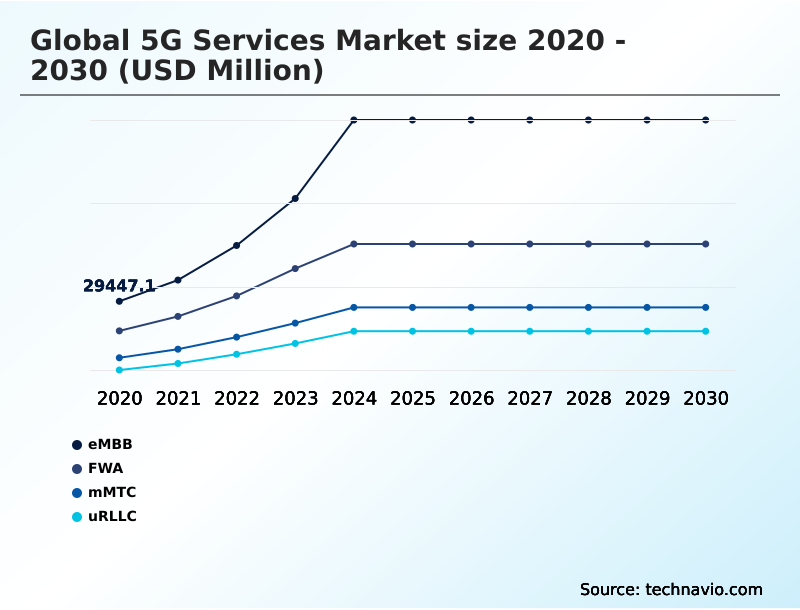
The 5g services industry research report provides comprehensive data (region-wise segment analysis), with forecasts and estimates in "USD million" for the period 2026-2030, as well as historical data from 2020-2024 for the following segments.
- Technology
- eMBB
- FWA
- mMTC
- uRLLC
- End-user
- Consumers
- Enterprises
- Deployment
- Public 5G
- Private 5G
- Hybrid 5G
- Geography
- North America
- US
- Canada
- Mexico
- APAC
- China
- Japan
- South Korea
- Europe
- Germany
- UK
- France
- Middle East and Africa
- Saudi Arabia
- UAE
- South Africa
- South America
- Brazil
- Argentina
- Colombia
- Rest of World (ROW)
- North America
By Technology Insights
The embb segment is estimated to witness significant growth during the forecast period.
Enhanced mobile broadband (eMBB) is the foundational service layer, addressing the demand for higher data rates and system capacity driven by immersive content consumption.
This segment leverages both millimeter-wave spectrum and sub-6 GHz spectrum, utilizing advanced beamforming technologies to manage high-density deployments in urban centers. For enterprises, eMBB supports high-throughput connectivity for data-intensive software-driven operations and cloud gaming.
The evolution toward standalone 5G is critical, as it allows for more efficient data transmission and underpins the development of augmented reality (AR) applications. For mission-critical services, this technology achieves reliability rates exceeding 99.999%, ensuring operational continuity.
This capability is crucial for industrial automation and remote patient monitoring, where performance is non-negotiable.
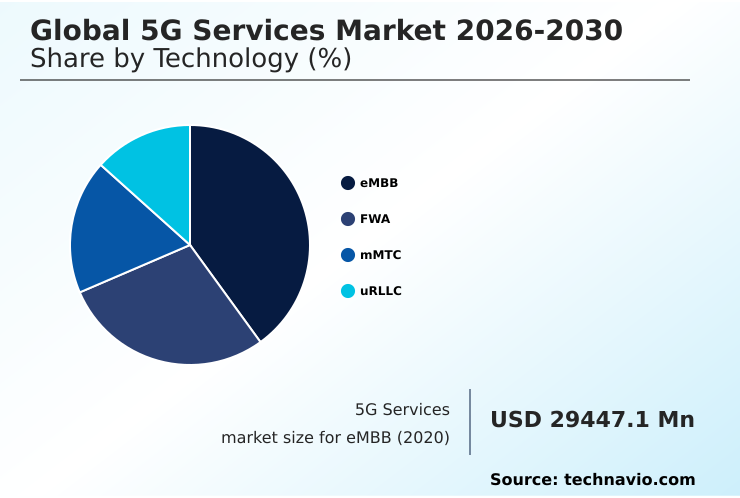
The eMBB segment was valued at USD 81.21 billion in 2024 and showed a gradual increase during the forecast period.
Regional Analysis
North America is estimated to contribute 39.8% to the growth of the global market during the forecast period.Technavio’s analysts have elaborately explained the regional trends and drivers that shape the market during the forecast period.
See How 5G Services Market Demand is Rising in North America Get Free Sample
The geographic landscape of the 5G services market is characterized by varied adoption rates and strategic priorities.
North America leads in market maturity and contributes approximately 39.8% of the incremental growth, driven by aggressive deployments of standalone 5G and fixed wireless access (FWA) solutions.
In this region, a focus on industrial automation and smart factory solutions leverages ultra-reliable low-latency communications (uRLLC) to support mission-critical applications.
Meanwhile, the APAC region, led by China and South Korea, focuses on massive machine-type communications (mMTC) for smart city infrastructure and high-density deployments.
European markets prioritize spectrum harmonization and the use of private 5G networks for industry 4.0, particularly in manufacturing. The successful rollout of these advanced services, such as remote robotic surgery, depends on achieving network reliability greater than 99.999%.
Market Dynamics
Our researchers analyzed the data with 2025 as the base year, along with the key drivers, trends, and challenges. A holistic analysis of drivers will help companies refine their marketing strategies to gain a competitive advantage.
- The evolution of the 5G services market is increasingly specialized, with distinct growth trajectories emerging around specific high-value applications. The 5G services market for mission-critical industrial automation, for example, is a key focus, as it promises to redefine manufacturing efficiency and safety.
- Central to this is the implementation of robust private 5G network security protocols for enterprise environments, which are essential for protecting sensitive operational data and ensuring system integrity. The technical performance of these networks is a major differentiator.
- Specifically, the edge computing impact on 5G network latency is a critical factor, with deployments showing processing time reductions more than twice as fast as traditional centralized architectures. This low-latency performance enables operators to offer network slicing for guaranteed enterprise service levels, creating customized virtual networks for applications ranging from autonomous vehicle fleets to remote surgical systems.
- In parallel, a significant opportunity lies in monetizing 5G services through fixed wireless access, which provides a competitive alternative to wired broadband in underserved residential and business markets, expanding the addressable customer base for telecommunication providers.
What are the key market drivers leading to the rise in the adoption of 5G Services Industry?
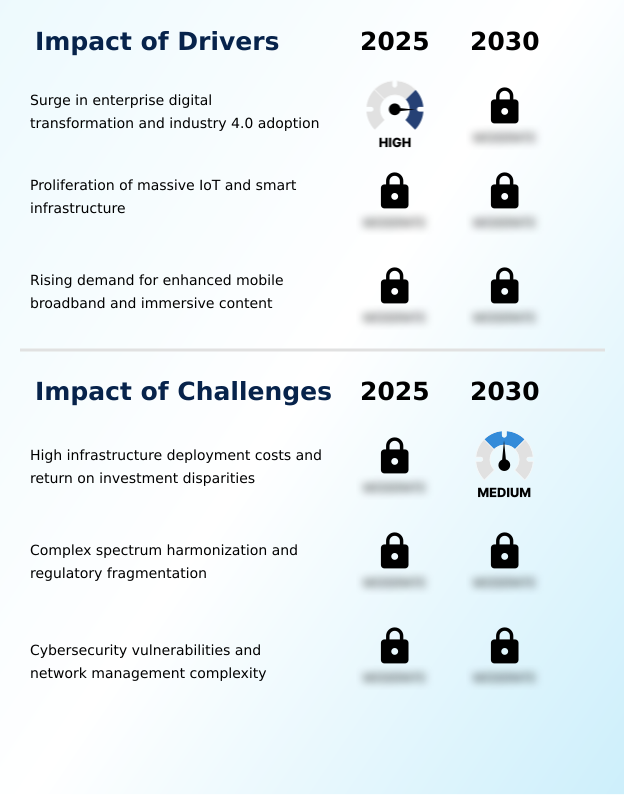
- The market is primarily driven by the surge in enterprise digital transformation and the broad adoption of Industry 4.0 principles.
- The market's growth is largely fueled by enterprise digital transformation and the adoption of Industry 4.0, where 5G's low-latency connectivity is essential.
- In manufacturing, the deployment of private 5G networks enables predictive maintenance and collaborative robotics, which can increase operational efficiency by 20%. A second driver is the proliferation of the internet of things (IoT) and smart city infrastructure.
- The ability of massive machine-type communications (mMTC) to support thousands of concurrent connections facilitates intelligent traffic management and smart home ecosystems, driving demand for scalable networks.
- The third driver is the rising consumer demand for enhanced mobile broadband (eMBB) to support immersive content consumption, including 4K/8K video streaming and cloud gaming, with fixed wireless access (FWA) emerging as a key solution for home broadband, capturing a 15% share of new connections in some areas.
What are the market trends shaping the 5G Services Industry?
- The integration of artificial intelligence and machine learning in network operations is an emerging market trend. This is driven by the need to manage 5G infrastructure complexity and optimize network performance.
- A primary trend influencing the 5G services market is the integration of artificial intelligence into network operations, enabling self-optimizing and self-healing systems that improve efficiency by up to 25%. This synergy of 5G and AI is creating a more resilient infrastructure, essential for mission-critical applications and high-density deployments.
- Another significant development is the maturation of network slicing, which allows operators to offer bespoke service-level agreements (SLA) for different industry verticals. This shift from one-size-fits-all plans to customized solutions for applications like remote robotic surgery and smart utility grids is opening new monetization paths. Furthermore, the expansion of edge computing is enabling decentralized data processing.
- This is critical for applications demanding near-instant response times, such as autonomous vehicle navigation and real-time coaching analytics, which can reduce data transmission latency by over 80%.
What challenges does the 5G Services Industry face during its growth?
- A significant challenge affecting industry growth involves high infrastructure deployment costs and notable disparities in return on investment across different applications.
- A significant challenge is the high capital expenditure required for network densification, particularly for millimeter-wave spectrum deployments, which can increase rollout costs by 40% compared to previous generations. This financial pressure is compounded by an uncertain return on investment (ROI), as consumer willingness to pay a premium is not yet established.
- Another challenge is the fragmented regulatory landscape and the lack of spectrum harmonization across regions, which complicates cross-border service continuity and increases hardware design complexity for radio access network (RAN) equipment. Finally, the shift to cloud-native architectures and software-defined networking (SDN) expands cybersecurity vulnerabilities.
- The complexity of managing millions of IoT endpoints and ensuring traffic isolation via network slicing presents a substantial security risk, raising operational security costs by an estimated 15-20%.
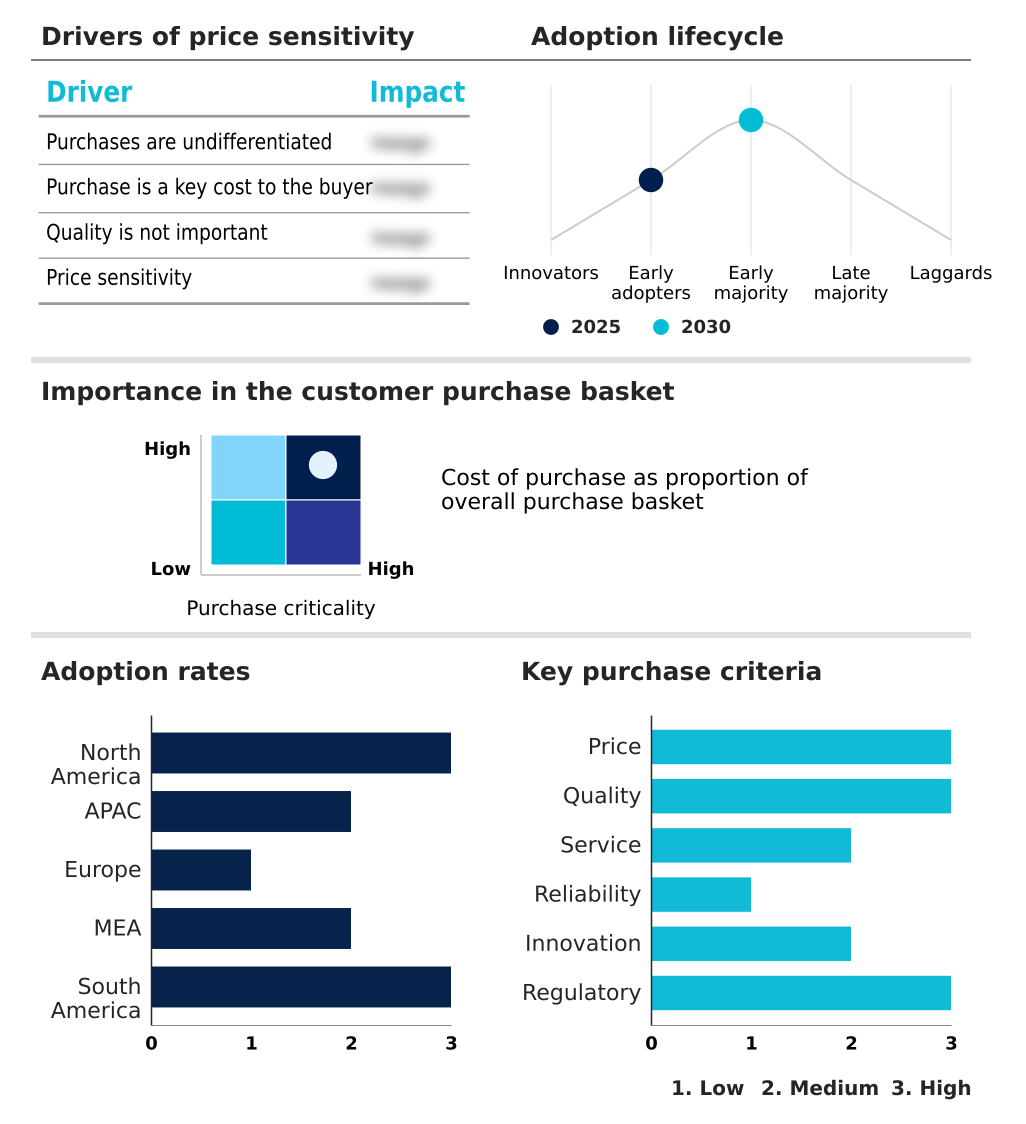
Exclusive Technavio Analysis on Customer Landscape
The 5g services market forecasting report includes the adoption lifecycle of the market, covering from the innovator’s stage to the laggard’s stage. It focuses on adoption rates in different regions based on penetration. Furthermore, the 5g services market report also includes key purchase criteria and drivers of price sensitivity to help companies evaluate and develop their market growth analysis strategies.
Customer Landscape of 5G Services Industry
Competitive Landscape
Companies are implementing various strategies, such as strategic alliances, 5g services market forecast, partnerships, mergers and acquisitions, geographical expansion, and product/service launches, to enhance their presence in the industry.
America Movil SAB de CV - An enterprise connectivity portfolio leverages nationwide mobile broadband, fixed wireless internet, and edge computing capabilities to accelerate digital transformation for business clients.
The industry research and growth report includes detailed analyses of the competitive landscape of the market and information about key companies, including:
- America Movil SAB de CV
- AT and T Inc.
- BT Group Plc
- China Mobile Ltd.
- Cisco Systems Inc.
- Deutsche Telekom AG
- LG Uplus Corp.
- NEC Corp.
- NTT DOCOMO
- Orange SA
- Rogers Communications Inc.
- Samsung Electronics Co. Ltd.
- Singapore Telecom Ltd.
- SK Telecom Co. Ltd.
- Swisscom Ltd.
- T Mobile US Inc.
- Telstra Corp. Ltd.
- Verizon Communications Inc.
- Vodafone Group Plc
- ZTE Corp.
Qualitative and quantitative analysis of companies has been conducted to help clients understand the wider business environment as well as the strengths and weaknesses of key industry players. Data is qualitatively analyzed to categorize companies as pure play, category-focused, industry-focused, and diversified; it is quantitatively analyzed to categorize companies as dominant, leading, strong, tentative, and weak.
Recent Development and News in 5g services market
- In April, 2025, Claro Brasil reported achieving median download speeds exceeding 400 Mbps in several state capitals, significantly enhancing the adoption of cloud-based services across the region.
- In August, 2025, Verizon Communications Inc. expanded its private 5G partnership with the National Football League to include augmented reality fan experiences and real-time coaching analytics in major stadiums.
- In September, 2025, Saudi Telecom Company (stc) successfully deployed a specialized private 5G network for an offshore oil and gas facility in the Red Sea, ensuring mission-critical data security in a harsh environment.
- In October, 2025, e& (formerly Etisalat) signed an agreement with Ericsson to accelerate the monetization of its 5G standalone core through the introduction of premium gaming and immersive media services.
Dive into Technavio’s robust research methodology, blending expert interviews, extensive data synthesis, and validated models for unparalleled 5G Services Market insights. See full methodology.
| Market Scope | |
|---|---|
| Page number | 299 |
| Base year | 2025 |
| Historic period | 2020-2024 |
| Forecast period | 2026-2030 |
| Growth momentum & CAGR | Accelerate at a CAGR of 40.5% |
| Market growth 2026-2030 | USD 1022490.7 million |
| Market structure | Fragmented |
| YoY growth 2025-2026(%) | 32.7% |
| Key countries | US, Canada, Mexico, China, Japan, South Korea, India, Australia, Indonesia, Germany, UK, France, Italy, Spain, The Netherlands, Saudi Arabia, UAE, South Africa, Egypt, Nigeria, Brazil, Argentina and Colombia |
| Competitive landscape | Leading Companies, Market Positioning of Companies, Competitive Strategies, and Industry Risks |
Research Analyst Overview
- The 5G services market is rapidly evolving beyond enhanced mobile broadband (eMBB) into a foundational platform for widespread digital transformation. This progression is enabled by a suite of advanced technologies, including millimeter-wave spectrum, massive MIMO, and sophisticated beamforming technologies that collectively enhance network capacity.
- The shift to cloud-native architectures and standalone 5G is pivotal, facilitating key functionalities like network slicing and ultra-reliable low-latency communications (uRLLC). These capabilities are crucial for industry 4.0 applications and mission-critical services. The adoption of Open Radio Access Network (Open RAN) standards, alongside network functions virtualization (NFV) and software-defined networking (SDN), promotes a more flexible and competitive ecosystem.
- The 5G core network, supported by network orchestration and voice over new radio (VoNR), delivers performance improvements, including a 90% reduction in latency for specific use cases. As fixed wireless access (FWA) and massive machine-type communications (mMTC) expand, service providers must balance capital expenditure with return on investment (ROI) while navigating cybersecurity vulnerabilities and complex spectrum harmonization challenges.
What are the Key Data Covered in this 5G Services Market Research and Growth Report?
-
What is the expected growth of the 5G Services Market between 2026 and 2030?
-
USD 1,022.49 billion, at a CAGR of 40.5%
-
-
What segmentation does the market report cover?
-
The report is segmented by Technology (eMBB, FWA, mMTC, and uRLLC), End-user (Consumers, and Enterprises), Deployment (Public 5G, Private 5G, and Hybrid 5G) and Geography (North America, APAC, Europe, Middle East and Africa, South America)
-
-
Which regions are analyzed in the report?
-
North America, APAC, Europe, Middle East and Africa and South America
-
-
What are the key growth drivers and market challenges?
-
Surge in enterprise digital transformation and industry 4.0 adoption, High infrastructure deployment costs and return on investment disparities
-
-
Who are the major players in the 5G Services Market?
-
America Movil SAB de CV, AT and T Inc., BT Group Plc, China Mobile Ltd., Cisco Systems Inc., Deutsche Telekom AG, LG Uplus Corp., NEC Corp., NTT DOCOMO, Orange SA, Rogers Communications Inc., Samsung Electronics Co. Ltd., Singapore Telecom Ltd., SK Telecom Co. Ltd., Swisscom Ltd., T Mobile US Inc., Telstra Corp. Ltd., Verizon Communications Inc., Vodafone Group Plc and ZTE Corp.
-
Market Research Insights
- The market's dynamics are increasingly shaped by the enterprise adoption of specialized 5G capabilities. The deployment of private 5G networks for industrial automation and smart factory solutions is accelerating, with early adopters reporting up to a 30% reduction in production line downtime.
- This shift is supported by high-throughput connectivity for collaborative robotics and real-time data processing for supply chain optimization, which shows a 15% improvement in logistics efficiency over legacy systems. Furthermore, the expansion of last-mile connectivity solutions is driving new opportunities in smart agriculture and remote patient monitoring.
- As organizations integrate these software-driven operations, the demand for low-latency connectivity to support mission-critical applications and autonomous vehicle navigation continues to grow, fundamentally reshaping business models and competitive strategies.
We can help! Our analysts can customize this 5g services market research report to meet your requirements.
 RIA -
RIA - 
