Detachable Tablet Market Size 2025-2029
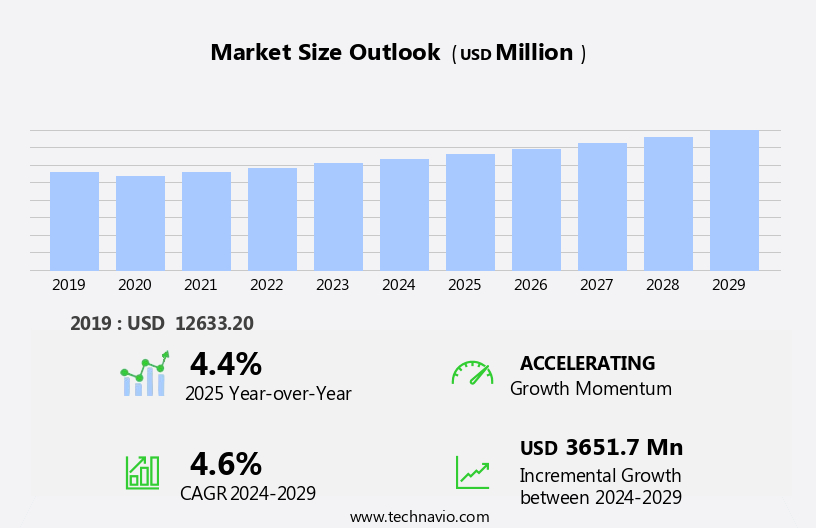
The detachable tablet market size is forecast to increase by USD 3.65 billion, at a CAGR of 4.6% between 2024 and 2029.
- The market is experiencing significant growth, driven by the proliferation of affordable options and the increasing implementation of portable PCs in education institutions. The availability of low-cost detachable tablets is expanding the market's reach, making these devices accessible to a broader consumer base. Additionally, the adoption of convertible laptops, which offer the functionality of both a laptop and a tablet, is increasing as users seek versatile devices for both personal and professional use. However, the market faces challenges, including the high price point of premium detachable tablets and the growing competition from other mobile devices, such as smartphones and laptops.
- Furthermore, the lack of standardization in detachable tablet design and compatibility with various software applications can hinder market growth. Companies looking to capitalize on market opportunities must focus on offering competitive pricing, ensuring compatibility with popular software, and providing innovative features to differentiate their products. Effective navigation of these challenges requires a deep understanding of consumer needs and preferences, as well as a commitment to continuous product innovation.
What will be the Size of the Detachable Tablet Market during the forecast period?
The market continues to evolve, driven by advancements in technology and shifting consumer preferences. Cloud storage solutions enable seamless access to digital content, while long battery life allows for uninterrupted use. The integration of detachable keyboards transforms these devices into productive 2-in-1 laptops, catering to the needs of professionals. Virtual reality applications expand the market's reach, offering immersive experiences in various sectors. Moreover, viewing angles and high-definition displays enhance the user experience, ensuring crisp visuals for multimedia consumption. The fusion of digital content and detachable tablets facilitates multitasking and flexibility, making these devices indispensable in mobile computing.
Battery life, a critical factor, is continuously improving, ensuring longer usage hours. Detachable keyboards, with their magnetic connectors, offer a sleek design and easy portability. Virtual reality applications, with their immersive capabilities, are revolutionizing industries such as education, healthcare, and entertainment. The ongoing development of detachable tablets is further fueled by advancements in digital content, virtual reality, and productivity suites. Machine learning and artificial intelligence enhance user experience, while capacitive touchscreens and digital pens cater to creative professionals. Fingerprint sensors and screen protectors ensure data protection, making these devices secure and reliable. In summary, the market is characterized by continuous innovation and evolving patterns, offering versatile solutions for various applications in mobile computing.
The integration of cloud storage, detachable keyboards, virtual reality, viewing angle, and digital content creates a dynamic market that caters to the ever-changing needs of consumers and businesses alike.
How is this Detachable Tablet Industry segmented?
The detachable tablet industry research report provides comprehensive data (region-wise segment analysis), with forecasts and estimates in "USD million" for the period 2025-2029, as well as historical data from 2019-2023 for the following segments.
- OS
- Windows
- iPadOS
- Others
- Type
- Below 8 inches
- 8 inches
- Above 8 inches
- Application
- Personal
- Professional
- Geography
- North America
- US
- Canada
- Europe
- France
- Germany
- UK
- APAC
- Australia
- China
- India
- Japan
- South Korea
- Rest of World (ROW)
- North America
By OS Insights
The windows segment is estimated to witness significant growth during the forecast period.
In the dynamic world of technology, the market continues to evolve, integrating advanced features that cater to both personal and professional use. Microsoft's Windows, an operating system installed on the majority of electronic devices, powers many detachable tablets. Windows, with its long-standing history dating back to 1985, offers compatibility with a vast array of software applications. The latest addition to the Windows family, Windows 11, was released in October 2022, and since then, Microsoft has consistently delivered updates to improve user experience. One such update, version 23H2, was made available on October 31, 2023. Data protection is a priority in today's digital age, and detachable tablets are no exception.
Advanced security features like face recognition, fingerprint sensors, and machine learning algorithms are increasingly becoming standard. These devices also offer cloud storage for seamless data access and backup. Moreover, detachable tablets are not just limited to productivity. They come equipped with front and rear cameras for capturing high-quality images and videos. Virtual assistants like Cortana and Siri, powered by artificial intelligence, make multitasking a breeze. Augmented reality and virtual reality technologies offer immersive experiences, enhancing user engagement. Detachable tablets, also known as 2-in-1 laptops, offer the versatility of a laptop and the portability of a tablet. They come with capacitive touchscreens, stylus pens, and detachable keyboards, providing an optimal user experience.
Core i5 and i7 processors ensure smooth performance, while long battery life keeps users productive on the go. The market for detachable tablets is continually innovating, with technologies like chrome OS, hybrid devices, and convertible laptops gaining popularity. High-resolution displays with excellent contrast ratios and viewing angles offer superior digital content consumption. Magnetic connectors ensure secure and seamless attachment of keyboards and other accessories. In summary, the market is a dynamic and innovative space, offering a blend of productivity and entertainment. With advanced features like data protection, virtual assistants, augmented reality, and machine learning, these devices cater to the evolving needs of users in the mobile computing era.
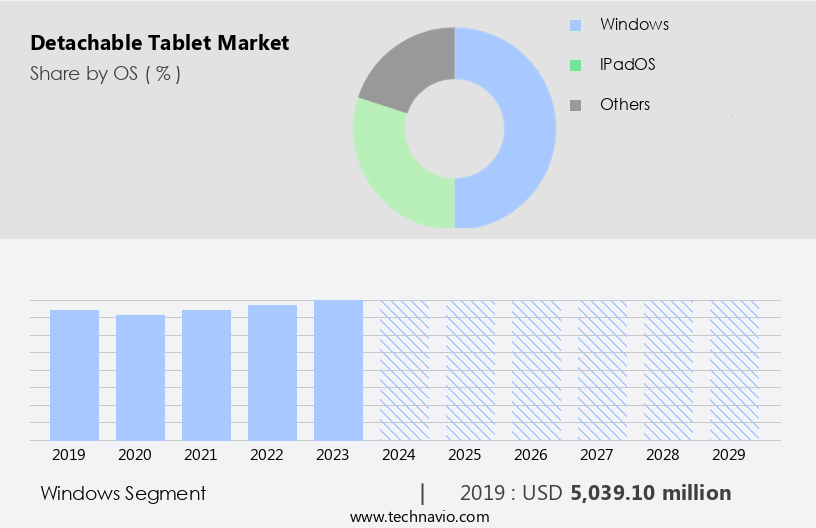
The Windows segment was valued at USD 5.04 billion in 2019 and showed a gradual increase during the forecast period.
Regional Analysis
APAC is estimated to contribute 47% to the growth of the global market during the forecast period.Technavio's analysts have elaborately explained the regional trends and drivers that shape the market during the forecast period.
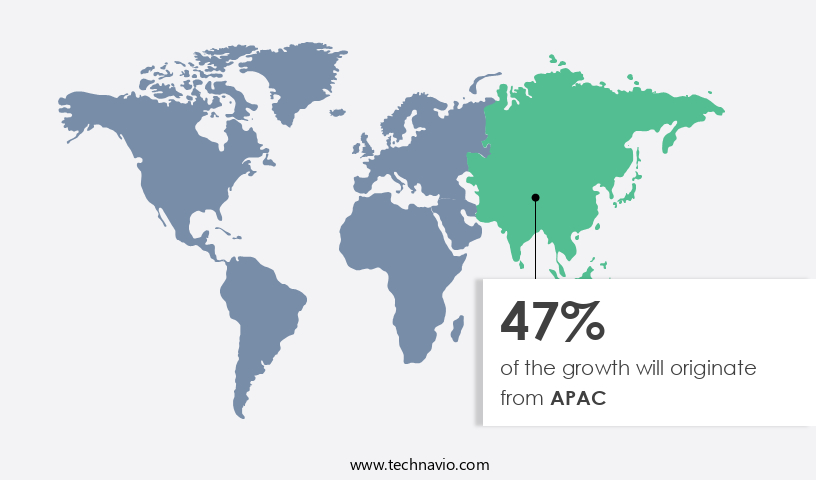
The market in APAC is experiencing significant growth due to the region's concentration of manufacturers producing high-performance, affordable devices. Companies like Samsung Electronics, Fujitsu, ASUSTeK Computer, Lenovo Group, Huawei Investment and Holding, VAIO Corp., and Toshiba are driving market expansion by leveraging low production costs and integrating advanced technologies such as front and rear cameras, face recognition, virtual assistant, augmented reality, artificial intelligence, and machine learning. These features enhance user experience, making detachable tablets increasingly popular in sectors like education, banking, sports, and manufacturing. Operating systems such as Chrome OS, hybrid devices, and 2-in-1 laptops are also gaining traction, offering the versatility of a laptop and the portability of a tablet.
Additionally, the integration of core i5 and i7 processors, magnetic connectors, and cloud storage further boosts the market's growth. Detachable keyboards, capacitive touchscreens, screen protectors, and fingerprint sensors are additional features that cater to the demand for improved productivity and data protection. With the continuous advancement of digital content and virtual reality, battery life and viewing angle have become crucial factors, ensuring long-lasting usage and optimal visual experience.
Market Dynamics
Our researchers analyzed the data with 2024 as the base year, along with the key drivers, trends, and challenges. A holistic analysis of drivers will help companies refine their marketing strategies to gain a competitive advantage.
What are the key market drivers leading to the rise in the adoption of Detachable Tablet Industry?
- The proliferation of low-cost detachable tablets serves as the primary catalyst for market growth. These devices offer affordability and versatility, making them an attractive option for consumers and significantly contributing to the expansion of the market.
- The market has experienced significant growth due to the increasing trend of mobile computing and the demand for immersive user experiences. Major companies are introducing innovative devices with capacitive touchscreens, magnetic connectors, and accessories such as screen protectors and digital pens. These tablets offer the functionality of a laptop and the portability of a tablet, making them an attractive alternative to traditional laptops. In recent years, the market has seen a decline in laptop sales due to their high prices. In response, manufacturers have started producing detachable tablets with affordable price points, featuring processors like core i5 and core i7, to cater to price-sensitive customers.
- Some of these devices also include advanced features such as fingerprint sensors. The list below showcases the prices of various detachable tablets available in the market: 1. Microsoft Surface Pro 7 - USD749 2. Lenovo Yoga C940 - USD999 3. HP Spectre x360 - USD829 4. Samsung Galaxy Tab S7 - USD649 5. Apple iPad Pro - USD799 These devices offer a harmonious blend of performance and portability, making them an excellent investment for both personal and professional use. In conclusion, the market is expected to continue growing as more companies enter the market and offer competitive pricing and innovative features.
What are the market trends shaping the Detachable Tablet Industry?
- The use of portable PCs in education institutions is becoming increasingly prevalent, representing a significant market trend. This shift towards mobile computing solutions is driven by the flexibility and convenience they offer, enhancing the learning experience for students.
- Detachable tablets are gaining popularity in educational institutions due to their versatility and convenience. These devices offer the benefits of a laptop and a tablet in one, with the added advantage of a detachable keyboard. The adoption of cloud storage solutions enables students to access digital content from anywhere, making learning more flexible. Furthermore, virtual reality technology enhances the learning experience by providing immersive and harmonious environments. The shift towards online education is another factor driving the demand for detachable tablets. Institutions such as K-12 are offering online courses, providing students with the flexibility to learn at their own pace.
- Additionally, the rise of online course providers like Coursera, edX, and Udemy has led to an increase in the number of students opting for digital learning. The long battery life of detachable tablets ensures that students can learn uninterrupted, making them an ideal choice for educational institutions. With their wide viewing angles, these devices offer a comfortable viewing experience, making them suitable for extended periods of use. Overall, the adoption of detachable tablets in education is a response to the changing learning landscape, providing students with the tools they need to succeed in a digital world.
What challenges does the Detachable Tablet Industry face during its growth?
- The surge in the adoption of convertible laptops poses a significant challenge to the industry's growth trajectory.
- The market has experienced significant growth in recent years due to the integration of advanced technologies and high-functionality components. These devices, also known as convertible laptops or 2-in-1 laptops, offer the convenience of a tablet and the functionality of a laptop. They can be used in various modes, including tent mode and full 360-degree rotation, making them versatile for different use cases. Key features driving the demand for detachable tablets include biometric security measures like fingerprint readers, front and rear cameras, and large storage capacities. With the increasing importance of data protection, these devices have become essential tools for both personal and professional use.
- Moreover, the integration of artificial intelligence (AI), virtual assistants, augmented reality (AR), and internet of things (IoT) technologies has made detachable tablets more immersive and harmonious. These advanced features enable users to enhance their productivity and enjoy a seamless user experience. In conclusion, the market is expected to continue its growth trajectory, fueled by the integration of cutting-edge technologies and the need for high-functionality devices. Companies are continually launching new models with enhanced features and advanced components to cater to the evolving demands of consumers.
Exclusive Customer Landscape
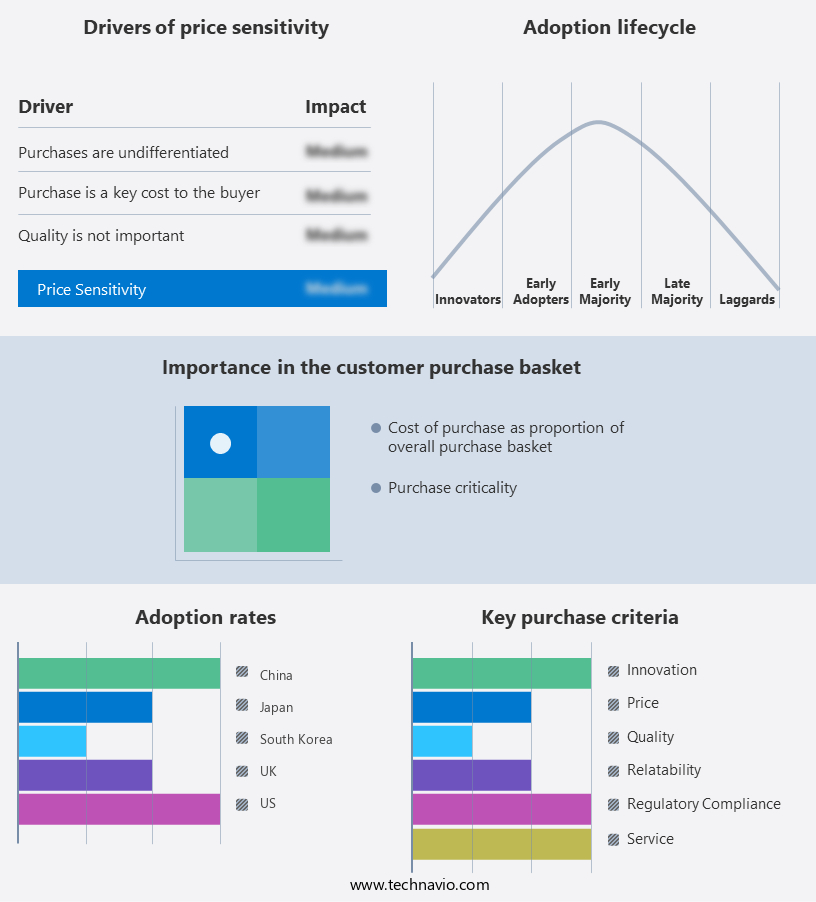
The detachable tablet market forecasting report includes the adoption lifecycle of the market, covering from the innovator's stage to the laggard's stage. It focuses on adoption rates in different regions based on penetration. Furthermore, the detachable tablet market report also includes key purchase criteria and drivers of price sensitivity to help companies evaluate and develop their market growth analysis strategies.
Customer Landscape
Key Companies & Market Insights
Companies are implementing various strategies, such as strategic alliances, detachable tablet market forecast, partnerships, mergers and acquisitions, geographical expansion, and product/service launches, to enhance their presence in the industry.
Acer Inc. - The Aspire Switch 10 detachable tablet boasts a full high-definition display, delivering crisp clarity and vibrant colors from all perspectives. This innovative device caters to the modern professional's need for a versatile and visually stunning technology solution. With its advanced screen technology, users can expect an immersive viewing experience, enhancing productivity and engagement in various applications. The tablet's detachable design offers flexibility, enabling seamless transition between tablet and laptop modes, making it an ideal companion for both personal and business use.
The industry research and growth report includes detailed analyses of the competitive landscape of the market and information about key companies, including:
- Acer Inc.
- Alco Holdings Ltd
- Alphabet Inc.
- Apple Inc.
- ASUSTeK Computer Inc.
- Chuwi Innovation Ltd.
- Dell Technologies Inc.
- Fujitsu Ltd.
- HP Inc.
- Huawei Technologies Co. Ltd.
- Lenovo Group Ltd.
- Microsoft Corp.
- Samsung Electronics Co. Ltd.
- Smartron India Pvt. Ltd.
- Technicolor SA
- Teclast Electronics Co., Ltd.
- Toshiba Corp.
- TREKSTOR GmbH
- VAIO Corp.
Qualitative and quantitative analysis of companies has been conducted to help clients understand the wider business environment as well as the strengths and weaknesses of key industry players. Data is qualitatively analyzed to categorize companies as pure play, category-focused, industry-focused, and diversified; it is quantitatively analyzed to categorize companies as dominant, leading, strong, tentative, and weak.
Recent Development and News in Detachable Tablet Market
- In February 2023, Microsoft introduced the Surface Neo, a dual-screen detachable tablet, marking a significant leap in the market with its innovative form factor (Microsoft Press Release). This new device is expected to challenge Apple's iPad Pro and Samsung's Galaxy Tab S7 series.
- In June 2022, Lenovo and Google announced a strategic partnership to develop Chromebook tablets with detachable keyboards, targeting the education sector (Lenovo Press Release). This collaboration is expected to expand Lenovo's presence in the Chromebook market and strengthen Google's position in the education technology sector.
- In December 2021, Samsung announced a strategic investment of USD300 million in Magic Leap, a leading augmented reality company (Samsung Newsroom). This investment aims to accelerate the development of detachable tablets with augmented reality capabilities, setting Samsung apart from competitors and positioning it as a pioneer in the next generation of detachable devices.
- In March 2020, Apple's iPad Pro with M1 chip was released, offering significant performance improvements and making it a strong competitor in the market (Apple Press Release). This technological advancement has boosted Apple's market share and set a new standard for detachable tablets in terms of processing power and efficiency.
Research Analyst Overview
- The market is witnessing significant growth, driven by the demand for versatile devices that offer the functionality of a laptop and the portability of a tablet. Tablet cases, screen digitizers, and tablet repair services are essential accessories for this market, ensuring user convenience and device protection. Tablet docking stations, power adapters, and charging solutions cater to the need for extended battery life and productivity. Speaker outputs and tablet keyboards enhance multimedia and productivity experiences, while firmware updates and cloud synchronization enable seamless data management. Tablet usage monitoring, parental controls, and security software address concerns around privacy and productivity.
- Fast charging, HDMI output, and application stores cater to the demands of power users and content creators. Tablet accessories, such as stylus tip replacement and USB-C ports, cater to the creative needs of artists and professionals. Tablet protection plans, drivers, and wireless charging offer peace of mind and added functionality. Tablet software compatibility, data backup, and software updates ensure a seamless user experience and productivity. Gaming performance and tablet stand options cater to the entertainment needs of consumers. In summary, the market is dynamic and diverse, with a range of accessories and solutions addressing various user needs and preferences.
- From protection and productivity to entertainment and creativity, the market offers a comprehensive ecosystem for users seeking versatile devices.
Dive into Technavio's robust research methodology, blending expert interviews, extensive data synthesis, and validated models for unparalleled Detachable Tablet Market insights. See full methodology.
|
Market Scope |
|
|
Report Coverage |
Details |
|
Page number |
220 |
|
Base year |
2024 |
|
Historic period |
2019-2023 |
|
Forecast period |
2025-2029 |
|
Growth momentum & CAGR |
Accelerate at a CAGR of 4.6% |
|
Market growth 2025-2029 |
USD 3651.7 million |
|
Market structure |
Fragmented |
|
YoY growth 2024-2025(%) |
4.4 |
|
Key countries |
US, China, Japan, India, Canada, South Korea, UK, Germany, Australia, and France |
|
Competitive landscape |
Leading Companies, Market Positioning of Companies, Competitive Strategies, and Industry Risks |
What are the Key Data Covered in this Detachable Tablet Market Research and Growth Report?
- CAGR of the Detachable Tablet industry during the forecast period
- Detailed information on factors that will drive the growth and forecasting between 2025 and 2029
- Precise estimation of the size of the market and its contribution of the industry in focus to the parent market
- Accurate predictions about upcoming growth and trends and changes in consumer behaviour
- Growth of the market across APAC, North America, Europe, South America, and Middle East and Africa
- Thorough analysis of the market's competitive landscape and detailed information about companies
- Comprehensive analysis of factors that will challenge the detachable tablet market growth of industry companies
We can help! Our analysts can customize this detachable tablet market research report to meet your requirements.
 RIA -
RIA - 
