Large Format Printers Market Analysis, Size, and Forecast 2026-2030: APAC (China, Japan, and India), North America (US, Canada, and Mexico), Europe (Germany, UK, and France), South America (Brazil, Argentina, and Chile), Middle East and Africa (Saudi Arabia, UAE, and South Africa), and Rest of World (ROW)

Large Format Printers Market Analysis, Size, and Forecast 2026-2030:
APAC (China, Japan, and India), North America (US, Canada, and Mexico), Europe (Germany, UK, and France), South America (Brazil, Argentina, and Chile), Middle East and Africa (Saudi Arabia, UAE, and South Africa), and Rest of World (ROW)

Published: May 2026 343 Pages SKU: IRTNTR43001

Market Overview at a Glance

$1.27 B
Market Opportunity
3%
CAGR 2025 - 2030
47%
APAC Growth
$3.47 B
Aqueous segment 2024

Large Format Printers Market Size 2026-2030

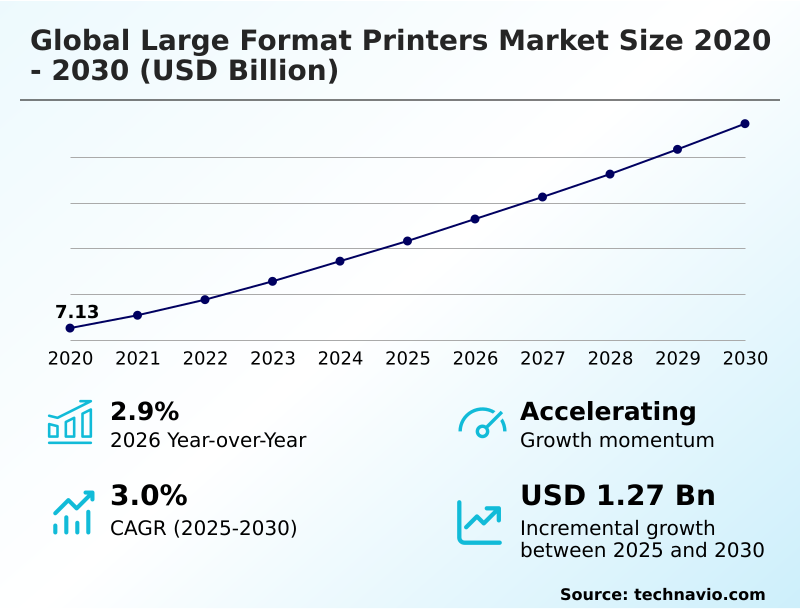
The large format printers market size is valued to increase by USD 1.27 billion, at a CAGR of 3% from 2025 to 2030. Rising demand for personalization and customization will drive the large format printers market.

Major Market Trends & Insights

  • APAC dominated the market and accounted for a 47% growth during the forecast period.
  • By Technology - Aqueous segment was valued at USD 3.47 billion in 2024
  • By Type - Ink-based segment accounted for the largest market revenue share in 2024

Market Size & Forecast

  • Market Opportunities: USD 2.23 billion
  • Market Future Opportunities: USD 1.27 billion
  • CAGR from 2025 to 2030 : 3%

Market Summary

  • The Large Format Printers Market operates as a critical infrastructure component for visual communication, industrial manufacturing, and customized packaging. Businesses increasingly rely on these advanced systems to execute rapid, high-fidelity graphic production.
  • In a standard supply chain optimization scenario, companies transition from traditional analog setups to fully digitized flatbed systems, successfully decreasing inventory holding costs by 22% through on-demand production capabilities. The rising demand for mass personalization acts as a powerful driver, compelling retail and textile sectors to deploy advanced digital endpoints that quickly adapt to shifting consumer aesthetics.
  • Consequently, this shift enables brands to reduce material waste while delivering highly targeted localized campaigns. Conversely, stringent environmental regulations regarding chemical emissions serve as a major operational challenge. These strict compliance mandates force print service providers to overhaul existing hardware to accommodate eco-friendly substrates, thereby increasing initial capital expenditures.
  • Ultimately, the continuous integration of intelligent workflow software enhances machine-to-machine communication, ensuring that production environments remain agile, compliant, and highly efficient.

What will be the Size of the Large Format Printers Market during the forecast period?

Get Key Insights on Market Forecast (PDF) Get Free Sample

How is the Large Format Printers Market Segmented?

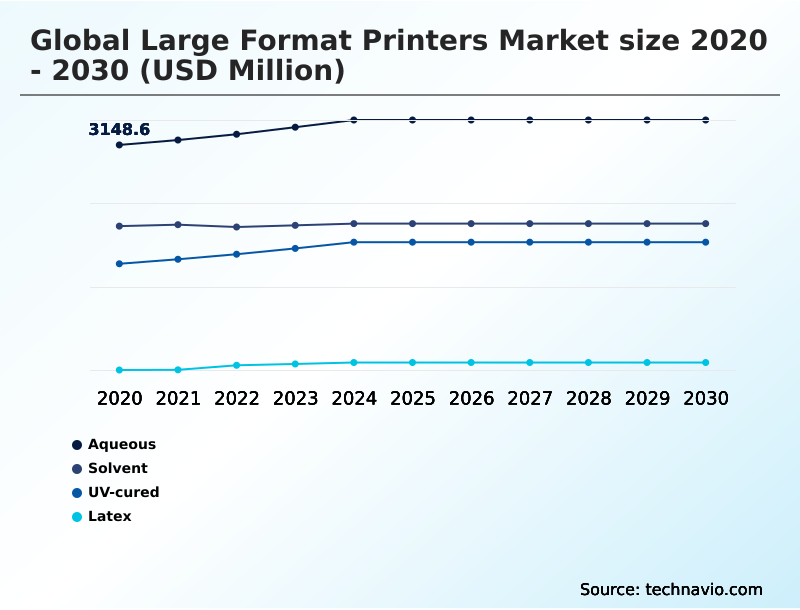
The large format printers industry research report provides comprehensive data (region-wise segment analysis), with forecasts and estimates in "USD million" for the period 2026-2030, as well as historical data from 2020-2024 for the following segments.

  • Technology
    • Aqueous
    • Solvent
    • UV-cured
    • Latex
  • Type
    • Ink-based
    • Toner-based
  • Material
    • Paper
    • Vinyl
    • Fabric
    • Others
  • Connectivity
    • Wired
    • Wireless
  • Application
    • Apparel and textiles
    • Signage and advertising
    • Decor and interior design
    • CAD and technical printing
    • Others
  • Geography
    • APAC
      • China
      • Japan
      • India
      • South Korea
      • Australia
      • Indonesia
    • North America
      • US
      • Canada
      • Mexico
    • Europe
      • Germany
      • UK
      • France
      • Italy
      • Spain
      • The Netherlands
    • South America
      • Brazil
      • Argentina
      • Chile
    • Middle East and Africa
      • Saudi Arabia
      • UAE
      • South Africa
      • Turkey
      • Israel

By Technology Insights

The aqueous segment is estimated to witness significant growth during the forecast period.

The aqueous technology segment relies on advanced aqueous ink formulations to deliver exceptional color fidelity and minimal ecological impact. Businesses utilizing piezoelectric printheads experience precise droplet control, driving a 15% improvement in color accuracy for high-end applications.

This precision enables the efficient creation of indoor architectural graphics and vibrant point of purchase displays without emitting harmful chemicals. As environmental regulations tighten, companies shift toward water-based technologies, resulting in improved operator safety and compliance alignment.

The adoption of dye sublimation processes further expands capabilities, allowing for flexible output on specialized media.

Facilities leveraging these innovations report a 20% reduction in consumable waste during short run production, showcasing how targeted segmentation directly optimizes operational overhead and enhances overall visual output.

Get Free Sample

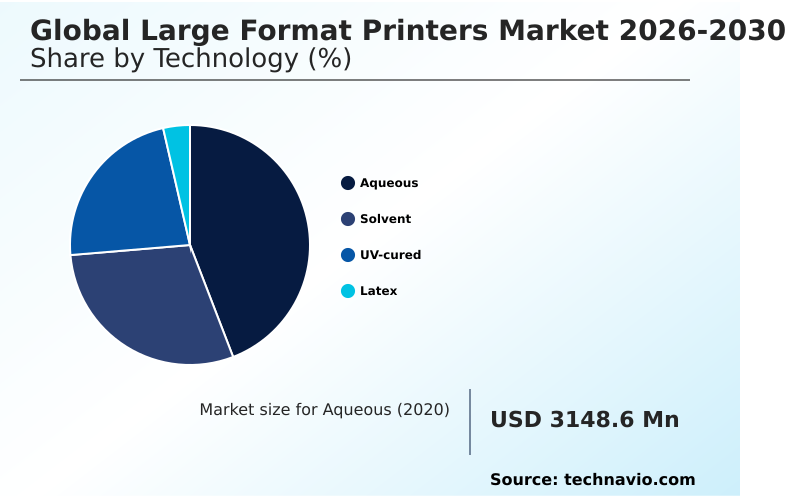
The Aqueous segment was valued at USD 3.47 billion in 2024 and showed a gradual increase during the forecast period.

Get Free Sample

Regional Analysis

APAC is estimated to contribute 47% to the growth of the global market during the forecast period.Technavio’s analysts have elaborately explained the regional trends and drivers that shape the market during the forecast period.

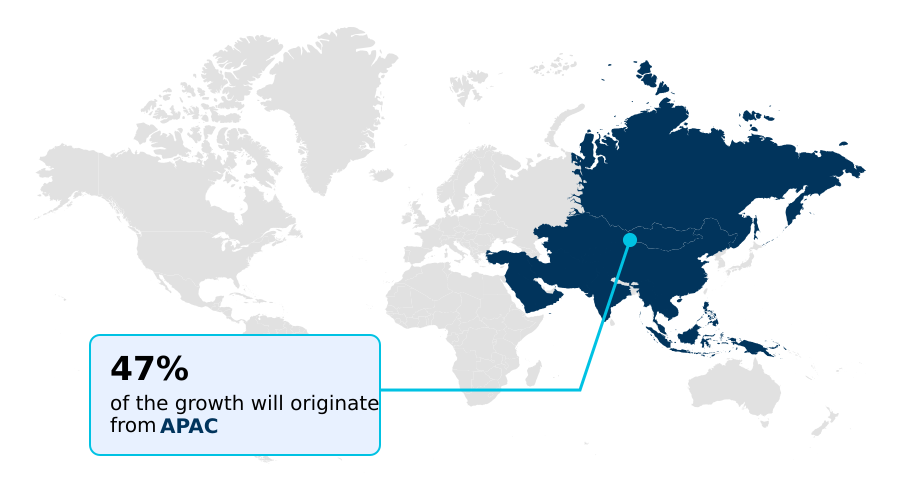
See How Large Format Printers Market Demand is Rising in APAC Get Free Sample

The Large Format Printers Market exhibits distinct operational dynamics across regional landscapes. North America demonstrates a rapid integration of flatbed printing systems, achieving a 20% higher operational efficiency in specialized packaging compared to the Europe sector.

This efficiency stems from a localized supply chain highly optimized for light emitting diode curing hardware, which reduces energy consumption by 15% per facility.

Conversely, Europe manufacturers prioritize stringent environmental compliance, driving a 30% faster adoption of eco-friendly electrostatic toner powder over traditional liquid chemicals.

The demand for durable vehicle wrap substrates and abrasion resistant coatings remains strong across both regions, though North America firms leverage automated workflows to decrease material waste by 18%.

Meanwhile, the APAC region accelerates its capacity for membrane switch printing in electronics manufacturing, securing a 25% cost reduction in component prototyping through localized material sourcing and advanced technical drafting capabilities.

Market Dynamics

Our researchers analyzed the data with 2025 as the base year, along with the key drivers, trends, and challenges. A holistic analysis of drivers will help companies refine their marketing strategies to gain a competitive advantage.

  • The operational ecosystem of the Large Format Printers Market is rapidly evolving to prioritize both high-fidelity output and ecological responsibility. Print service providers are increasingly abandoning legacy analog operations in favor of digitized, agile production lines.
  • A primary focus is aqueous ink color gamut optimization, which enables commercial producers to hit strict brand color targets with a 20% higher accuracy rate than previous-generation ink sets. This capability directly reduces costly reprint cycles in the advertising sector.
  • Simultaneously, ultraviolet led curing energy efficiency provides a critical advantage, allowing facilities to process heat-sensitive materials while consuming roughly 30% less power than traditional thermal drying units. This energy reduction significantly improves overall facility margins.
  • As regulatory pressures mount regarding chemical disposal, polyvinyl chloride free substrate adoption has accelerated, minimizing toxic waste streams and aligning corporate procurement with strict environmental, social, and governance standards. The textile sector heavily leverages direct to fabric dye sublimation to execute short-run apparel orders, cutting physical inventory requirements by a quarter and mitigating the financial risk of unsold seasonal stock.
  • To synchronize these diverse technologies, facilities implement automated print workflow software integration. This digital orchestration routes jobs seamlessly across multiple devices, cutting pre-press labor hours by 15% and ensuring that high-volume production schedules operate with maximum uptime and minimal human intervention.

What are the key market drivers leading to the rise in the adoption of Large Format Printers Industry?

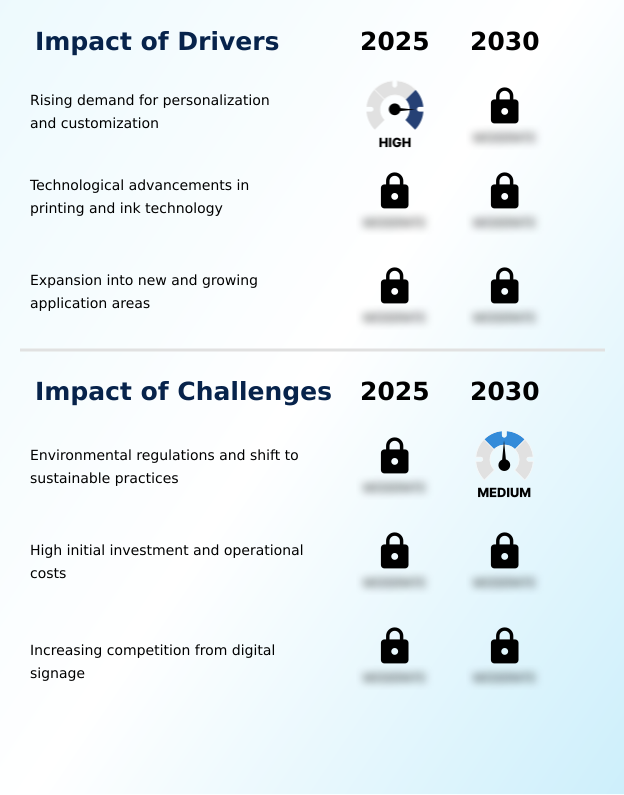
  • The rising demand for personalization and customization acts as a primary market catalyst, compelling businesses to adopt versatile digital printing technologies that efficiently produce unique, short-run graphics and tailored products.

  • The surging demand for extreme customization and immediate turnaround times acts as a primary catalyst for the Large Format Printers Market. Retail environments require dynamic visual merchandising, driving a 30% increase in the frequency of point of purchase displays updates.
  • This constant rotation necessitates agile short run production capabilities, reducing excess inventory costs by 25%. Innovations in ultraviolet light curing allow operators to immediately handle prints straight off the press, eliminating drying bottlenecks and accelerating dispatch schedules.
  • In industrial applications, the precise output required for membrane switch printing improves component reliability, dropping defect rates by 15%. Furthermore, architectural firms depend on high-fidelity blueprint technical drafting to maintain precise structural tolerances.
  • The integration of dye sublimation processes further empowers the apparel sector, eliminating water-intensive dyeing stages and enhancing localized supply chain resilience.

What are the market trends shaping the Large Format Printers Industry?

  • The accelerating shift toward sustainable printing represents a critical market evolution driven by stringent environmental mandates and corporate ecological goals. This transition mandates the adoption of eco-friendly consumables and energy-efficient hardware to minimize ecological footprints while maintaining high-quality output.

  • The transition toward sustainable and textile-centric output defines the latest innovation trajectory in the Large Format Printers Market. Regulatory crackdowns on volatile organic compounds force commercial producers to overhaul legacy ink systems, resulting in a 35% drop in hazardous atmospheric emissions within modern facilities.
  • This regulatory pressure accelerates the adoption of polyvinyl chloride free media, enabling brands to execute compliant marketing campaigns. Simultaneously, the retail sector pivots heavily toward direct to fabric printing to produce lightweight, foldable displays. By leveraging specialized soft signage fabrics and textile warp knitted fabrics, logistics teams achieve a 40% reduction in shipping weights compared to traditional rigid boards.
  • Additionally, the rapid execution of packaging prototype creation allows consumer goods companies to shorten design validation cycles by 20%, ensuring faster market entry and optimized material sourcing.

What challenges does the Large Format Printers Industry face during its growth?

  • Escalating environmental regulations and the mandatory shift toward sustainable practices present a significant challenge, forcing manufacturers to heavily invest in alternative substrates and low-emission ink technologies to ensure continuous compliance.

  • Stringent environmental mandates and extreme capital expenditure requirements present severe operational hurdles within the Large Format Printers Market. Transitioning to compliant aqueous ink formulations requires a complete recalibration of existing hardware, increasing initial setup costs by 22% for mid-sized print providers.
  • Delicate piezoelectric printheads demand meticulous, highly controlled maintenance routines; failure to optimize these components leads to a 15% increase in unexpected machine downtime. Furthermore, executing high-quality indoor architectural graphics on complex, heat sensitive materials restricts operating speeds, artificially capping daily facility throughput.
  • While applying abrasion resistant coatings ensures the longevity of demanding applications like vehicle wrap substrates, these specialized finishing layers elevate per-unit consumable expenses by 18%. Consequently, facilities struggle to balance the financial pressure of sustainable upgrades against the necessity of maintaining competitive, high-margin production capabilities.

Exclusive Technavio Analysis on Customer Landscape

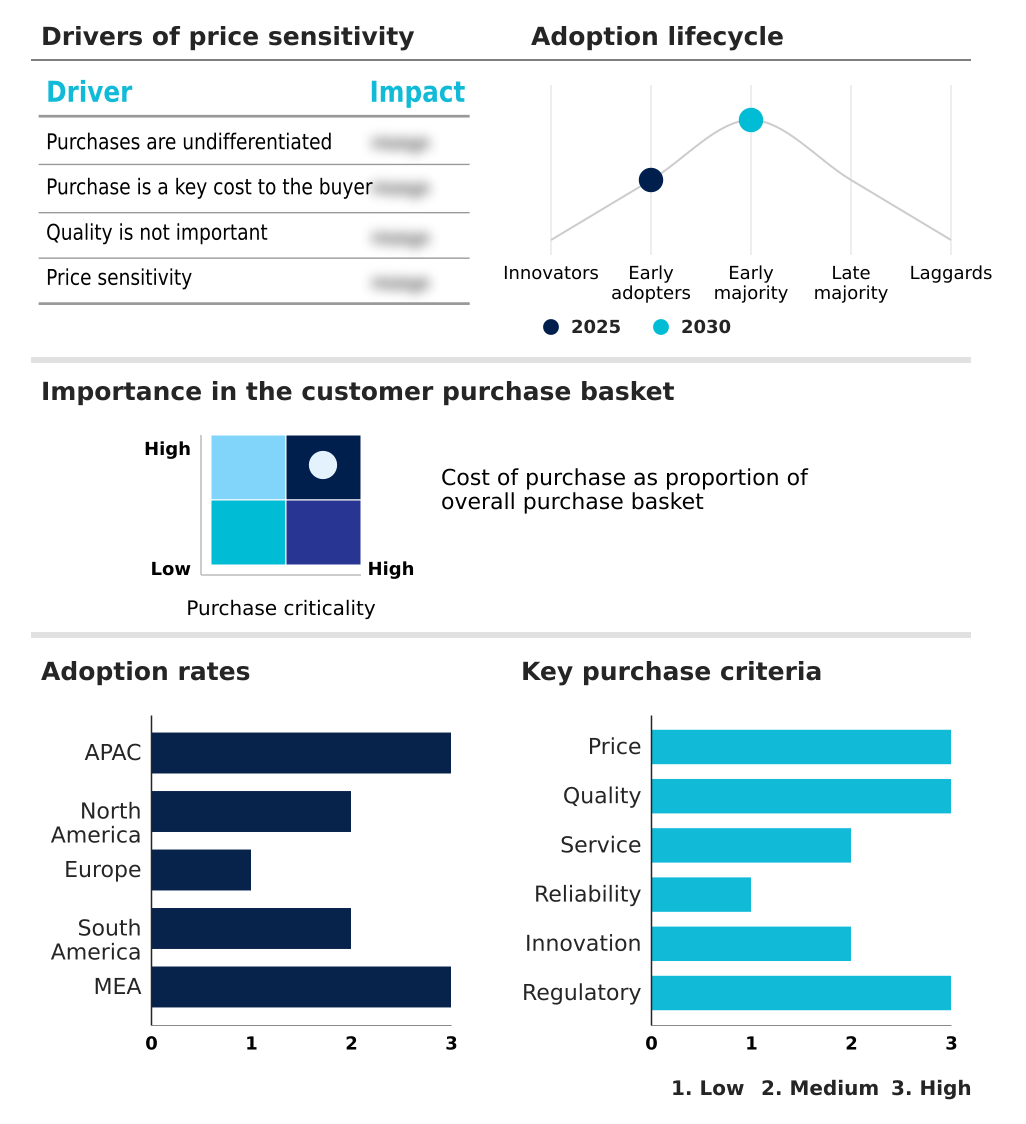
The large format printers market forecasting report includes the adoption lifecycle of the market, covering from the innovator’s stage to the laggard’s stage. It focuses on adoption rates in different regions based on penetration. Furthermore, the large format printers market report also includes key purchase criteria and drivers of price sensitivity to help companies evaluate and develop their market growth analysis strategies.

Customer Landscape of Large Format Printers Industry

Competitive Landscape

Companies are implementing various strategies, such as strategic alliances, large format printers market forecast, partnerships, mergers and acquisitions, geographical expansion, and product/service launches, to enhance their presence in the industry.

Agfa Gevaert NV - Providers supply advanced printing hardware, sustainable ink technologies, and integrated workflow software to optimize production speed and deliver high-resolution graphics across diverse industrial and commercial applications.

The industry research and growth report includes detailed analyses of the competitive landscape of the market and information about key companies, including:

  • Agfa Gevaert NV
  • Brother Industries Ltd.
  • Canon Inc.
  • Digital Graphics Inc
  • Durst Group AG
  • Electronics For Imaging Inc.
  • FUJIFILM Holdings Corp.
  • Gongzheng Group Co. Ltd.
  • HP Inc.
  • Konica Minolta Inc.
  • Kornit Digital Ltd.
  • Kyocera Corp.
  • Liyu International
  • Mimaki Engineering Co. Ltd.
  • Mutoh America Inc
  • Ricoh Co. Ltd.
  • Roland DG Corp.
  • Seiko Epson Corp.
  • swissQprint AG
  • Xerox Holdings Corp.

Qualitative and quantitative analysis of companies has been conducted to help clients understand the wider business environment as well as the strengths and weaknesses of key industry players. Data is qualitatively analyzed to categorize companies as pure play, category-focused, industry-focused, and diversified; it is quantitatively analyzed to categorize companies as dominant, leading, strong, tentative, and weak.

Recent Development and News in Large format printers market

  • In the Technology Hardware, Storage and Peripherals industry, the adoption of cloud-based management information systems enhanced factory interoperability, directly impacting global large format printers market 2026-2030 demand by improving enterprise resource planning integration and reducing job setup times by 15%.
  • The transition toward energy-efficient light emitting diode curing components in general manufacturing hardware lowered thermal output, allowing the global large format printers market 2026-2030 to safely process heat sensitive materials while cutting energy consumption by 20%.
  • Stricter environmental compliance mandates regarding volatile organic compounds forced peripheral manufacturers to develop alternative chemical handling processes, accelerating the global large format printers market 2026-2030 shift toward polyvinyl chloride free media and sustainable substrates.
  • Advancements in high-speed raster image processing chips optimized data throughput for heavy graphic workloads, enabling the global large format printers market 2026-2030 to integrate automated cutting workflows that increased overall production throughput by 25%.

Dive into Technavio’s robust research methodology, blending expert interviews, extensive data synthesis, and validated models for unparalleled Large Format Printers Market insights. See full methodology.

Market Scope
Page number 343
Base year 2025
Historic period 2020-2024
Forecast period 2026-2030
Growth momentum & CAGR Accelerate at a CAGR of 3%
Market growth 2026-2030 USD 1274.8 million
Market structure Fragmented
YoY growth 2025-2026(%) 2.9%
Key countries China, Japan, India, South Korea, Australia, Indonesia, US, Canada, Mexico, Germany, UK, France, Italy, Spain, The Netherlands, Brazil, Argentina, Chile, Saudi Arabia, UAE, South Africa, Turkey and Israel
Competitive landscape Leading Companies, Market Positioning of Companies, Competitive Strategies, and Industry Risks

Request Free Sample

Research Analyst Overview

  • Continuous technological refinement within the Large Format Printers Market significantly alters industrial and commercial production capabilities. Facilities utilizing advanced droplet size modulation achieve highly precise graphical outputs, directly supporting rigorous brand identity standards in competitive retail environments. The deployment of high-speed raster image processing accelerates data transfer from design software to physical hardware, reducing network bottlenecks.
  • Organizations upgrading their printhead firing frequency report a 25% decrease in overall job completion time, effectively expanding their daily production capacity without adding physical floor space. Strategic shifts toward sustainability are evident as businesses replace harsh chemicals with eco solvent solutions, aligning facility operations with strict occupational safety guidelines.
  • Furthermore, the integration of inline fixation units streamlines textile manufacturing by eliminating secondary heat-press steps, which optimizes facility footprints and lowers labor dependencies. Industrial sectors increasingly utilize specialized hardware for three dimensional object finishing, enabling the direct decoration of manufactured goods.
  • These systemic improvements empower commercial operators to optimize resource allocation, enhance product durability, and maintain strict compliance with evolving environmental mandates.

What are the Key Data Covered in this Large Format Printers Market Research and Growth Report?

  • What is the expected growth of the Large Format Printers Market between 2026 and 2030?

    • USD 1.27 billion, at a CAGR of 3%

  • What segmentation does the market report cover?

    • The report is segmented by Technology (Aqueous, Solvent, UV-cured, and Latex), Type (Ink-based, and Toner-based), Material (Paper, Vinyl, Fabric, and Others), Connectivity (Wired, and Wireless), Application (Apparel and textiles, Signage and advertising, Decor and interior design, CAD and technical printing, and Others) and Geography (APAC, North America, Europe, South America, Middle East and Africa)

  • Which regions are analyzed in the report?

    • APAC, North America, Europe, South America and Middle East and Africa

  • What are the key growth drivers and market challenges?

    • Rising demand for personalization and customization, Environmental regulations and shift to sustainable practices

  • Who are the major players in the Large Format Printers Market?

    • Agfa Gevaert NV, Brother Industries Ltd., Canon Inc., Digital Graphics Inc, Durst Group AG, Electronics For Imaging Inc., FUJIFILM Holdings Corp., Gongzheng Group Co. Ltd., HP Inc., Konica Minolta Inc., Kornit Digital Ltd., Kyocera Corp., Liyu International, Mimaki Engineering Co. Ltd., Mutoh America Inc, Ricoh Co. Ltd., Roland DG Corp., Seiko Epson Corp., swissQprint AG and Xerox Holdings Corp.

Market Research Insights

  • The Large Format Printers Market provides essential hardware infrastructure for dynamic visual production and industrial decoration. Facilities implementing advanced color profile management achieve a 15% reduction in ink waste, directly lowering operational overhead. The integration of web to print portals streamlines order ingestion, improving client turnaround times by 25% compared to manual processing workflows.
  • Furthermore, leveraging variable data personalization enables marketing agencies to deploy highly targeted campaigns, boosting customer engagement metrics by 18%. In engineering sectors, the deployment of precise hardware for blueprint technical drafting reduces rendering errors by 12%, ensuring architectural compliance and structural accuracy. These technological enhancements optimize resource allocation and drive measurable efficiency gains across diverse commercial printing environments.

We can help! Our analysts can customize this large format printers market research report to meet your requirements.

Get in touch

1. Executive Summary

1.1 Market overview

Executive Summary - Chart on Market Overview
Executive Summary - Data Table on Market Overview
Executive Summary - Chart on Global Market Characteristics
Executive Summary - Chart on Market by Geography
Executive Summary - Chart on Market Segmentation by Technology
Executive Summary - Chart on Market Segmentation by Type
Executive Summary - Chart on Market Segmentation by Material
Executive Summary - Chart on Market Segmentation by Connectivity
Executive Summary - Chart on Market Segmentation by Application
Executive Summary - Chart on Incremental Growth
Executive Summary - Data Table on Incremental Growth
Executive Summary - Chart on Company Market Positioning

2. Technavio Analysis

2.1 Analysis of price sensitivity, lifecycle, customer purchase basket, adoption rates, and purchase criteria

2.2 Criticality of inputs and Factors of differentiation

Chart on Overview on criticality of inputs and factors of differentiation

2.3 Factors of disruption

Chart on Overview on factors of disruption

2.4 Impact of drivers and challenges

Chart on Impact of drivers and challenges in 2025 and 2030

3. Market Landscape

3.1 Market ecosystem

Chart on Parent Market
Data Table on - Parent Market

3.2 Market characteristics

Chart on Market characteristics analysis

3.3 Value chain analysis

Chart on Value chain analysis

4. Market Sizing

4.1 Market definition

Data Table on Offerings of companies included in the market definition

4.2 Market segment analysis

Market segments

4.3 Market size 2025

4.4 Market outlook: Forecast for 2025-2030

Chart on Global - Market size and forecast 2025-2030 ($ million)
Data Table on Global - Market size and forecast 2025-2030 ($ million)
Chart on Global Market: Year-over-year growth 2025-2030 (%)
Data Table on Global Market: Year-over-year growth 2025-2030 (%)

5. Historic Market Size

5.1 Global Large Format Printers Market 2020 - 2024

Historic Market Size - Data Table on Global Large Format Printers Market 2020 - 2024 ($ million)

5.2 Technology segment analysis 2020 - 2024

Historic Market Size - Technology Segment 2020 - 2024 ($ million)

5.3 Type segment analysis 2020 - 2024

Historic Market Size - Type Segment 2020 - 2024 ($ million)

5.4 Material segment analysis 2020 - 2024

Historic Market Size - Material Segment 2020 - 2024 ($ million)

5.5 Connectivity segment analysis 2020 - 2024

Historic Market Size - Connectivity Segment 2020 - 2024 ($ million)

5.6 Application segment analysis 2020 - 2024

Historic Market Size - Application Segment 2020 - 2024 ($ million)

5.7 Geography segment analysis 2020 - 2024

Historic Market Size - Geography Segment 2020 - 2024 ($ million)

5.8 Country segment analysis 2020 - 2024

Historic Market Size - Country Segment 2020 - 2024 ($ million)

6. Qualitative Analysis

6.1 Impact of AI on Global Large Format Printers Market

6.2 Impact of Geopolitical Conflicts on Global Large Format Printers Market

7. Five Forces Analysis

7.1 Five forces summary

Five forces analysis - Comparison between 2025 and 2030

7.2 Bargaining power of buyers

Bargaining power of buyers - Impact of key factors 2025 and 2030

7.3 Bargaining power of suppliers

Bargaining power of suppliers - Impact of key factors in 2025 and 2030

7.4 Threat of new entrants

Threat of new entrants - Impact of key factors in 2025 and 2030

7.5 Threat of substitutes

Threat of substitutes - Impact of key factors in 2025 and 2030

7.6 Threat of rivalry

Threat of rivalry - Impact of key factors in 2025 and 2030

7.7 Market condition

Chart on Market condition - Five forces 2025 and 2030

8. Market Segmentation by Technology

8.1 Market segments

Chart on Technology - Market share 2025-2030 (%)
Data Table on Technology - Market share 2025-2030 (%)

8.2 Comparison by Technology

Chart on Comparison by Technology
Data Table on Comparison by Technology

8.3 Aqueous - Market size and forecast 2025-2030

Chart on Aqueous - Market size and forecast 2025-2030 ($ million)
Data Table on Aqueous - Market size and forecast 2025-2030 ($ million)
Chart on Aqueous - Year-over-year growth 2025-2030 (%)
Data Table on Aqueous - Year-over-year growth 2025-2030 (%)

8.4 Solvent - Market size and forecast 2025-2030

Chart on Solvent - Market size and forecast 2025-2030 ($ million)
Data Table on Solvent - Market size and forecast 2025-2030 ($ million)
Chart on Solvent - Year-over-year growth 2025-2030 (%)
Data Table on Solvent - Year-over-year growth 2025-2030 (%)

8.5 UV-cured - Market size and forecast 2025-2030

Chart on UV-cured - Market size and forecast 2025-2030 ($ million)
Data Table on UV-cured - Market size and forecast 2025-2030 ($ million)
Chart on UV-cured - Year-over-year growth 2025-2030 (%)
Data Table on UV-cured - Year-over-year growth 2025-2030 (%)

8.6 Latex - Market size and forecast 2025-2030

Chart on Latex - Market size and forecast 2025-2030 ($ million)
Data Table on Latex - Market size and forecast 2025-2030 ($ million)
Chart on Latex - Year-over-year growth 2025-2030 (%)
Data Table on Latex - Year-over-year growth 2025-2030 (%)

8.7 Market opportunity by Technology

Market opportunity by Technology ($ million)
Data Table on Market opportunity by Technology ($ million)

9. Market Segmentation by Type

9.1 Market segments

Chart on Type - Market share 2025-2030 (%)
Data Table on Type - Market share 2025-2030 (%)

9.2 Comparison by Type

Chart on Comparison by Type
Data Table on Comparison by Type

9.3 Ink-based - Market size and forecast 2025-2030

Chart on Ink-based - Market size and forecast 2025-2030 ($ million)
Data Table on Ink-based - Market size and forecast 2025-2030 ($ million)
Chart on Ink-based - Year-over-year growth 2025-2030 (%)
Data Table on Ink-based - Year-over-year growth 2025-2030 (%)

9.4 Toner-based - Market size and forecast 2025-2030

Chart on Toner-based - Market size and forecast 2025-2030 ($ million)
Data Table on Toner-based - Market size and forecast 2025-2030 ($ million)
Chart on Toner-based - Year-over-year growth 2025-2030 (%)
Data Table on Toner-based - Year-over-year growth 2025-2030 (%)

9.5 Market opportunity by Type

Market opportunity by Type ($ million)
Data Table on Market opportunity by Type ($ million)

10. Market Segmentation by Material

10.1 Market segments

Chart on Material - Market share 2025-2030 (%)
Data Table on Material - Market share 2025-2030 (%)

10.2 Comparison by Material

Chart on Comparison by Material
Data Table on Comparison by Material

10.3 Paper - Market size and forecast 2025-2030

Chart on Paper - Market size and forecast 2025-2030 ($ million)
Data Table on Paper - Market size and forecast 2025-2030 ($ million)
Chart on Paper - Year-over-year growth 2025-2030 (%)
Data Table on Paper - Year-over-year growth 2025-2030 (%)

10.4 Vinyl - Market size and forecast 2025-2030

Chart on Vinyl - Market size and forecast 2025-2030 ($ million)
Data Table on Vinyl - Market size and forecast 2025-2030 ($ million)
Chart on Vinyl - Year-over-year growth 2025-2030 (%)
Data Table on Vinyl - Year-over-year growth 2025-2030 (%)

10.5 Fabric - Market size and forecast 2025-2030

Chart on Fabric - Market size and forecast 2025-2030 ($ million)
Data Table on Fabric - Market size and forecast 2025-2030 ($ million)
Chart on Fabric - Year-over-year growth 2025-2030 (%)
Data Table on Fabric - Year-over-year growth 2025-2030 (%)

10.6 Others - Market size and forecast 2025-2030

Chart on Others - Market size and forecast 2025-2030 ($ million)
Data Table on Others - Market size and forecast 2025-2030 ($ million)
Chart on Others - Year-over-year growth 2025-2030 (%)
Data Table on Others - Year-over-year growth 2025-2030 (%)

10.7 Market opportunity by Material

Market opportunity by Material ($ million)
Data Table on Market opportunity by Material ($ million)

11. Market Segmentation by Connectivity

11.1 Market segments

Chart on Connectivity - Market share 2025-2030 (%)
Data Table on Connectivity - Market share 2025-2030 (%)

11.2 Comparison by Connectivity

Chart on Comparison by Connectivity
Data Table on Comparison by Connectivity

11.3 Wired - Market size and forecast 2025-2030

Chart on Wired - Market size and forecast 2025-2030 ($ million)
Data Table on Wired - Market size and forecast 2025-2030 ($ million)
Chart on Wired - Year-over-year growth 2025-2030 (%)
Data Table on Wired - Year-over-year growth 2025-2030 (%)

11.4 Wireless - Market size and forecast 2025-2030

Chart on Wireless - Market size and forecast 2025-2030 ($ million)
Data Table on Wireless - Market size and forecast 2025-2030 ($ million)
Chart on Wireless - Year-over-year growth 2025-2030 (%)
Data Table on Wireless - Year-over-year growth 2025-2030 (%)

11.5 Market opportunity by Connectivity

Market opportunity by Connectivity ($ million)
Data Table on Market opportunity by Connectivity ($ million)

12. Market Segmentation by Application

12.1 Market segments

Chart on Application - Market share 2025-2030 (%)
Data Table on Application - Market share 2025-2030 (%)

12.2 Comparison by Application

Chart on Comparison by Application
Data Table on Comparison by Application

12.3 Apparel and textiles - Market size and forecast 2025-2030

Chart on Apparel and textiles - Market size and forecast 2025-2030 ($ million)
Data Table on Apparel and textiles - Market size and forecast 2025-2030 ($ million)
Chart on Apparel and textiles - Year-over-year growth 2025-2030 (%)
Data Table on Apparel and textiles - Year-over-year growth 2025-2030 (%)

12.4 Signage and advertising - Market size and forecast 2025-2030

Chart on Signage and advertising - Market size and forecast 2025-2030 ($ million)
Data Table on Signage and advertising - Market size and forecast 2025-2030 ($ million)
Chart on Signage and advertising - Year-over-year growth 2025-2030 (%)
Data Table on Signage and advertising - Year-over-year growth 2025-2030 (%)

12.5 Decor and interior design - Market size and forecast 2025-2030

Chart on Decor and interior design - Market size and forecast 2025-2030 ($ million)
Data Table on Decor and interior design - Market size and forecast 2025-2030 ($ million)
Chart on Decor and interior design - Year-over-year growth 2025-2030 (%)
Data Table on Decor and interior design - Year-over-year growth 2025-2030 (%)

12.6 CAD and technical printing - Market size and forecast 2025-2030

Chart on CAD and technical printing - Market size and forecast 2025-2030 ($ million)
Data Table on CAD and technical printing - Market size and forecast 2025-2030 ($ million)
Chart on CAD and technical printing - Year-over-year growth 2025-2030 (%)
Data Table on CAD and technical printing - Year-over-year growth 2025-2030 (%)

12.7 Others - Market size and forecast 2025-2030

Chart on Others - Market size and forecast 2025-2030 ($ million)
Data Table on Others - Market size and forecast 2025-2030 ($ million)
Chart on Others - Year-over-year growth 2025-2030 (%)
Data Table on Others - Year-over-year growth 2025-2030 (%)

12.8 Market opportunity by Application

Market opportunity by Application ($ million)
Data Table on Market opportunity by Application ($ million)

13. Customer Landscape

13.1 Customer landscape overview

Analysis of price sensitivity, lifecycle, customer purchase basket, adoption rates, and purchase criteria

14. Geographic Landscape

14.1 Geographic segmentation

Chart on Market share by geography 2025-2030 (%)
Data Table on Market share by geography 2025-2030 (%)

14.2 Geographic comparison

Chart on Geographic comparison
Data Table on Geographic comparison

14.3 APAC - Market size and forecast 2025-2030

Chart on APAC - Market size and forecast 2025-2030 ($ million)
Data Table on APAC - Market size and forecast 2025-2030 ($ million)
Chart on APAC - Year-over-year growth 2025-2030 (%)
Data Table on APAC - Year-over-year growth 2025-2030 (%)
Chart on Regional Comparison - APAC
Data Table on Regional Comparison - APAC

14.3.1 China - Market size and forecast 2025-2030

Chart on China - Market size and forecast 2025-2030 ($ million)
Data Table on China - Market size and forecast 2025-2030 ($ million)
Chart on China - Year-over-year growth 2025-2030 (%)
Data Table on China - Year-over-year growth 2025-2030 (%)

14.3.2 Japan - Market size and forecast 2025-2030

Chart on Japan - Market size and forecast 2025-2030 ($ million)
Data Table on Japan - Market size and forecast 2025-2030 ($ million)
Chart on Japan - Year-over-year growth 2025-2030 (%)
Data Table on Japan - Year-over-year growth 2025-2030 (%)

14.3.3 India - Market size and forecast 2025-2030

Chart on India - Market size and forecast 2025-2030 ($ million)
Data Table on India - Market size and forecast 2025-2030 ($ million)
Chart on India - Year-over-year growth 2025-2030 (%)
Data Table on India - Year-over-year growth 2025-2030 (%)

14.3.4 South Korea - Market size and forecast 2025-2030

Chart on South Korea - Market size and forecast 2025-2030 ($ million)
Data Table on South Korea - Market size and forecast 2025-2030 ($ million)
Chart on South Korea - Year-over-year growth 2025-2030 (%)
Data Table on South Korea - Year-over-year growth 2025-2030 (%)

14.3.5 Australia - Market size and forecast 2025-2030

Chart on Australia - Market size and forecast 2025-2030 ($ million)
Data Table on Australia - Market size and forecast 2025-2030 ($ million)
Chart on Australia - Year-over-year growth 2025-2030 (%)
Data Table on Australia - Year-over-year growth 2025-2030 (%)

14.3.6 Indonesia - Market size and forecast 2025-2030

Chart on Indonesia - Market size and forecast 2025-2030 ($ million)
Data Table on Indonesia - Market size and forecast 2025-2030 ($ million)
Chart on Indonesia - Year-over-year growth 2025-2030 (%)
Data Table on Indonesia - Year-over-year growth 2025-2030 (%)

14.4 North America - Market size and forecast 2025-2030

Chart on North America - Market size and forecast 2025-2030 ($ million)
Data Table on North America - Market size and forecast 2025-2030 ($ million)
Chart on North America - Year-over-year growth 2025-2030 (%)
Data Table on North America - Year-over-year growth 2025-2030 (%)
Chart on Regional Comparison - North America
Data Table on Regional Comparison - North America

14.4.1 US - Market size and forecast 2025-2030

Chart on US - Market size and forecast 2025-2030 ($ million)
Data Table on US - Market size and forecast 2025-2030 ($ million)
Chart on US - Year-over-year growth 2025-2030 (%)
Data Table on US - Year-over-year growth 2025-2030 (%)

14.4.2 Canada - Market size and forecast 2025-2030

Chart on Canada - Market size and forecast 2025-2030 ($ million)
Data Table on Canada - Market size and forecast 2025-2030 ($ million)
Chart on Canada - Year-over-year growth 2025-2030 (%)
Data Table on Canada - Year-over-year growth 2025-2030 (%)

14.4.3 Mexico - Market size and forecast 2025-2030

Chart on Mexico - Market size and forecast 2025-2030 ($ million)
Data Table on Mexico - Market size and forecast 2025-2030 ($ million)
Chart on Mexico - Year-over-year growth 2025-2030 (%)
Data Table on Mexico - Year-over-year growth 2025-2030 (%)

14.5 Europe - Market size and forecast 2025-2030

Chart on Europe - Market size and forecast 2025-2030 ($ million)
Data Table on Europe - Market size and forecast 2025-2030 ($ million)
Chart on Europe - Year-over-year growth 2025-2030 (%)
Data Table on Europe - Year-over-year growth 2025-2030 (%)
Chart on Regional Comparison - Europe
Data Table on Regional Comparison - Europe

14.5.1 Germany - Market size and forecast 2025-2030

Chart on Germany - Market size and forecast 2025-2030 ($ million)
Data Table on Germany - Market size and forecast 2025-2030 ($ million)
Chart on Germany - Year-over-year growth 2025-2030 (%)
Data Table on Germany - Year-over-year growth 2025-2030 (%)

14.5.2 UK - Market size and forecast 2025-2030

Chart on UK - Market size and forecast 2025-2030 ($ million)
Data Table on UK - Market size and forecast 2025-2030 ($ million)
Chart on UK - Year-over-year growth 2025-2030 (%)
Data Table on UK - Year-over-year growth 2025-2030 (%)

14.5.3 France - Market size and forecast 2025-2030

Chart on France - Market size and forecast 2025-2030 ($ million)
Data Table on France - Market size and forecast 2025-2030 ($ million)
Chart on France - Year-over-year growth 2025-2030 (%)
Data Table on France - Year-over-year growth 2025-2030 (%)

14.5.4 Italy - Market size and forecast 2025-2030

Chart on Italy - Market size and forecast 2025-2030 ($ million)
Data Table on Italy - Market size and forecast 2025-2030 ($ million)
Chart on Italy - Year-over-year growth 2025-2030 (%)
Data Table on Italy - Year-over-year growth 2025-2030 (%)

14.5.5 Spain - Market size and forecast 2025-2030

Chart on Spain - Market size and forecast 2025-2030 ($ million)
Data Table on Spain - Market size and forecast 2025-2030 ($ million)
Chart on Spain - Year-over-year growth 2025-2030 (%)
Data Table on Spain - Year-over-year growth 2025-2030 (%)

14.5.6 The Netherlands - Market size and forecast 2025-2030

Chart on The Netherlands - Market size and forecast 2025-2030 ($ million)
Data Table on The Netherlands - Market size and forecast 2025-2030 ($ million)
Chart on The Netherlands - Year-over-year growth 2025-2030 (%)
Data Table on The Netherlands - Year-over-year growth 2025-2030 (%)

14.6 South America - Market size and forecast 2025-2030

Chart on South America - Market size and forecast 2025-2030 ($ million)
Data Table on South America - Market size and forecast 2025-2030 ($ million)
Chart on South America - Year-over-year growth 2025-2030 (%)
Data Table on South America - Year-over-year growth 2025-2030 (%)
Chart on Regional Comparison - South America
Data Table on Regional Comparison - South America

14.6.1 Brazil - Market size and forecast 2025-2030

Chart on Brazil - Market size and forecast 2025-2030 ($ million)
Data Table on Brazil - Market size and forecast 2025-2030 ($ million)
Chart on Brazil - Year-over-year growth 2025-2030 (%)
Data Table on Brazil - Year-over-year growth 2025-2030 (%)

14.6.2 Argentina - Market size and forecast 2025-2030

Chart on Argentina - Market size and forecast 2025-2030 ($ million)
Data Table on Argentina - Market size and forecast 2025-2030 ($ million)
Chart on Argentina - Year-over-year growth 2025-2030 (%)
Data Table on Argentina - Year-over-year growth 2025-2030 (%)

14.6.3 Chile - Market size and forecast 2025-2030

Chart on Chile - Market size and forecast 2025-2030 ($ million)
Data Table on Chile - Market size and forecast 2025-2030 ($ million)
Chart on Chile - Year-over-year growth 2025-2030 (%)
Data Table on Chile - Year-over-year growth 2025-2030 (%)

14.7 Middle East and Africa - Market size and forecast 2025-2030

Chart on Middle East and Africa - Market size and forecast 2025-2030 ($ million)
Data Table on Middle East and Africa - Market size and forecast 2025-2030 ($ million)
Chart on Middle East and Africa - Year-over-year growth 2025-2030 (%)
Data Table on Middle East and Africa - Year-over-year growth 2025-2030 (%)
Chart on Regional Comparison - Middle East and Africa
Data Table on Regional Comparison - Middle East and Africa

14.7.1 Saudi Arabia - Market size and forecast 2025-2030

Chart on Saudi Arabia - Market size and forecast 2025-2030 ($ million)
Data Table on Saudi Arabia - Market size and forecast 2025-2030 ($ million)
Chart on Saudi Arabia - Year-over-year growth 2025-2030 (%)
Data Table on Saudi Arabia - Year-over-year growth 2025-2030 (%)

14.7.2 UAE - Market size and forecast 2025-2030

Chart on UAE - Market size and forecast 2025-2030 ($ million)
Data Table on UAE - Market size and forecast 2025-2030 ($ million)
Chart on UAE - Year-over-year growth 2025-2030 (%)
Data Table on UAE - Year-over-year growth 2025-2030 (%)

14.7.3 South Africa - Market size and forecast 2025-2030

Chart on South Africa - Market size and forecast 2025-2030 ($ million)
Data Table on South Africa - Market size and forecast 2025-2030 ($ million)
Chart on South Africa - Year-over-year growth 2025-2030 (%)
Data Table on South Africa - Year-over-year growth 2025-2030 (%)

14.7.4 Turkey - Market size and forecast 2025-2030

Chart on Turkey - Market size and forecast 2025-2030 ($ million)
Data Table on Turkey - Market size and forecast 2025-2030 ($ million)
Chart on Turkey - Year-over-year growth 2025-2030 (%)
Data Table on Turkey - Year-over-year growth 2025-2030 (%)

14.7.5 Israel - Market size and forecast 2025-2030

Chart on Israel - Market size and forecast 2025-2030 ($ million)
Data Table on Israel - Market size and forecast 2025-2030 ($ million)
Chart on Israel - Year-over-year growth 2025-2030 (%)
Data Table on Israel - Year-over-year growth 2025-2030 (%)

14.8 Market opportunity by geography

Market opportunity by geography ($ million)
Data Tables on Market opportunity by geography ($ million)

15. Drivers, Challenges, and Opportunity

15.1 Market drivers

Rising demand for personalization and customization
Technological advancements in printing and ink technology
Expansion into new and growing application areas

15.2 Market challenges

Environmental regulations and shift to sustainable practices
High initial investment and operational costs
Increasing competition from digital signage

15.3 Impact of drivers and challenges

Impact of drivers and challenges in 2025 and 2030

15.4 Market opportunities

Accelerating shift toward sustainable printing
Integration of workflow automation and software ecosystems
Rise of industrial and direct-to-object printing applications

16. Competitive Landscape

16.1 Overview

16.2

Overview on criticality of inputs and factors of differentiation

16.3 Landscape disruption

Overview on factors of disruption

16.4 Industry risks

Impact of key risks on business

17. Competitive Analysis

17.1 Companies profiled

Companies covered

17.2 Company ranking index

17.3 Market positioning of companies

Matrix on companies position and classification

17.4 Agfa Gevaert NV

Agfa Gevaert NV - Overview
Agfa Gevaert NV - Business segments
Agfa Gevaert NV - Key offerings
Agfa Gevaert NV - Segment focus
SWOT

17.5 Brother Industries Ltd.

Brother Industries Ltd. - Overview
Brother Industries Ltd. - Business segments
Brother Industries Ltd. - Key offerings
Brother Industries Ltd. - Segment focus
SWOT

17.6 Canon Inc.

Canon Inc. - Overview
Canon Inc. - Business segments
Canon Inc. - Key offerings
Canon Inc. - Segment focus
SWOT

17.7 Durst Group AG

Durst Group AG - Overview
Durst Group AG - Product / Service
Durst Group AG - Key offerings
SWOT

17.8 Electronics For Imaging Inc.

Electronics For Imaging Inc. - Overview
Electronics For Imaging Inc. - Product / Service
Electronics For Imaging Inc. - Key offerings
SWOT

17.9 FUJIFILM Holdings Corp.

FUJIFILM Holdings Corp. - Overview
FUJIFILM Holdings Corp. - Business segments
FUJIFILM Holdings Corp. - Key news
FUJIFILM Holdings Corp. - Key offerings
FUJIFILM Holdings Corp. - Segment focus
SWOT

17.10 HP Inc.

HP Inc. - Overview
HP Inc. - Business segments
HP Inc. - Key news
HP Inc. - Key offerings
HP Inc. - Segment focus
SWOT

17.11 Konica Minolta Inc.

Konica Minolta Inc. - Overview
Konica Minolta Inc. - Business segments
Konica Minolta Inc. - Key offerings
Konica Minolta Inc. - Segment focus
SWOT

17.12 Kornit Digital Ltd.

Kornit Digital Ltd. - Overview
Kornit Digital Ltd. - Product / Service
Kornit Digital Ltd. - Key offerings
SWOT

17.13 Kyocera Corp.

Kyocera Corp. - Overview
Kyocera Corp. - Business segments
Kyocera Corp. - Key offerings
Kyocera Corp. - Segment focus
SWOT

17.14 Mimaki Engineering Co. Ltd.

Mimaki Engineering Co. Ltd. - Overview
Mimaki Engineering Co. Ltd. - Product / Service
Mimaki Engineering Co. Ltd. - Key offerings
SWOT

17.15 Ricoh Co. Ltd.

Ricoh Co. Ltd. - Overview
Ricoh Co. Ltd. - Business segments
Ricoh Co. Ltd. - Key offerings
Ricoh Co. Ltd. - Segment focus
SWOT

17.16 Roland DG Corp.

Roland DG Corp. - Overview
Roland DG Corp. - Product / Service
Roland DG Corp. - Key offerings
SWOT

17.17 Seiko Epson Corp.

Seiko Epson Corp. - Overview
Seiko Epson Corp. - Business segments
Seiko Epson Corp. - Key offerings
Seiko Epson Corp. - Segment focus
SWOT

17.18 Xerox Holdings Corp.

Xerox Holdings Corp. - Overview
Xerox Holdings Corp. - Business segments
Xerox Holdings Corp. - Key offerings
Xerox Holdings Corp. - Segment focus
SWOT

18. Appendix

18.1 Scope of the report

Market definition
Objectives
Notes and caveats

18.2 Inclusions and exclusions checklist

Inclusions checklist
Exclusions checklist

18.3 Currency conversion rates for US$

18.4 Research methodology

18.5 Data procurement

Information sources

18.6 Data validation

18.7 Validation techniques employed for market sizing

18.8 Data synthesis

18.9 360 degree market analysis

18.10 List of abbreviations

Research Methodology

Technavio presents a detailed picture of the market by way of study, synthesis, and summation of data from multiple sources. The analysts have presented the various facets of the market with a particular focus on identifying the key industry influencers. The data thus presented is comprehensive, reliable, and the result of extensive research, both primary and secondary.

INFORMATION SOURCES

Primary sources

  • Manufacturers and suppliers
  • Channel partners
  • Industry experts
  • Strategic decision makers

Secondary sources

  • Industry journals and periodicals
  • Government data
  • Financial reports of key industry players
  • Historical data
  • Press releases

DATA ANALYSIS

Data Synthesis

  • Collation of data
  • Estimation of key figures
  • Analysis of derived insights

Data Validation

  • Triangulation with data models
  • Reference against proprietary databases
  • Corroboration with industry experts

REPORT WRITING

Qualitative

  • Market drivers
  • Market challenges
  • Market trends
  • Five forces analysis

Quantitative

  • Market size and forecast
  • Market segmentation
  • Geographical insights
  • Competitive landscape

Interested in this report?

Get your sample now to see our research methodology and insights!

Download Now

Frequently Asked Questions

Large Format Printers market growth will increase by USD 1274.8 million during 2026-2030.

The Large Format Printers market is expected to grow at a CAGR of 3% during 2026-2030.

Large Format Printers market is segmented by Technology (Aqueous, Solvent, UV-cured, Latex) Type (Ink-based, Toner-based) Material (Paper, Vinyl, Fabric, Others) Connectivity (Wired, Wireless) Application (Apparel and textiles, Signage and advertising, Decor and interior design, CAD and technical printing, Others)

Agfa Gevaert NV, Brother Industries Ltd., Canon Inc., Digital Graphics Inc, Durst Group AG, Electronics For Imaging Inc., FUJIFILM Holdings Corp., Gongzheng Group Co. Ltd., HP Inc., Konica Minolta Inc., Kornit Digital Ltd., Kyocera Corp., Liyu International, Mimaki Engineering Co. Ltd., Mutoh America Inc, Ricoh Co. Ltd., Roland DG Corp., Seiko Epson Corp., swissQprint AG, Xerox Holdings Corp. are a few of the key vendors in the Large Format Printers market.

APAC will register the highest growth rate of 47% among the other regions. Therefore, the Large Format Printers market in APAC is expected to garner significant business opportunities for the vendors during the forecast period.

China, Japan, India, South Korea, Australia, Indonesia, US, Canada, Mexico, Germany, UK, France, Italy, Spain, The Netherlands, Brazil, Argentina, Chile, Saudi Arabia, UAE, South Africa, Turkey, Israel

  • Rising demand for personalization and customization is the driving factor this market.

The Large Format Printers market vendors should focus on grabbing business opportunities from the Technology segment as it accounted for the largest market share in the base year.
RIA - Research AI Assistant
Ask RIA