Digital Printing For Packaging Market Analysis, Size, and Forecast 2026-2030: APAC (China, Japan, and India), North America (US, Canada, and Mexico), Europe (Germany, UK, and France), South America (Brazil, Argentina, and Colombia), Middle East and Africa (South Africa, Saudi Arabia, and UAE), and Rest of World (ROW)

Digital Printing For Packaging Market Analysis, Size, and Forecast 2026-2030:
APAC (China, Japan, and India), North America (US, Canada, and Mexico), Europe (Germany, UK, and France), South America (Brazil, Argentina, and Colombia), Middle East and Africa (South Africa, Saudi Arabia, and UAE), and Rest of World (ROW)

Published: Apr 2026 307 Pages SKU: IRTNTR76286

Market Overview at a Glance

$17.90 B
Market Opportunity
10.1%
CAGR 2025 - 2030
36.4%
APAC Growth
$15.40 B
Inkjet printing segment 2024

Digital Printing For Packaging Market Size 2026-2030

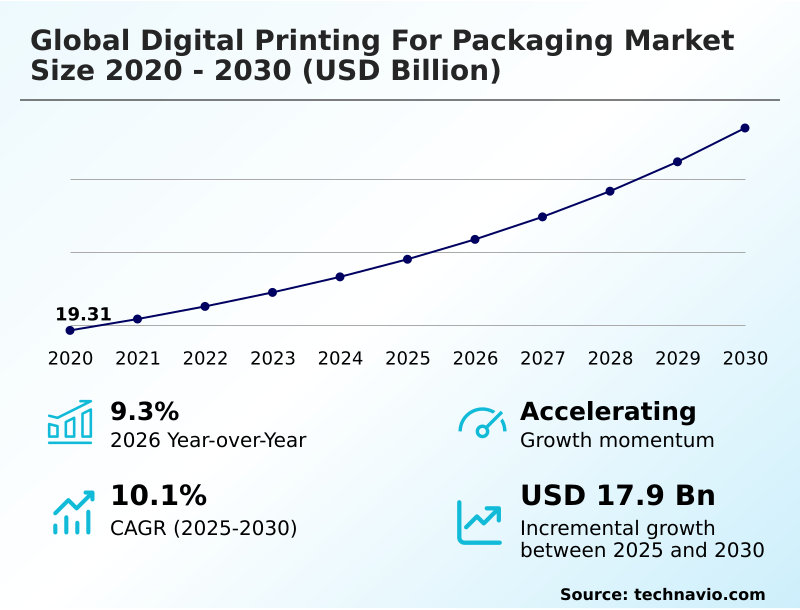
The digital printing for packaging market size is valued to increase by USD 17.90 billion, at a CAGR of 10.1% from 2025 to 2030. Escalating demand for hyper-personalization and scalable mass customization will drive the digital printing for packaging market.

Major Market Trends & Insights

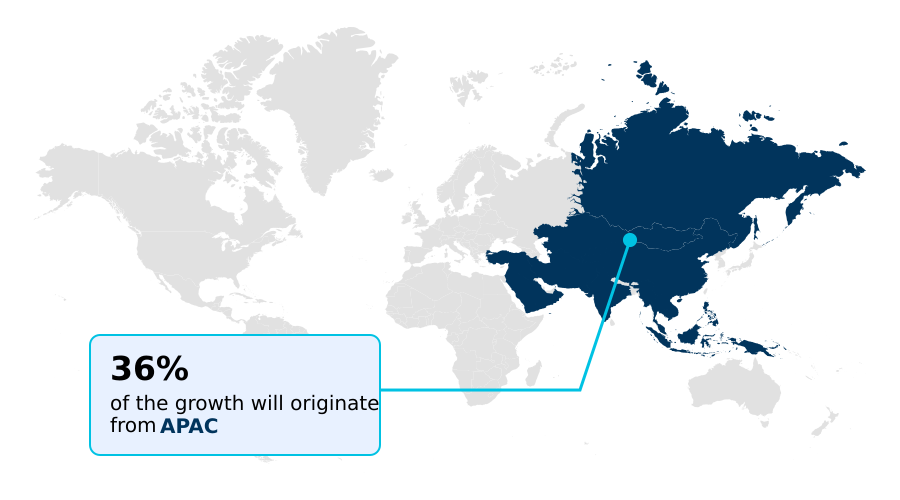
  • APAC dominated the market and accounted for a 36.4% growth during the forecast period.
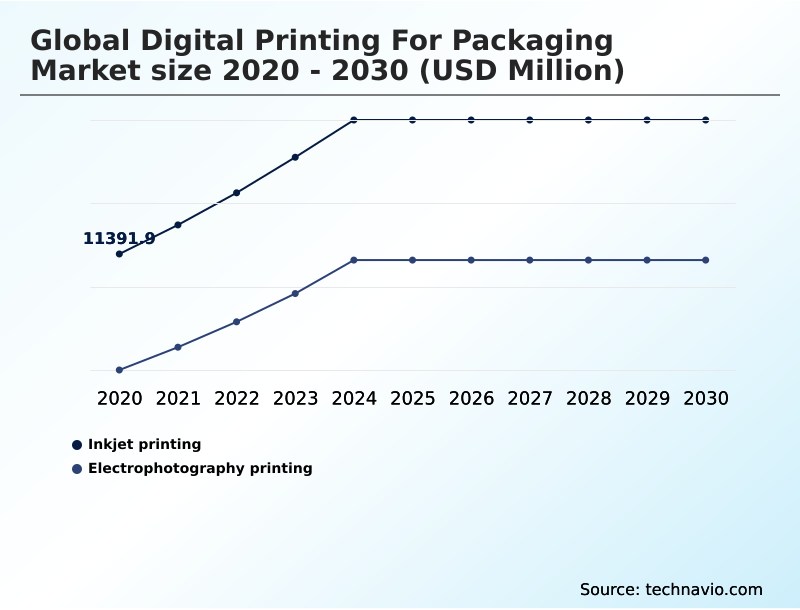
  • By Technology - Inkjet printing segment was valued at USD 15.40 billion in 2024
  • By Type - Labels segment accounted for the largest market revenue share in 2024

Market Size & Forecast

  • Market Opportunities: USD 27.60 billion
  • Market Future Opportunities: USD 17.90 billion
  • CAGR from 2025 to 2030 : 10.1%

Market Summary

  • The digital printing for packaging market is undergoing a significant transformation, driven by the need for greater supply chain agility and brand differentiation. Technologies such as high-speed inkjet and electrophotography are enabling on-demand production, which drastically reduces waste and inventory costs associated with traditional analog methods.
  • This shift supports the growing demand for personalized and promotional packaging, especially within the e-commerce and fast-moving consumer goods sectors. For example, a beverage company can now execute a regional marketing campaign by printing unique codes on millions of labels, each linking to a different digital experience, without the massive overhead of plate changes.
  • This capability facilitates just-in-time manufacturing and allows for rapid prototyping of new designs. However, challenges in achieving consistent color across diverse mono-material substrates and the high initial capital investment for digital press technology remain key considerations for converters.
  • The integration of color management software and prepress automation is becoming critical to overcoming these hurdles and unlocking the full potential of digital workflows.

What will be the Size of the Digital Printing For Packaging Market during the forecast period?

Get Key Insights on Market Forecast (PDF) Request Free Sample

How is the Digital Printing For Packaging Market Segmented?

The digital printing for packaging industry research report provides comprehensive data (region-wise segment analysis), with forecasts and estimates in "USD million" for the period 2026-2030, as well as historical data from 2020-2024 for the following segments.

  • Technology
    • Inkjet printing
    • Electrophotography printing
  • Type
    • Labels
    • Flexible packaging
    • Corrugated and folding cartons
    • Others
  • End-user
    • Food and beverages
    • Pharmaceutical
    • Personal care and cosmetics
    • Retail
    • Others
  • Geography
    • APAC
      • China
      • Japan
      • India
    • North America
      • US
      • Canada
      • Mexico
    • Europe
      • Germany
      • UK
      • France
    • South America
      • Brazil
      • Argentina
      • Colombia
    • Middle East and Africa
      • South Africa
      • Saudi Arabia
      • UAE
    • Rest of World (ROW)

By Technology Insights

The inkjet printing segment is estimated to witness significant growth during the forecast period.

Inkjet printing, a cornerstone of the digital printing for packaging market, is evolving through advancements in high-speed inkjet systems that enhance printhead longevity.

This non-contact technology is defined by superior nozzle density and drop placement accuracy, which are critical for achieving high-resolution graphics on diverse materials.

Innovations in pigment ink formulations have expanded its applicability, with automated color management ensuring brand integrity across production runs. For industrial applications, integrating these systems has led to a 15% increase in operational throughput.

The adaptability of small-batch production and rapid prototyping for packaging makes inkjet the preferred choice for sectors demanding both speed and premium branding without the constraints of traditional methods, supporting automated workflow integration and data-driven packaging.

Request Free Sample

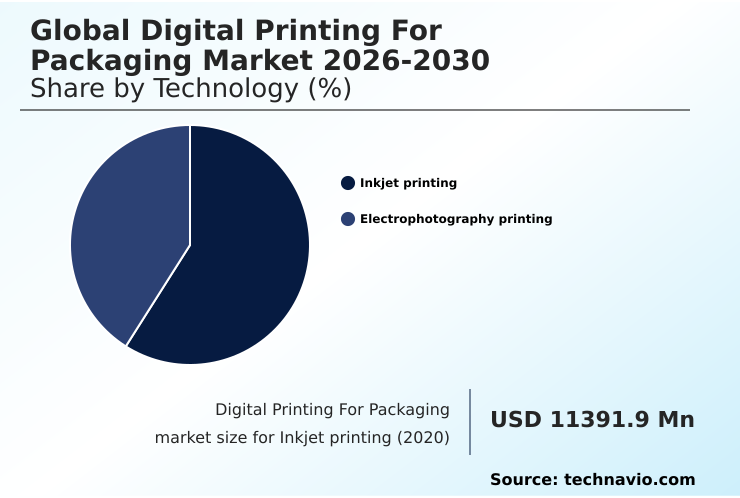
The Inkjet printing segment was valued at USD 15.40 billion in 2024 and showed a gradual increase during the forecast period.

Request Free Sample

Regional Analysis

APAC is estimated to contribute 36.4% to the growth of the global market during the forecast period.Technavio’s analysts have elaborately explained the regional trends and drivers that shape the market during the forecast period.

See How Digital Printing For Packaging Market Demand is Rising in APAC Request Free Sample

The geographic landscape is increasingly influenced by regional e-commerce growth, particularly in APAC and North America, demanding sophisticated packaging solutions.

The adoption of liquid electrophotography and toner-based systems is critical for achieving the premium branding required in the luxury goods packaging and craft beverage labels markets.

In Europe, strict eco-labeling standards and regulatory compliance labeling are driving the use of narrow-web printing for artisanal product packaging. These regulations have spurred innovations that offer a 20% reduction in material waste.

Furthermore, direct-to-shape printing and digital embossing capabilities are enabling brand protection features and anti-counterfeiting solutions, which are vital for pharmaceutical and high-value goods. Integration of serialized security labels has improved supply chain traceability by over 95% in regulated industries.

Market Dynamics

Our researchers analyzed the data with 2025 as the base year, along with the key drivers, trends, and challenges. A holistic analysis of drivers will help companies refine their marketing strategies to gain a competitive advantage.

  • Strategic decision-making in the digital printing for packaging market increasingly revolves around a careful analysis of the cost of digital vs. analog printing, with many firms discovering that the benefits of variable data printing for targeted marketing campaigns outweigh the higher per-unit cost on long runs.
  • The conversation is shifting toward the long-term ROI on industrial digital presses, which is heavily influenced by factors like integrating digital printing into existing workflows and the efficiency gained from automating prepress for digital packaging.
  • Key applications showcase this evolution; for example, implementing serialization in pharmaceutical packaging is no longer optional, and high-speed inkjet for corrugated board is essential for optimizing the unboxing experience with digital print for direct-to-consumer brands. In parallel, the development of sustainable digital printing ink formulations is addressing digital printing for food packaging safety.
  • Converters are focused on improving color consistency across substrates, particularly when tackling the challenges of digital printing on metallic foils. For flexible packaging, the debate between UV-curable vs. water-based inkjet inks continues, while digital printing for short-run flexible packaging becomes standard.
  • Furthermore, right-size packaging automation with digital printing is reducing waste with on-demand packaging, and digital printing for personalized cosmetic boxes now incorporates advanced security features in digital packaging printing, a value-add that shows a higher return on investment compared to traditional decoration methods.

What are the key market drivers leading to the rise in the adoption of Digital Printing For Packaging Industry?

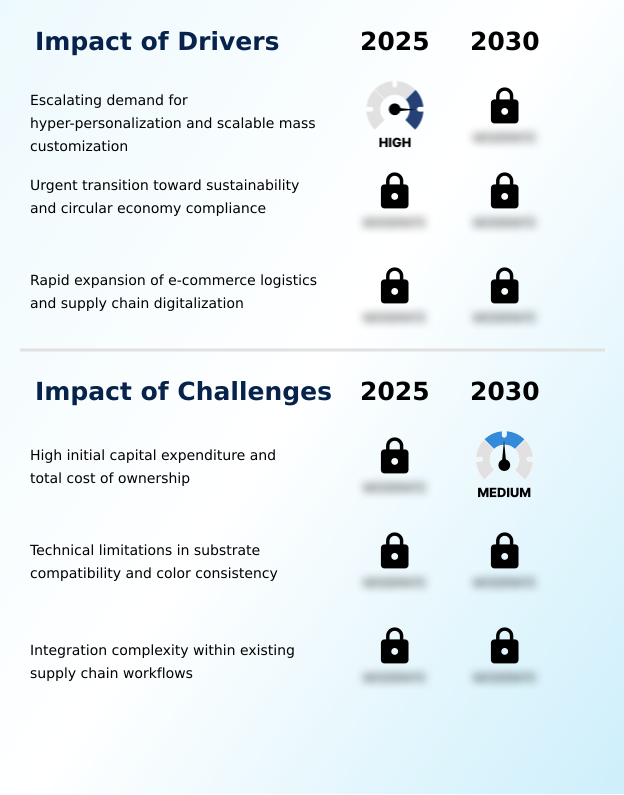
  • The escalating demand for hyper-personalization and scalable mass customization is a primary driver fueling market growth.

  • Market drivers are fundamentally tied to improving supply chain agility and achieving significant time-to-market reduction.
  • The adoption of hybrid printing systems and digital finishing tools facilitates this by enabling on-demand printing and short-run production for applications like folding carton production and flexible packaging printing.
  • Key technologies, including smart packaging integration and prepress automation, allow for efficient inventory management optimization, with some converters achieving a 30% decrease in obsolete stock.
  • The demand for enhanced brand protection features has also accelerated the use of food-safe digital inks. These advancements are crucial for just-in-time manufacturing and supporting the intricate demands of label printing technology.
  • Consequently, firms are realizing over a 20% improvement in production flexibility.

What are the market trends shaping the Digital Printing For Packaging Industry?

  • The proliferation of personalized consumer engagement models is increasingly reliant on variable data printing strategies. This trend enables brands to deliver highly customized packaging at scale.

  • Key market trends are centered on delivering personalized packaging through advanced digital press technology. The use of piezoelectric printheads and UV-curable inks is enabling custom packaging solutions with vibrant graphics and unique finishes. This shift supports variable data printing, allowing for mass customization in e-commerce packaging design and sustainable packaging printing.
  • The electrophotography process, combined with precise color management software, ensures high-quality output for luxury goods packaging. Adoption of these technologies has improved time-to-market by up to 50% for short-run campaigns. Furthermore, the single-pass inkjet method is transforming corrugated box printing, with businesses reporting a 40% reduction in waste compared to conventional litho-lamination processes for comparable run lengths.

What challenges does the Digital Printing For Packaging Industry face during its growth?

  • The high initial capital expenditure and total cost of ownership present a significant challenge to market adoption.

  • Key challenges involve managing the complexities of new materials and ensuring circular economy compliance. While mono-material substrates and eco-labeling standards are key for sustainable goals, they demand advanced ink chemistries to ensure durability. The integration of GS1 Digital Link and digital watermarking for traceability adds a layer of technical difficulty.
  • Additionally, the need for right-size packaging and automated sorting codes requires seamless automated workflow integration, which legacy systems often lack. This transition can lead to initial production slowdowns of up to 15%. Overcoming these issues is essential for consumer engagement strategies and meeting regulatory compliance labeling for promotional packaging.
  • The high cost of specialized food-safe digital inks and eco-friendly printing inks also remains a barrier for smaller enterprises.

Exclusive Technavio Analysis on Customer Landscape

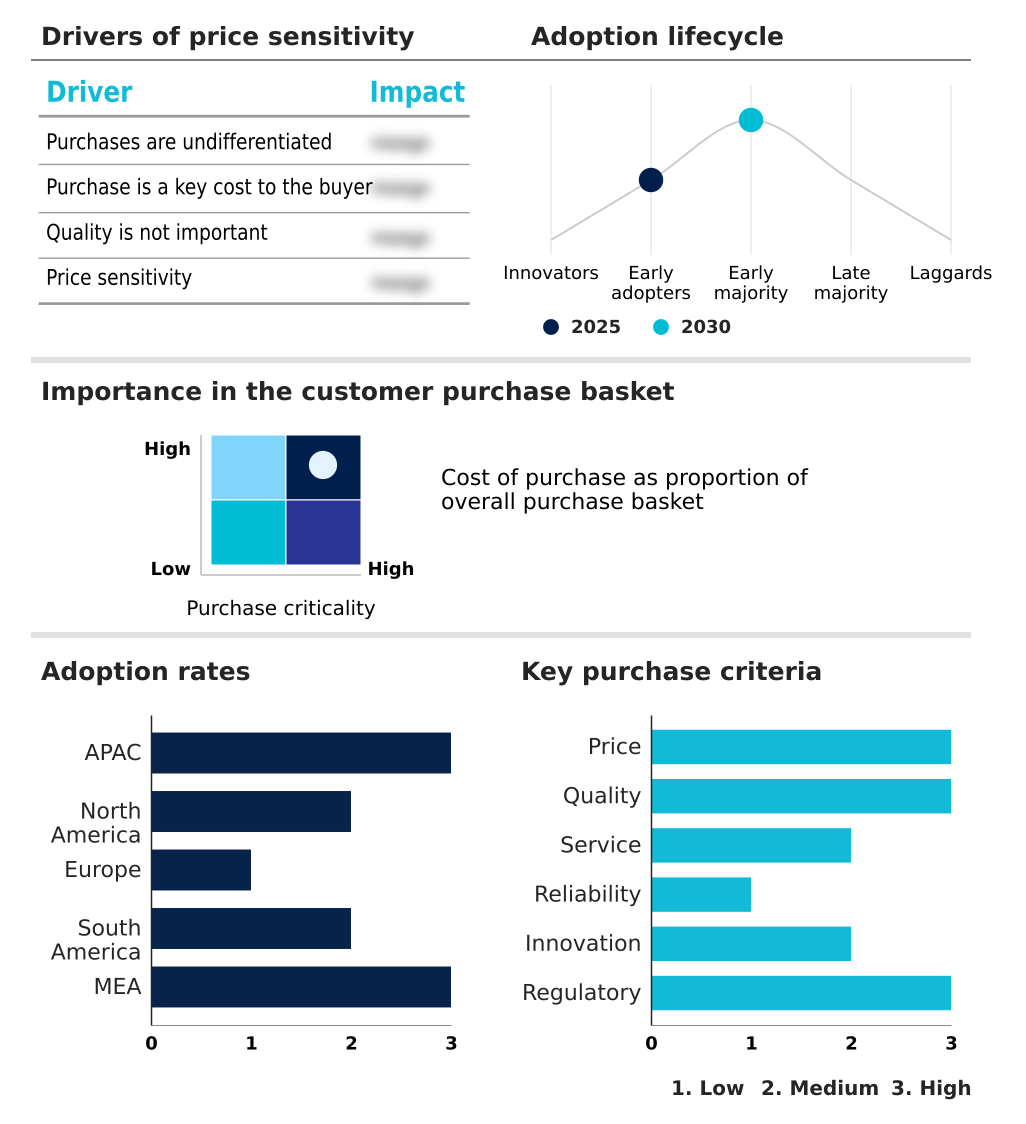
The digital printing for packaging market forecasting report includes the adoption lifecycle of the market, covering from the innovator’s stage to the laggard’s stage. It focuses on adoption rates in different regions based on penetration. Furthermore, the digital printing for packaging market report also includes key purchase criteria and drivers of price sensitivity to help companies evaluate and develop their market growth analysis strategies.

Customer Landscape of Digital Printing For Packaging Industry

Competitive Landscape

Companies are implementing various strategies, such as strategic alliances, digital printing for packaging market forecast, partnerships, mergers and acquisitions, geographical expansion, and product/service launches, to enhance their presence in the industry.

Bobst Group SA - Provides advanced digital and hybrid systems for high-performance label and packaging production, integrating precision engineering with workflow automation.

The industry research and growth report includes detailed analyses of the competitive landscape of the market and information about key companies, including:

  • Bobst Group SA
  • Brother Industries Ltd.
  • Canon Inc.
  • Durst Group AG
  • FUJIFILM Holdings Corp.
  • Heidelberger Druckmaschinen AG
  • HP Inc.
  • Konica Minolta Inc.
  • Kornit Digital Ltd.
  • Kyocera Corp.
  • Landa Corp. Ltd.
  • Mark Andy Inc.
  • Mimaki Engineering Co. Ltd.
  • Ricoh Co. Ltd.
  • Roland DG Corp.
  • Screen Holdings Co. Ltd.
  • Sharp Corp.
  • Xeikon
  • Xerox Holdings Corp.

Qualitative and quantitative analysis of companies has been conducted to help clients understand the wider business environment as well as the strengths and weaknesses of key industry players. Data is qualitatively analyzed to categorize companies as pure play, category-focused, industry-focused, and diversified; it is quantitatively analyzed to categorize companies as dominant, leading, strong, tentative, and weak.

Recent Development and News in Digital printing for packaging market

  • In October 2024, a leading digital press manufacturer announced the commercial launch of its new industrial-scale inkjet platform, specifically engineered for high-speed, single-pass printing on corrugated substrates, targeting the e-commerce packaging sector.
  • In December 2024, a major packaging converter completed its acquisition of a specialized flexible packaging firm, a strategic move aimed at integrating advanced digital printing technologies and securing expertise in food-grade, sustainable packaging.
  • In February 2025, a strategic partnership was formed between a top software provider and a digital press OEM to co-develop an AI-driven workflow automation suite designed to optimize prepress operations and reduce job setup times by up to 40% for digital packaging.
  • In April 2025, following the finalization of new environmental regulations in Europe, a consortium of ink manufacturers unveiled a new line of certified compostable, low-migration UV inks, developed to meet circular economy standards for food and pharmaceutical packaging.

Dive into Technavio’s robust research methodology, blending expert interviews, extensive data synthesis, and validated models for unparalleled Digital Printing For Packaging Market insights. See full methodology.

Market Scope
Page number 307
Base year 2025
Historic period 2020-2024
Forecast period 2026-2030
Growth momentum & CAGR Accelerate at a CAGR of 10.1%
Market growth 2026-2030 USD 17904.4 million
Market structure Fragmented
YoY growth 2025-2026(%) 9.3%
Key countries China, Japan, India, South Korea, Australia, Indonesia, US, Canada, Mexico, Germany, UK, France, Italy, Spain, The Netherlands, Brazil, Argentina, Colombia, South Africa, Saudi Arabia, UAE, Turkey and Nigeria
Competitive landscape Leading Companies, Market Positioning of Companies, Competitive Strategies, and Industry Risks

Request Free Sample

Research Analyst Overview

  • The digital printing for packaging market is characterized by a decisive shift toward highly automated and data-driven production environments. Key technologies such as piezoelectric printheads and single-pass inkjet systems are enabling unprecedented speeds and precision. This technological maturation, marked by enhanced printhead longevity, nozzle density, and drop placement accuracy, allows for the widespread adoption of on-demand printing and short-run production.
  • Boardroom decisions are now heavily influenced by the capabilities of digital press technology to facilitate variable data printing, which is crucial for personalization. The integration of color management software, prepress automation, and digital finishing tools into hybrid printing systems is becoming standard. These systems must handle diverse materials, requiring exceptional substrate compatibility and advanced pigment ink formulations.
  • The move toward sustainable practices is driving demand for food-safe digital inks with low VOC emissions, suitable for mono-material substrates. For supply chain security, smart packaging integration with features like GS1 Digital Link, automated sorting codes, digital watermarking, and serialized security labels is critical.
  • The market's evolution is further defined by advanced processes like electrophotography, liquid electrophotography, and toner-based systems, enabling applications from narrow-web printing to direct-to-shape printing and digital embossing with laser cutting integration for functional labeling. Firms leveraging automated color management report a 30% reduction in calibration time.

What are the Key Data Covered in this Digital Printing For Packaging Market Research and Growth Report?

  • What is the expected growth of the Digital Printing For Packaging Market between 2026 and 2030?

    • USD 17.90 billion, at a CAGR of 10.1%

  • What segmentation does the market report cover?

    • The report is segmented by Technology (Inkjet printing, and Electrophotography printing), Type (Labels, Flexible packaging, Corrugated and folding cartons, and Others), End-user (Food and beverages, Pharmaceutical, Personal care and cosmetics, Retail, and Others) and Geography (APAC, North America, Europe, South America, Middle East and Africa)

  • Which regions are analyzed in the report?

    • APAC, North America, Europe, South America and Middle East and Africa

  • What are the key growth drivers and market challenges?

    • Escalating demand for hyper-personalization and scalable mass customization , High initial capital expenditure and total cost of ownership

  • Who are the major players in the Digital Printing For Packaging Market?

    • Bobst Group SA, Brother Industries Ltd., Canon Inc., Durst Group AG, FUJIFILM Holdings Corp., Heidelberger Druckmaschinen AG, HP Inc., Konica Minolta Inc., Kornit Digital Ltd., Kyocera Corp., Landa Corp. Ltd., Mark Andy Inc., Mimaki Engineering Co. Ltd., Ricoh Co. Ltd., Roland DG Corp., Screen Holdings Co. Ltd., Sharp Corp., Xeikon and Xerox Holdings Corp.

Market Research Insights

  • Market dynamics are increasingly shaped by the pursuit of enhanced consumer engagement strategies, where custom packaging solutions are paramount. The adoption of data-driven packaging has demonstrated a 25% uplift in brand interaction metrics compared to static designs. This shift toward direct-to-consumer packaging is facilitated by just-in-time manufacturing, which reduces inventory holding costs by over 30%.
  • Furthermore, inventory management optimization is achieved through small-batch production, allowing brands to respond to market changes with greater supply chain agility. Artisanal product packaging and craft beverage labels leverage these capabilities to compete with larger brands by offering premium branding and unique unboxing experience enhancement without requiring large-scale production runs.

We can help! Our analysts can customize this digital printing for packaging market research report to meet your requirements.

Get in touch

1. Executive Summary

1.1 Market overview

Executive Summary - Chart on Market Overview
Executive Summary - Data Table on Market Overview
Executive Summary - Chart on Global Market Characteristics
Executive Summary - Chart on Market by Geography
Executive Summary - Chart on Market Segmentation by Technology
Executive Summary - Chart on Market Segmentation by Type
Executive Summary - Chart on Market Segmentation by End-user
Executive Summary - Chart on Incremental Growth
Executive Summary - Data Table on Incremental Growth
Executive Summary - Chart on Company Market Positioning

2. Technavio Analysis

2.1 Analysis of price sensitivity, lifecycle, customer purchase basket, adoption rates, and purchase criteria

2.2 Criticality of inputs and Factors of differentiation

Chart on Overview on criticality of inputs and factors of differentiation

2.3 Factors of disruption

Chart on Overview on factors of disruption

2.4 Impact of drivers and challenges

Chart on Impact of drivers and challenges in 2025 and 2030

3. Market Landscape

3.1 Market ecosystem

Chart on Parent Market
Data Table on - Parent Market

3.2 Market characteristics

Chart on Market characteristics analysis

3.3 Value chain analysis

Chart on Value chain analysis

4. Market Sizing

4.1 Market definition

Data Table on Offerings of companies included in the market definition

4.2 Market segment analysis

Market segments

4.3 Market size 2025

4.4 Market outlook: Forecast for 2025-2030

Chart on Global - Market size and forecast 2025-2030 ($ million)
Data Table on Global - Market size and forecast 2025-2030 ($ million)
Chart on Global Market: Year-over-year growth 2025-2030 (%)
Data Table on Global Market: Year-over-year growth 2025-2030 (%)

5. Historic Market Size

5.1 Global Digital Printing For Packaging Market 2020 - 2024

Historic Market Size - Data Table on Global Digital Printing For Packaging Market 2020 - 2024 ($ million)

5.2 Technology segment analysis 2020 - 2024

Historic Market Size - Technology Segment 2020 - 2024 ($ million)

5.3 Type segment analysis 2020 - 2024

Historic Market Size - Type Segment 2020 - 2024 ($ million)

5.4 End-user segment analysis 2020 - 2024

Historic Market Size - End-user Segment 2020 - 2024 ($ million)

5.5 Geography segment analysis 2020 - 2024

Historic Market Size - Geography Segment 2020 - 2024 ($ million)

5.6 Country segment analysis 2020 - 2024

Historic Market Size - Country Segment 2020 - 2024 ($ million)

6. Qualitative Analysis

6.1 Impact of AI on Global Digital Printing for Packaging Market

6.2 Impact of geopolitical conflicts on Global Digital Printing for Packaging Market

7. Five Forces Analysis

7.1 Five forces summary

Five forces analysis - Comparison between 2025 and 2030

7.2 Bargaining power of buyers

Bargaining power of buyers - Impact of key factors 2025 and 2030

7.3 Bargaining power of suppliers

Bargaining power of suppliers - Impact of key factors in 2025 and 2030

7.4 Threat of new entrants

Threat of new entrants - Impact of key factors in 2025 and 2030

7.5 Threat of substitutes

Threat of substitutes - Impact of key factors in 2025 and 2030

7.6 Threat of rivalry

Threat of rivalry - Impact of key factors in 2025 and 2030

7.7 Market condition

Chart on Market condition - Five forces 2025 and 2030

8. Market Segmentation by Technology

8.1 Market segments

Chart on Technology - Market share 2025-2030 (%)
Data Table on Technology - Market share 2025-2030 (%)

8.2 Comparison by Technology

Chart on Comparison by Technology
Data Table on Comparison by Technology

8.3 Inkjet printing - Market size and forecast 2025-2030

Chart on Inkjet printing - Market size and forecast 2025-2030 ($ million)
Data Table on Inkjet printing - Market size and forecast 2025-2030 ($ million)
Chart on Inkjet printing - Year-over-year growth 2025-2030 (%)
Data Table on Inkjet printing - Year-over-year growth 2025-2030 (%)

8.4 Electrophotography printing - Market size and forecast 2025-2030

Chart on Electrophotography printing - Market size and forecast 2025-2030 ($ million)
Data Table on Electrophotography printing - Market size and forecast 2025-2030 ($ million)
Chart on Electrophotography printing - Year-over-year growth 2025-2030 (%)
Data Table on Electrophotography printing - Year-over-year growth 2025-2030 (%)

8.5 Market opportunity by Technology

Market opportunity by Technology ($ million)
Data Table on Market opportunity by Technology ($ million)

9. Market Segmentation by Type

9.1 Market segments

Chart on Type - Market share 2025-2030 (%)
Data Table on Type - Market share 2025-2030 (%)

9.2 Comparison by Type

Chart on Comparison by Type
Data Table on Comparison by Type

9.3 Labels - Market size and forecast 2025-2030

Chart on Labels - Market size and forecast 2025-2030 ($ million)
Data Table on Labels - Market size and forecast 2025-2030 ($ million)
Chart on Labels - Year-over-year growth 2025-2030 (%)
Data Table on Labels - Year-over-year growth 2025-2030 (%)

9.4 Flexible packaging - Market size and forecast 2025-2030

Chart on Flexible packaging - Market size and forecast 2025-2030 ($ million)
Data Table on Flexible packaging - Market size and forecast 2025-2030 ($ million)
Chart on Flexible packaging - Year-over-year growth 2025-2030 (%)
Data Table on Flexible packaging - Year-over-year growth 2025-2030 (%)

9.5 Corrugated and folding cartons - Market size and forecast 2025-2030

Chart on Corrugated and folding cartons - Market size and forecast 2025-2030 ($ million)
Data Table on Corrugated and folding cartons - Market size and forecast 2025-2030 ($ million)
Chart on Corrugated and folding cartons - Year-over-year growth 2025-2030 (%)
Data Table on Corrugated and folding cartons - Year-over-year growth 2025-2030 (%)

9.6 Others - Market size and forecast 2025-2030

Chart on Others - Market size and forecast 2025-2030 ($ million)
Data Table on Others - Market size and forecast 2025-2030 ($ million)
Chart on Others - Year-over-year growth 2025-2030 (%)
Data Table on Others - Year-over-year growth 2025-2030 (%)

9.7 Market opportunity by Type

Market opportunity by Type ($ million)
Data Table on Market opportunity by Type ($ million)

10. Market Segmentation by End-user

10.1 Market segments

Chart on End-user - Market share 2025-2030 (%)
Data Table on End-user - Market share 2025-2030 (%)

10.2 Comparison by End-user

Chart on Comparison by End-user
Data Table on Comparison by End-user

10.3 Food and beverages - Market size and forecast 2025-2030

Chart on Food and beverages - Market size and forecast 2025-2030 ($ million)
Data Table on Food and beverages - Market size and forecast 2025-2030 ($ million)
Chart on Food and beverages - Year-over-year growth 2025-2030 (%)
Data Table on Food and beverages - Year-over-year growth 2025-2030 (%)

10.4 Pharmaceutical - Market size and forecast 2025-2030

Chart on Pharmaceutical - Market size and forecast 2025-2030 ($ million)
Data Table on Pharmaceutical - Market size and forecast 2025-2030 ($ million)
Chart on Pharmaceutical - Year-over-year growth 2025-2030 (%)
Data Table on Pharmaceutical - Year-over-year growth 2025-2030 (%)

10.5 Personal care and cosmetics - Market size and forecast 2025-2030

Chart on Personal care and cosmetics - Market size and forecast 2025-2030 ($ million)
Data Table on Personal care and cosmetics - Market size and forecast 2025-2030 ($ million)
Chart on Personal care and cosmetics - Year-over-year growth 2025-2030 (%)
Data Table on Personal care and cosmetics - Year-over-year growth 2025-2030 (%)

10.6 Retail - Market size and forecast 2025-2030

Chart on Retail - Market size and forecast 2025-2030 ($ million)
Data Table on Retail - Market size and forecast 2025-2030 ($ million)
Chart on Retail - Year-over-year growth 2025-2030 (%)
Data Table on Retail - Year-over-year growth 2025-2030 (%)

10.7 Others - Market size and forecast 2025-2030

Chart on Others - Market size and forecast 2025-2030 ($ million)
Data Table on Others - Market size and forecast 2025-2030 ($ million)
Chart on Others - Year-over-year growth 2025-2030 (%)
Data Table on Others - Year-over-year growth 2025-2030 (%)

10.8 Market opportunity by End-user

Market opportunity by End-user ($ million)
Data Table on Market opportunity by End-user ($ million)

11. Customer Landscape

11.1 Customer landscape overview

Analysis of price sensitivity, lifecycle, customer purchase basket, adoption rates, and purchase criteria

12. Geographic Landscape

12.1 Geographic segmentation

Chart on Market share by geography 2025-2030 (%)
Data Table on Market share by geography 2025-2030 (%)

12.2 Geographic comparison

Chart on Geographic comparison
Data Table on Geographic comparison

12.3 APAC - Market size and forecast 2025-2030

Chart on APAC - Market size and forecast 2025-2030 ($ million)
Data Table on APAC - Market size and forecast 2025-2030 ($ million)
Chart on APAC - Year-over-year growth 2025-2030 (%)
Data Table on APAC - Year-over-year growth 2025-2030 (%)
Chart on Regional Comparison - APAC
Data Table on Regional Comparison - APAC

12.3.1 China - Market size and forecast 2025-2030

Chart on China - Market size and forecast 2025-2030 ($ million)
Data Table on China - Market size and forecast 2025-2030 ($ million)
Chart on China - Year-over-year growth 2025-2030 (%)
Data Table on China - Year-over-year growth 2025-2030 (%)

12.3.2 Japan - Market size and forecast 2025-2030

Chart on Japan - Market size and forecast 2025-2030 ($ million)
Data Table on Japan - Market size and forecast 2025-2030 ($ million)
Chart on Japan - Year-over-year growth 2025-2030 (%)
Data Table on Japan - Year-over-year growth 2025-2030 (%)

12.3.3 India - Market size and forecast 2025-2030

Chart on India - Market size and forecast 2025-2030 ($ million)
Data Table on India - Market size and forecast 2025-2030 ($ million)
Chart on India - Year-over-year growth 2025-2030 (%)
Data Table on India - Year-over-year growth 2025-2030 (%)

12.3.4 South Korea - Market size and forecast 2025-2030

Chart on South Korea - Market size and forecast 2025-2030 ($ million)
Data Table on South Korea - Market size and forecast 2025-2030 ($ million)
Chart on South Korea - Year-over-year growth 2025-2030 (%)
Data Table on South Korea - Year-over-year growth 2025-2030 (%)

12.3.5 Australia - Market size and forecast 2025-2030

Chart on Australia - Market size and forecast 2025-2030 ($ million)
Data Table on Australia - Market size and forecast 2025-2030 ($ million)
Chart on Australia - Year-over-year growth 2025-2030 (%)
Data Table on Australia - Year-over-year growth 2025-2030 (%)

12.3.6 Indonesia - Market size and forecast 2025-2030

Chart on Indonesia - Market size and forecast 2025-2030 ($ million)
Data Table on Indonesia - Market size and forecast 2025-2030 ($ million)
Chart on Indonesia - Year-over-year growth 2025-2030 (%)
Data Table on Indonesia - Year-over-year growth 2025-2030 (%)

12.4 North America - Market size and forecast 2025-2030

Chart on North America - Market size and forecast 2025-2030 ($ million)
Data Table on North America - Market size and forecast 2025-2030 ($ million)
Chart on North America - Year-over-year growth 2025-2030 (%)
Data Table on North America - Year-over-year growth 2025-2030 (%)
Chart on Regional Comparison - North America
Data Table on Regional Comparison - North America

12.4.1 US - Market size and forecast 2025-2030

Chart on US - Market size and forecast 2025-2030 ($ million)
Data Table on US - Market size and forecast 2025-2030 ($ million)
Chart on US - Year-over-year growth 2025-2030 (%)
Data Table on US - Year-over-year growth 2025-2030 (%)

12.4.2 Canada - Market size and forecast 2025-2030

Chart on Canada - Market size and forecast 2025-2030 ($ million)
Data Table on Canada - Market size and forecast 2025-2030 ($ million)
Chart on Canada - Year-over-year growth 2025-2030 (%)
Data Table on Canada - Year-over-year growth 2025-2030 (%)

12.4.3 Mexico - Market size and forecast 2025-2030

Chart on Mexico - Market size and forecast 2025-2030 ($ million)
Data Table on Mexico - Market size and forecast 2025-2030 ($ million)
Chart on Mexico - Year-over-year growth 2025-2030 (%)
Data Table on Mexico - Year-over-year growth 2025-2030 (%)

12.5 Europe - Market size and forecast 2025-2030

Chart on Europe - Market size and forecast 2025-2030 ($ million)
Data Table on Europe - Market size and forecast 2025-2030 ($ million)
Chart on Europe - Year-over-year growth 2025-2030 (%)
Data Table on Europe - Year-over-year growth 2025-2030 (%)
Chart on Regional Comparison - Europe
Data Table on Regional Comparison - Europe

12.5.1 Germany - Market size and forecast 2025-2030

Chart on Germany - Market size and forecast 2025-2030 ($ million)
Data Table on Germany - Market size and forecast 2025-2030 ($ million)
Chart on Germany - Year-over-year growth 2025-2030 (%)
Data Table on Germany - Year-over-year growth 2025-2030 (%)

12.5.2 UK - Market size and forecast 2025-2030

Chart on UK - Market size and forecast 2025-2030 ($ million)
Data Table on UK - Market size and forecast 2025-2030 ($ million)
Chart on UK - Year-over-year growth 2025-2030 (%)
Data Table on UK - Year-over-year growth 2025-2030 (%)

12.5.3 France - Market size and forecast 2025-2030

Chart on France - Market size and forecast 2025-2030 ($ million)
Data Table on France - Market size and forecast 2025-2030 ($ million)
Chart on France - Year-over-year growth 2025-2030 (%)
Data Table on France - Year-over-year growth 2025-2030 (%)

12.5.4 Italy - Market size and forecast 2025-2030

Chart on Italy - Market size and forecast 2025-2030 ($ million)
Data Table on Italy - Market size and forecast 2025-2030 ($ million)
Chart on Italy - Year-over-year growth 2025-2030 (%)
Data Table on Italy - Year-over-year growth 2025-2030 (%)

12.5.5 Spain - Market size and forecast 2025-2030

Chart on Spain - Market size and forecast 2025-2030 ($ million)
Data Table on Spain - Market size and forecast 2025-2030 ($ million)
Chart on Spain - Year-over-year growth 2025-2030 (%)
Data Table on Spain - Year-over-year growth 2025-2030 (%)

12.5.6 The Netherlands - Market size and forecast 2025-2030

Chart on The Netherlands - Market size and forecast 2025-2030 ($ million)
Data Table on The Netherlands - Market size and forecast 2025-2030 ($ million)
Chart on The Netherlands - Year-over-year growth 2025-2030 (%)
Data Table on The Netherlands - Year-over-year growth 2025-2030 (%)

12.6 South America - Market size and forecast 2025-2030

Chart on South America - Market size and forecast 2025-2030 ($ million)
Data Table on South America - Market size and forecast 2025-2030 ($ million)
Chart on South America - Year-over-year growth 2025-2030 (%)
Data Table on South America - Year-over-year growth 2025-2030 (%)
Chart on Regional Comparison - South America
Data Table on Regional Comparison - South America

12.6.1 Brazil - Market size and forecast 2025-2030

Chart on Brazil - Market size and forecast 2025-2030 ($ million)
Data Table on Brazil - Market size and forecast 2025-2030 ($ million)
Chart on Brazil - Year-over-year growth 2025-2030 (%)
Data Table on Brazil - Year-over-year growth 2025-2030 (%)

12.6.2 Argentina - Market size and forecast 2025-2030

Chart on Argentina - Market size and forecast 2025-2030 ($ million)
Data Table on Argentina - Market size and forecast 2025-2030 ($ million)
Chart on Argentina - Year-over-year growth 2025-2030 (%)
Data Table on Argentina - Year-over-year growth 2025-2030 (%)

12.6.3 Colombia - Market size and forecast 2025-2030

Chart on Colombia - Market size and forecast 2025-2030 ($ million)
Data Table on Colombia - Market size and forecast 2025-2030 ($ million)
Chart on Colombia - Year-over-year growth 2025-2030 (%)
Data Table on Colombia - Year-over-year growth 2025-2030 (%)

12.7 Middle East and Africa - Market size and forecast 2025-2030

Chart on Middle East and Africa - Market size and forecast 2025-2030 ($ million)
Data Table on Middle East and Africa - Market size and forecast 2025-2030 ($ million)
Chart on Middle East and Africa - Year-over-year growth 2025-2030 (%)
Data Table on Middle East and Africa - Year-over-year growth 2025-2030 (%)
Chart on Regional Comparison - Middle East and Africa
Data Table on Regional Comparison - Middle East and Africa

12.7.1 South Africa - Market size and forecast 2025-2030

Chart on South Africa - Market size and forecast 2025-2030 ($ million)
Data Table on South Africa - Market size and forecast 2025-2030 ($ million)
Chart on South Africa - Year-over-year growth 2025-2030 (%)
Data Table on South Africa - Year-over-year growth 2025-2030 (%)

12.7.2 Saudi Arabia - Market size and forecast 2025-2030

Chart on Saudi Arabia - Market size and forecast 2025-2030 ($ million)
Data Table on Saudi Arabia - Market size and forecast 2025-2030 ($ million)
Chart on Saudi Arabia - Year-over-year growth 2025-2030 (%)
Data Table on Saudi Arabia - Year-over-year growth 2025-2030 (%)

12.7.3 UAE - Market size and forecast 2025-2030

Chart on UAE - Market size and forecast 2025-2030 ($ million)
Data Table on UAE - Market size and forecast 2025-2030 ($ million)
Chart on UAE - Year-over-year growth 2025-2030 (%)
Data Table on UAE - Year-over-year growth 2025-2030 (%)

12.7.4 Turkey - Market size and forecast 2025-2030

Chart on Turkey - Market size and forecast 2025-2030 ($ million)
Data Table on Turkey - Market size and forecast 2025-2030 ($ million)
Chart on Turkey - Year-over-year growth 2025-2030 (%)
Data Table on Turkey - Year-over-year growth 2025-2030 (%)

12.7.5 Nigeria - Market size and forecast 2025-2030

Chart on Nigeria - Market size and forecast 2025-2030 ($ million)
Data Table on Nigeria - Market size and forecast 2025-2030 ($ million)
Chart on Nigeria - Year-over-year growth 2025-2030 (%)
Data Table on Nigeria - Year-over-year growth 2025-2030 (%)

12.8 Market opportunity by geography

Market opportunity by geography ($ million)
Data Tables on Market opportunity by geography ($ million)

13. Drivers, Challenges, and Opportunity

13.1 Market drivers

Escalating demand for hyper-personalization and scalable mass customization
Urgent transition toward sustainability and circular economy compliance
Rapid expansion of e-commerce logistics and supply chain digitalization

13.2 Market challenges

High initial capital expenditure and total cost of ownership
Technical limitations in substrate compatibility and color consistency
Integration complexity within existing supply chain workflows

13.3 Impact of drivers and challenges

Impact of drivers and challenges in 2025 and 2030

13.4 Market opportunities

Proliferation of personalized consumer engagement and variable data printing strategies
Escalation of supply chain agility and accelerated time to market requirements
Technological maturation of high speed inkjet systems and hybrid printing architectures

14. Competitive Landscape

14.1 Overview

14.2

Overview on criticality of inputs and factors of differentiation

14.3 Landscape disruption

Overview on factors of disruption

14.4 Industry risks

Impact of key risks on business

15. Competitive Analysis

15.1 Companies profiled

Companies covered

15.2 Company ranking index

15.3 Market positioning of companies

Matrix on companies position and classification

15.4 Bobst Group SA

Bobst Group SA - Overview
Bobst Group SA - Business segments
Bobst Group SA - Key offerings
Bobst Group SA - Segment focus
SWOT

15.5 Brother Industries Ltd.

Brother Industries Ltd. - Overview
Brother Industries Ltd. - Business segments
Brother Industries Ltd. - Key offerings
Brother Industries Ltd. - Segment focus
SWOT

15.6 Canon Inc.

Canon Inc. - Overview
Canon Inc. - Business segments
Canon Inc. - Key offerings
Canon Inc. - Segment focus
SWOT

15.7 Durst Group AG

Durst Group AG - Overview
Durst Group AG - Product / Service
Durst Group AG - Key offerings
SWOT

15.8 FUJIFILM Holdings Corp.

FUJIFILM Holdings Corp. - Overview
FUJIFILM Holdings Corp. - Business segments
FUJIFILM Holdings Corp. - Key news
FUJIFILM Holdings Corp. - Key offerings
FUJIFILM Holdings Corp. - Segment focus
SWOT

15.9 Heidelberger Druckmaschinen AG

Heidelberger Druckmaschinen AG - Overview
Heidelberger Druckmaschinen AG - Product / Service
Heidelberger Druckmaschinen AG - Key offerings
SWOT

15.10 HP Inc.

HP Inc. - Overview
HP Inc. - Business segments
HP Inc. - Key offerings
HP Inc. - Segment focus
SWOT

15.11 Konica Minolta Inc.

Konica Minolta Inc. - Overview
Konica Minolta Inc. - Business segments
Konica Minolta Inc. - Key offerings
Konica Minolta Inc. - Segment focus
SWOT

15.12 Kyocera Corp.

Kyocera Corp. - Overview
Kyocera Corp. - Business segments
Kyocera Corp. - Key offerings
Kyocera Corp. - Segment focus
SWOT

15.13 Mimaki Engineering Co. Ltd.

Mimaki Engineering Co. Ltd. - Overview
Mimaki Engineering Co. Ltd. - Product / Service
Mimaki Engineering Co. Ltd. - Key offerings
SWOT

15.14 Ricoh Co. Ltd.

Ricoh Co. Ltd. - Overview
Ricoh Co. Ltd. - Business segments
Ricoh Co. Ltd. - Key offerings
Ricoh Co. Ltd. - Segment focus
SWOT

15.15 Roland DG Corp.

Roland DG Corp. - Overview
Roland DG Corp. - Product / Service
Roland DG Corp. - Key offerings
SWOT

15.16 Screen Holdings Co. Ltd.

Screen Holdings Co. Ltd. - Overview
Screen Holdings Co. Ltd. - Business segments
Screen Holdings Co. Ltd. - Key offerings
Screen Holdings Co. Ltd. - Segment focus
SWOT

15.17 Sharp Corp.

Sharp Corp. - Overview
Sharp Corp. - Business segments
Sharp Corp. - Key offerings
Sharp Corp. - Segment focus
SWOT

15.18 Xerox Holdings Corp.

Xerox Holdings Corp. - Overview
Xerox Holdings Corp. - Business segments
Xerox Holdings Corp. - Key offerings
Xerox Holdings Corp. - Segment focus
SWOT

16. Appendix

16.1 Scope of the report

Market definition
Objectives
Notes and caveats

16.2 Inclusions and exclusions checklist

Inclusions checklist
Exclusions checklist

16.3 Currency conversion rates for US$

16.4 Research methodology

16.5 Data procurement

Information sources

16.6 Data validation

16.7 Validation techniques employed for market sizing

16.8 Data synthesis

16.9 360 degree market analysis

16.10 List of abbreviations

Research Methodology

Technavio presents a detailed picture of the market by way of study, synthesis, and summation of data from multiple sources. The analysts have presented the various facets of the market with a particular focus on identifying the key industry influencers. The data thus presented is comprehensive, reliable, and the result of extensive research, both primary and secondary.

INFORMATION SOURCES

Primary sources

  • Manufacturers and suppliers
  • Channel partners
  • Industry experts
  • Strategic decision makers

Secondary sources

  • Industry journals and periodicals
  • Government data
  • Financial reports of key industry players
  • Historical data
  • Press releases

DATA ANALYSIS

Data Synthesis

  • Collation of data
  • Estimation of key figures
  • Analysis of derived insights

Data Validation

  • Triangulation with data models
  • Reference against proprietary databases
  • Corroboration with industry experts

REPORT WRITING

Qualitative

  • Market drivers
  • Market challenges
  • Market trends
  • Five forces analysis

Quantitative

  • Market size and forecast
  • Market segmentation
  • Geographical insights
  • Competitive landscape

Interested in this report?

Get your sample now to see our research methodology and insights!

Download Now

Frequently Asked Questions

Digital Printing For Packaging market growth will increase by USD 17904.4 million during 2026-2030.

The Digital Printing For Packaging market is expected to grow at a CAGR of 10.1% during 2026-2030.

Digital Printing For Packaging market is segmented by Technology (Inkjet printing, Electrophotography printing) Type (Labels, Flexible packaging, Corrugated and folding cartons, Others) End-user (Food and beverages, Pharmaceutical, Personal care and cosmetics, Retail, Others)

Bobst Group SA, Brother Industries Ltd., Canon Inc., Durst Group AG, FUJIFILM Holdings Corp., Heidelberger Druckmaschinen AG, HP Inc., Konica Minolta Inc., Kornit Digital Ltd., Kyocera Corp., Landa Corp. Ltd., Mark Andy Inc., Mimaki Engineering Co. Ltd., Ricoh Co. Ltd., Roland DG Corp., Screen Holdings Co. Ltd., Sharp Corp., Xeikon, Xerox Holdings Corp. are a few of the key vendors in the Digital Printing For Packaging market.

APAC will register the highest growth rate of 36.4% among the other regions. Therefore, the Digital Printing For Packaging market in APAC is expected to garner significant business opportunities for the vendors during the forecast period.

China, Japan, India, South Korea, Australia, Indonesia, US, Canada, Mexico, Germany, UK, France, Italy, Spain, The Netherlands, Brazil, Argentina, Colombia, South Africa, Saudi Arabia, UAE, Turkey, Nigeria

  • Escalating demand for hyper-personalization and scalable mass customization is the driving factor this market.

The Digital Printing For Packaging market vendors should focus on grabbing business opportunities from the Technology segment as it accounted for the largest market share in the base year.
RIA - Research AI Assistant
Ask RIA