LCD Glass Market Analysis APAC, North America, Europe, South America, Middle East and Africa - China, US, Taiwan, South Korea, Japan, Germany, France, Singapore, UK, India - Size and Forecast 2025-2029

LCD Glass Market Analysis APAC, North America, Europe, South America, Middle East and Africa - China, US, Taiwan, South Korea, Japan, Germany, France, Singapore, UK, India - Size and Forecast 2025-2029

Published: Mar 2025 189 Pages SKU: IRTNTR80590

Market Overview at a Glance

$1.71 B
Market Opportunity
5.2%
CAGR
5.0
YoY growth 2024-2025(%)

LCD Glass Market Size 2025-2029

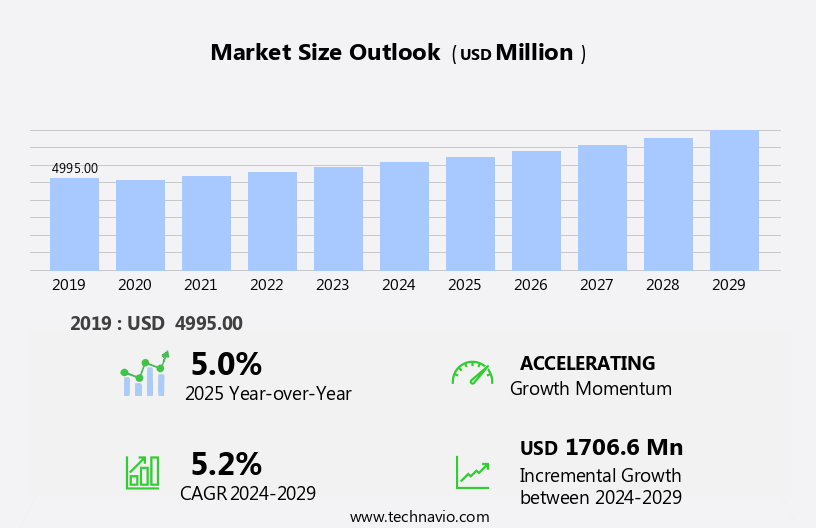
The LCD glass market size is forecast to increase by USD 1.71 billion, at a CAGR of 5.2% between 2024 and 2029.

  • The market is experiencing significant growth due to the increasing demand for consumer electronics and the rising adoption of high-resolution displays, such as 4K and 8K. This trend is driven by the advancements in technology and the growing preference for larger, clearer screens. However, the market faces challenges from alternatives, including OLED, QLED and LED displays, which offer similar features and are gaining popularity. Additionally, price competition and the need for continuous innovation to meet consumer demands are key factors influencing market dynamics. The market is expected to continue its growth trajectory, driven by these trends and the increasing demand for advanced display technologies.

What will be the Size of the Market During the Forecast Period?

LCD Glass Market Size

 Request Free Sample

  • The market is a dynamic and evolving industry, characterized by continuous innovation and advancements in technology. With the increasing demand for large screens in various applications, including digital signage solutions, advanced driver-assurance systems, augmented reality, and virtual reality, the market for LCD glass is experiencing significant growth. Manufacturers are focusing on cost reduction through sustainable manufacturing processes and the use of biodegradable materials. Quality control and rigorous testing are essential to ensure the transparency and durability of LCD glass. Next-generation technologies, such as flexible electronics and engineering innovations, are driving the development of lighter, thinner, and more efficient LCD glass.
  • Regulations and material science are also key considerations In the market, as manufacturers strive to meet industry standards and create high-performing, reliable products. The future of LCD glass is bright, with ongoing research and development in areas such as next-generation manufacturing processes and the integration of advanced technologies, including next-generation display technologies and engineering innovations. The market is expected to continue growing, driven by the increasing demand for high-quality, cost-effective, and sustainable display solutions.

How is this LCD Glass Industry segmented and which is the largest segment?

The LCD glass industry research report provides comprehensive data (region-wise segment analysis), with forecasts and estimates in "USD billion" for the period 2025-2029, as well as historical data from 2019-2023 for the following segments.
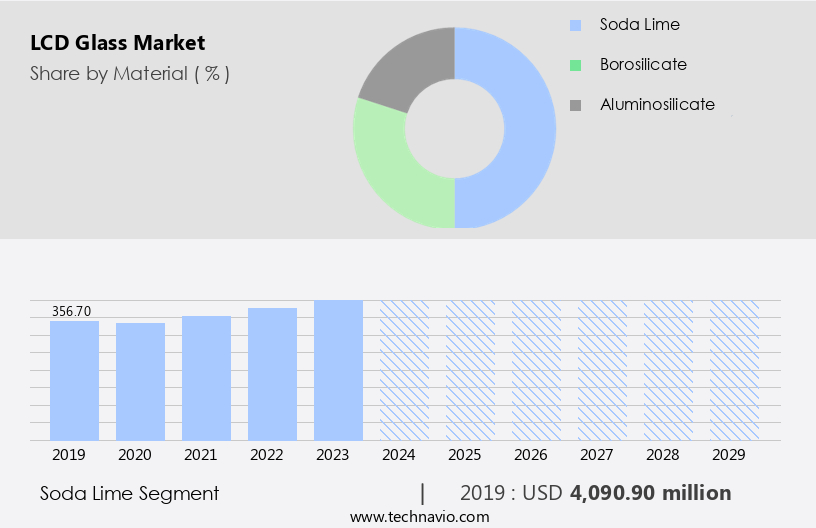
  • Material
    • Soda lime
    • Borosilicate
    • Aluminosilicate
  • Application
    • LCD TVs
    • Desktop monitors
    • Notebook PCs
    • Smartphones and tablets
    • Others
  • Geography
    • APAC
      • China
      • India
      • Japan
      • South Korea
      • Singapore
    • North America
      • US
    • Europe
      • Germany
      • UK
      • France
    • South America
    • Middle East and Africa

By Material Insights

  • The soda lime segment is estimated to witness significant growth during the forecast period.

The market primarily utilizes soda lime glass as the material of choice for manufacturing LCD panels due to its cost-effectiveness and ease of production. Soda lime glass, made up of silica, soda, and lime, is widely used in commercial display applications, including TVs and tablets, owing to its affordability. The production process for soda lime glass is straightforward, contributing to its extensive usage in the market. Moreover, the adoption of eco-friendly production techniques and consumer preferences for sustainable solutions have led to innovative advancements in the market. Next-generation substrates, such as flexible eco-friendly glass substrates, are gaining traction due to their environmental benefits.

The integration of the Internet of Things (IoT), remote work, and wearable technology in various industries, including electronics, healthcare, and infotainment systems, is further driving the demand for LCD glass. Advancements in materials and manufacturing techniques have resulted in cost-effective, high-performance LCD glass. Strategic partnerships between leading companies in the LCD glass industry and diagnostic equipment manufacturers have facilitated the development of advanced visual experiences. The market is expected to continue its impact on various sectors, including in-flight entertainment systems, diagnostic equipment, and consumer electronics. Sustainability remains a key focus, with the use of next-generation substrates and manufacturing techniques to reduce environmental impact.

LCD Glass Market Size

Get a glance at the market report of share of various segments Request Free Sample

The soda lime segment was valued at USD 4.09 billion in 2019 and showed a gradual increase during the forecast period.

Regional Analysis

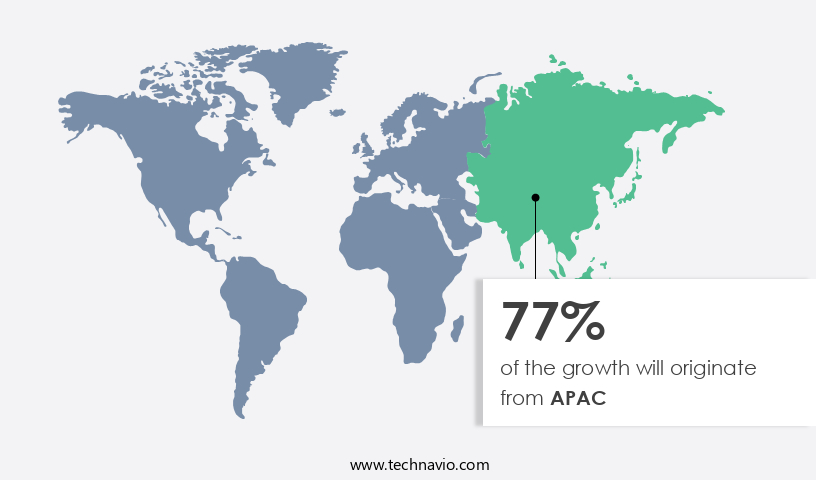
  • APAC is estimated to contribute 77% to the growth of the global market during the forecast period.

Technavio’s analysts have elaborately explained the regional trends and drivers that shape the market during the forecast period.

LCD Glass Market Share by Geography

For more insights on the market size of various regions, Request Free Sample

The market in the Asia-Pacific (APAC) region is experiencing significant growth, driven by advanced manufacturing capabilities, increasing consumer preferences for technology, and supportive government initiatives. Key countries, including China, Japan, South Korea, Taiwan, and India, are leading both production and consumption of LCD glass. China, as the world's largest market, hosts prominent panel manufacturers like BOE Technology, CSOT, and HKC, producing LCD panels for various applications such as televisions, smartphones, and monitors. The Chinese government's "Made in China 2025" initiative has bolstered domestic production, decreasing the country's reliance on imports. Innovative solutions, cost-effectiveness, and advancements in LCD glass technology continue to influence the market.

In addition, sustainability and next-generation substrates are also gaining importance, with eco-friendly glass substrates and manufacturing techniques being adopted. The Internet of Things (IoT), remote work, infotainment systems, in-flight entertainment systems, and wearable technology are among the sectors fueling the widespread acceptance of LCD glass. Strategic partnerships and collaborations between industry leaders and electronics, healthcare, and other sectors further propel market growth.

Market Dynamics

Our researchers analyzed the data with 2024 as the base year, along with the key drivers, trends, and challenges. A holistic analysis of drivers will help companies refine their marketing strategies to gain a competitive advantage.

What are the key market drivers leading to the rise In the adoption of the LCD Glass Industry?

Growing demand for consumer electronics is the key driver of the market.

  • The market is witnessing significant growth due to the increasing consumer preference for eco-friendly, high-performance, and innovative solutions in various sectors. Production processes are evolving to incorporate next-generation substrates and manufacturing techniques, such as flexible eco-friendly glass substrates, to meet the demands of the Internet of Things, remote work, and wearable technology.
  • In the electronics industry, which is valued at USD 4.3 trillion, advancements in diagnostic equipment, infotainment systems, in-flight entertainment systems, and healthcare technology are driving the need for cost-effective, energy-efficient, and thin LCD glass. Strategic partnerships between industry leaders are also contributing to the market's growth by enhancing the production capacity and expanding the application areas of LCD glass. The impact of coronavirus has led to a shift towards sustainable and cost-effective solutions, further boosting the market's potential.

What are the market trends shaping the LCD Glass Industry?

Rising adoption of 4K, 8K, and high-resolution displays is the upcoming market trend.

  • The market is experiencing a notable trend towards the utilization of high-definition displays, with 4K and 8K resolutions gaining widespread acceptance. This shift is driven by the increasing consumer preference for superior visual experiences in various applications, such as consumer electronics, professional displays, and industrial monitors. The demand for high-definition content is escalating as streaming services, gaming, and digital media continue to evolve. The adoption of these advanced resolutions offers significantly higher pixel densities compared to traditional Full HD displays, resulting in clearer, more detailed images and viewing experiences. Moreover, innovative solutions in the form of eco-friendly glass substrates are gaining traction in the market.
  • These next-generation substrates are manufactured using advanced techniques, contributing to sustainability and cost-effectiveness. The Internet of Things (IoT) and remote work are also fueling the demand for flexible LCD glass, particularly in the areas of infotainment systems, in-flight entertainment systems, diagnostic equipment, and wearable technology. Strategic partnerships and collaborations between industry leaders and materials suppliers are driving the innovation in LCD glass production processes. In summary, the market is witnessing significant advancements, driven by consumer preferences, cost-effectiveness, and the need for eco-friendly and flexible solutions.

What challenges does the LCD Glass Industry face during its growth?

Competition from alternatives is a key challenge affecting the industry growth.

  • The market is currently undergoing transformative changes due to evolving consumer preferences and technological advancements. Eco-friendly production processes and innovative solutions are gaining traction as sustainability becomes a key consideration for businesses and consumers alike. In this context, the adoption of next-generation substrates and manufacturing techniques is paving the way for cost-effective and high-performance LCD glass. The Internet of Things (IoT) and remote work trends are driving the demand for advanced LCD glass applications in various sectors, including diagnostic equipment, infotainment systems, in-flight entertainment systems, and wearable technology. These applications require LCD glass with superior visual experiences and durability.
  • Despite the challenges posed by OLED and other emerging display technologies, the market continues to thrive. Leading companies in the electronics, healthcare, and other industries are forging strategic partnerships to innovate and stay competitive. For instance, advancements in flexible eco-friendly glass substrates are opening new opportunities for LCD glass In the production of flexible displays and curved screens. The impact of coronavirus on the market has been significant, with supply chain disruptions and changing consumer behavior leading to shifts in demand. However, the market is expected to recover as the world adapts to the new normal and the demand for advanced LCD glass applications continues to grow.

Exclusive Customer Landscape

The market forecasting report includes the adoption lifecycle of the market, covering from the innovator’s stage to the laggard’s stage. It focuses on adoption rates in different regions based on penetration. Furthermore, the market report also includes key purchase criteria and drivers of price sensitivity to help companies evaluate and develop their market growth analysis strategies.

LCD Glass Market Share by Geography

 Customer Landscape

Key Companies & Market Insights

Companies are implementing various strategies, such as strategic alliances, market forecast, partnerships, mergers and acquisitions, geographical expansion, and product/service launches, to enhance their presence in the industry.

AGC Inc. - The company offers LCD glass, which is produced using the float process that is suitable for production of low thermal shrinkage glass as the glass is cooled down gradually through a long annealing process.

The industry research and growth report includes detailed analyses of the competitive landscape of the market and information about key companies, including:

  • AvanStrate Inc.
  • Corning Inc.
  • Nippon Electric Glass Co. Ltd.

Qualitative and quantitative analysis of companies has been conducted to help clients understand the wider business environment as well as the strengths and weaknesses of key industry players. Data is qualitatively analyzed to categorize companies as pure play, category-focused, industry-focused, and diversified; it is quantitatively analyzed to categorize companies as dominant, leading, strong, tentative, and weak.

Research Analyst Overview

The market is currently witnessing significant advancements driven by the increasing demand for innovative solutions that cater to evolving consumer preferences. Eco-friendliness is becoming a crucial factor In the production of LCD glass, with manufacturers focusing on next-generation substrates and manufacturing techniques to reduce the environmental impact of their processes. Consumer preferences for sustainable and cost-effective products have led to the development of eco-friendly glass substrates. These substrates are not only beneficial for the environment but also offer improved visual experiences for end-users. The use of these substrates in various applications, including infotainment systems and in-flight entertainment systems, is gaining widespread acceptance.

Further, the integration of the Internet of Things (IoT) and remote work technologies has further fueled the growth of the market. Diagnostic equipment and wearable technology are some of the areas where LCD glass is being extensively used to provide real-time data and enhance user experiences. Advancements in materials and manufacturing processes continue to drive innovation In the market. Leading players are forming strategic partnerships to stay competitive and offer cost-effective solutions to their clients. The electronics and healthcare industries are some of the major sectors driving the demand for LCD glass. The present status of the market is characterized by a focus on sustainability and cost-effectiveness.

Market Scope

Report Coverage

Details

Page number

189

Base year

2024

Historic period

2019-2023

Forecast period

2025-2029

Growth momentum & CAGR

Accelerate at a CAGR of 5.2%

Market growth 2025-2029

USD 1.71 billion

Market structure

Concentrated

YoY growth 2024-2025(%)

5.0

Key countries

China, US, Taiwan, South Korea, Japan, Germany, France, Singapore, UK, and India

Competitive landscape

Leading Companies, Market Positioning of Companies, Competitive Strategies, and Industry Risks

Request Free Sample

What are the Key Data Covered in this Market Research and Growth Report?

  • CAGR of the LCD Glass industry during the forecast period
  • Detailed information on factors that will drive the market growth and forecasting between 2025 and 2029
  • Precise estimation of the size of the market and its contribution of the industry in focus to the parent market
  • Accurate predictions about upcoming growth and trends and changes in consumer behaviour
  • Growth of the market across APAC, North America, Europe, South America, and Middle East and Africa
  • Thorough analysis of the market’s competitive landscape and detailed information about companies
  • Comprehensive analysis of factors that will challenge the market growth of industry companies

We can help! Our analysts can customize this market research report to meet your requirements. 

Get in touch

1 Executive Summary

  • 1.1 Market overview
    • Executive Summary - Chart on Market Overview
    • Executive Summary - Data Table on Market Overview
    • Executive Summary - Chart on Global Market Characteristics
    • Executive Summary - Chart on Market by Geography
    • Executive Summary - Chart on Market Segmentation by Material
    • Executive Summary - Chart on Market Segmentation by Application
    • Executive Summary - Chart on Incremental Growth
    • Executive Summary - Data Table on Incremental Growth
    • Executive Summary - Chart on Company Market Positioning

2 Technavio Analysis

  • 2.1 Analysis of price sensitivity, lifecycle, customer purchase basket, adoption rates, and purchase criteria
    • Analysis of price sensitivity, lifecycle, customer purchase basket, adoption rates, and purchase criteria
  • 2.2 Criticality of inputs and Factors of differentiation
    • Overview on criticality of inputs and factors of differentiation
  • 2.3 Factors of disruption
    • Overview on factors of disruption
  • 2.4 Impact of drivers and challenges
    • Impact of drivers and challenges in 2024 and 2029

3 Market Landscape

  • 3.1 Market ecosystem
    • Parent Market
    • Data Table on - Parent Market
  • 3.2 Market characteristics
    • Market characteristics analysis
  • 3.3 Value chain analysis
    • Value chain analysis

4 Market Sizing

  • 4.1 Market definition
    • Offerings of companies included in the market definition
  • 4.2 Market segment analysis
    • Market segments
  • 4.3 Market size 2024
    • 4.4 Market outlook: Forecast for 2024-2029
      • Chart on Global - Market size and forecast 2024-2029 ($ million)
      • Data Table on Global - Market size and forecast 2024-2029 ($ million)
      • Chart on Global Market: Year-over-year growth 2024-2029 (%)
      • Data Table on Global Market: Year-over-year growth 2024-2029 (%)

    5 Historic Market Size

    • 5.1 Global LCD Glass Market 2019 - 2023
      • Historic Market Size - Data Table on Global LCD Glass Market 2019 - 2023 ($ million)
    • 5.2 Material segment analysis 2019 - 2023
      • Historic Market Size - Material Segment 2019 - 2023 ($ million)
    • 5.3 Application segment analysis 2019 - 2023
      • Historic Market Size - Application Segment 2019 - 2023 ($ million)
    • 5.4 Geography segment analysis 2019 - 2023
      • Historic Market Size - Geography Segment 2019 - 2023 ($ million)
    • 5.5 Country segment analysis 2019 - 2023
      • Historic Market Size - Country Segment 2019 - 2023 ($ million)

    6 Qualitative Analysis

    • 6.1 Impact of AI on Global LCD Glass Market

      7 Five Forces Analysis

      • 7.1 Five forces summary
        • Five forces analysis - Comparison between 2024 and 2029
      • 7.2 Bargaining power of buyers
        • Bargaining power of buyers - Impact of key factors 2024 and 2029
      • 7.3 Bargaining power of suppliers
        • Bargaining power of suppliers - Impact of key factors in 2024 and 2029
      • 7.4 Threat of new entrants
        • Threat of new entrants - Impact of key factors in 2024 and 2029
      • 7.5 Threat of substitutes
        • Threat of substitutes - Impact of key factors in 2024 and 2029
      • 7.6 Threat of rivalry
        • Threat of rivalry - Impact of key factors in 2024 and 2029
      • 7.7 Market condition
        • Chart on Market condition - Five forces 2024 and 2029

      8 Market Segmentation by Material

      • 8.1 Market segments
        • Chart on Material - Market share 2024-2029 (%)
        • Data Table on Material - Market share 2024-2029 (%)
      • 8.2 Comparison by Material
        • Chart on Comparison by Material
        • Data Table on Comparison by Material
      • 8.3 Soda lime - Market size and forecast 2024-2029
        • Chart on Soda lime - Market size and forecast 2024-2029 ($ million)
        • Data Table on Soda lime - Market size and forecast 2024-2029 ($ million)
        • Chart on Soda lime - Year-over-year growth 2024-2029 (%)
        • Data Table on Soda lime - Year-over-year growth 2024-2029 (%)
      • 8.4 Borosilicate - Market size and forecast 2024-2029
        • Chart on Borosilicate - Market size and forecast 2024-2029 ($ million)
        • Data Table on Borosilicate - Market size and forecast 2024-2029 ($ million)
        • Chart on Borosilicate - Year-over-year growth 2024-2029 (%)
        • Data Table on Borosilicate - Year-over-year growth 2024-2029 (%)
      • 8.5 Aluminosilicate - Market size and forecast 2024-2029
        • Chart on Aluminosilicate - Market size and forecast 2024-2029 ($ million)
        • Data Table on Aluminosilicate - Market size and forecast 2024-2029 ($ million)
        • Chart on Aluminosilicate - Year-over-year growth 2024-2029 (%)
        • Data Table on Aluminosilicate - Year-over-year growth 2024-2029 (%)
      • 8.6 Market opportunity by Material
        • Market opportunity by Material ($ million)
        • Data Table on Market opportunity by Material ($ million)

      9 Market Segmentation by Application

      • 9.1 Market segments
        • Chart on Application - Market share 2024-2029 (%)
        • Data Table on Application - Market share 2024-2029 (%)
      • 9.2 Comparison by Application
        • Chart on Comparison by Application
        • Data Table on Comparison by Application
      • 9.3 LCD TVs - Market size and forecast 2024-2029
        • Chart on LCD TVs - Market size and forecast 2024-2029 ($ million)
        • Data Table on LCD TVs - Market size and forecast 2024-2029 ($ million)
        • Chart on LCD TVs - Year-over-year growth 2024-2029 (%)
        • Data Table on LCD TVs - Year-over-year growth 2024-2029 (%)
      • 9.4 Desktop monitors - Market size and forecast 2024-2029
        • Chart on Desktop monitors - Market size and forecast 2024-2029 ($ million)
        • Data Table on Desktop monitors - Market size and forecast 2024-2029 ($ million)
        • Chart on Desktop monitors - Year-over-year growth 2024-2029 (%)
        • Data Table on Desktop monitors - Year-over-year growth 2024-2029 (%)
      • 9.5 Notebook PCs - Market size and forecast 2024-2029
        • Chart on Notebook PCs - Market size and forecast 2024-2029 ($ million)
        • Data Table on Notebook PCs - Market size and forecast 2024-2029 ($ million)
        • Chart on Notebook PCs - Year-over-year growth 2024-2029 (%)
        • Data Table on Notebook PCs - Year-over-year growth 2024-2029 (%)
      • 9.6 Smartphones and tablets - Market size and forecast 2024-2029
        • Chart on Smartphones and tablets - Market size and forecast 2024-2029 ($ million)
        • Data Table on Smartphones and tablets - Market size and forecast 2024-2029 ($ million)
        • Chart on Smartphones and tablets - Year-over-year growth 2024-2029 (%)
        • Data Table on Smartphones and tablets - Year-over-year growth 2024-2029 (%)
      • 9.7 Others - Market size and forecast 2024-2029
        • Chart on Others - Market size and forecast 2024-2029 ($ million)
        • Data Table on Others - Market size and forecast 2024-2029 ($ million)
        • Chart on Others - Year-over-year growth 2024-2029 (%)
        • Data Table on Others - Year-over-year growth 2024-2029 (%)
      • 9.8 Market opportunity by Application
        • Market opportunity by Application ($ million)
        • Data Table on Market opportunity by Application ($ million)

      10 Customer Landscape

      • 10.1 Customer landscape overview
        • Analysis of price sensitivity, lifecycle, customer purchase basket, adoption rates, and purchase criteria

      11 Geographic Landscape

      • 11.1 Geographic segmentation
        • Chart on Market share by geography 2024-2029 (%)
        • Data Table on Market share by geography 2024-2029 (%)
      • 11.2 Geographic comparison
        • Chart on Geographic comparison
        • Data Table on Geographic comparison
      • 11.3 APAC - Market size and forecast 2024-2029
        • Chart on APAC - Market size and forecast 2024-2029 ($ million)
        • Data Table on APAC - Market size and forecast 2024-2029 ($ million)
        • Chart on APAC - Year-over-year growth 2024-2029 (%)
        • Data Table on APAC - Year-over-year growth 2024-2029 (%)
      • 11.4 North America - Market size and forecast 2024-2029
        • Chart on North America - Market size and forecast 2024-2029 ($ million)
        • Data Table on North America - Market size and forecast 2024-2029 ($ million)
        • Chart on North America - Year-over-year growth 2024-2029 (%)
        • Data Table on North America - Year-over-year growth 2024-2029 (%)
      • 11.5 Europe - Market size and forecast 2024-2029
        • Chart on Europe - Market size and forecast 2024-2029 ($ million)
        • Data Table on Europe - Market size and forecast 2024-2029 ($ million)
        • Chart on Europe - Year-over-year growth 2024-2029 (%)
        • Data Table on Europe - Year-over-year growth 2024-2029 (%)
      • 11.6 South America - Market size and forecast 2024-2029
        • Chart on South America - Market size and forecast 2024-2029 ($ million)
        • Data Table on South America - Market size and forecast 2024-2029 ($ million)
        • Chart on South America - Year-over-year growth 2024-2029 (%)
        • Data Table on South America - Year-over-year growth 2024-2029 (%)
      • 11.7 Middle East and Africa - Market size and forecast 2024-2029
        • Chart on Middle East and Africa - Market size and forecast 2024-2029 ($ million)
        • Data Table on Middle East and Africa - Market size and forecast 2024-2029 ($ million)
        • Chart on Middle East and Africa - Year-over-year growth 2024-2029 (%)
        • Data Table on Middle East and Africa - Year-over-year growth 2024-2029 (%)
      • 11.8 China - Market size and forecast 2024-2029
        • Chart on China - Market size and forecast 2024-2029 ($ million)
        • Data Table on China - Market size and forecast 2024-2029 ($ million)
        • Chart on China - Year-over-year growth 2024-2029 (%)
        • Data Table on China - Year-over-year growth 2024-2029 (%)
      • 11.9 US - Market size and forecast 2024-2029
        • Chart on US - Market size and forecast 2024-2029 ($ million)
        • Data Table on US - Market size and forecast 2024-2029 ($ million)
        • Chart on US - Year-over-year growth 2024-2029 (%)
        • Data Table on US - Year-over-year growth 2024-2029 (%)
      • 11.10 Taiwan - Market size and forecast 2024-2029
        • Chart on Taiwan - Market size and forecast 2024-2029 ($ million)
        • Data Table on Taiwan - Market size and forecast 2024-2029 ($ million)
        • Chart on Taiwan - Year-over-year growth 2024-2029 (%)
        • Data Table on Taiwan - Year-over-year growth 2024-2029 (%)
      • 11.11 South Korea - Market size and forecast 2024-2029
        • Chart on South Korea - Market size and forecast 2024-2029 ($ million)
        • Data Table on South Korea - Market size and forecast 2024-2029 ($ million)
        • Chart on South Korea - Year-over-year growth 2024-2029 (%)
        • Data Table on South Korea - Year-over-year growth 2024-2029 (%)
      • 11.12 Japan - Market size and forecast 2024-2029
        • Chart on Japan - Market size and forecast 2024-2029 ($ million)
        • Data Table on Japan - Market size and forecast 2024-2029 ($ million)
        • Chart on Japan - Year-over-year growth 2024-2029 (%)
        • Data Table on Japan - Year-over-year growth 2024-2029 (%)
      • 11.13 Germany - Market size and forecast 2024-2029
        • Chart on Germany - Market size and forecast 2024-2029 ($ million)
        • Data Table on Germany - Market size and forecast 2024-2029 ($ million)
        • Chart on Germany - Year-over-year growth 2024-2029 (%)
        • Data Table on Germany - Year-over-year growth 2024-2029 (%)
      • 11.14 France - Market size and forecast 2024-2029
        • Chart on France - Market size and forecast 2024-2029 ($ million)
        • Data Table on France - Market size and forecast 2024-2029 ($ million)
        • Chart on France - Year-over-year growth 2024-2029 (%)
        • Data Table on France - Year-over-year growth 2024-2029 (%)
      • 11.15 Singapore - Market size and forecast 2024-2029
        • Chart on Singapore - Market size and forecast 2024-2029 ($ million)
        • Data Table on Singapore - Market size and forecast 2024-2029 ($ million)
        • Chart on Singapore - Year-over-year growth 2024-2029 (%)
        • Data Table on Singapore - Year-over-year growth 2024-2029 (%)
      • 11.16 UK - Market size and forecast 2024-2029
        • Chart on UK - Market size and forecast 2024-2029 ($ million)
        • Data Table on UK - Market size and forecast 2024-2029 ($ million)
        • Chart on UK - Year-over-year growth 2024-2029 (%)
        • Data Table on UK - Year-over-year growth 2024-2029 (%)
      • 11.17 India - Market size and forecast 2024-2029
        • Chart on India - Market size and forecast 2024-2029 ($ million)
        • Data Table on India - Market size and forecast 2024-2029 ($ million)
        • Chart on India - Year-over-year growth 2024-2029 (%)
        • Data Table on India - Year-over-year growth 2024-2029 (%)
      • 11.18 Market opportunity by geography
        • Market opportunity by geography ($ million)
        • Data Tables on Market opportunity by geography ($ million)

      12 Drivers, Challenges, and Opportunity/Restraints

      • 12.1 Market drivers
        • 12.2 Market challenges
          • 12.3 Impact of drivers and challenges
            • Impact of drivers and challenges in 2024 and 2029
          • 12.4 Market opportunities/restraints

            13 Competitive Landscape

            • 13.1 Overview
              • 13.2 Competitive Landscape
                • Overview on criticality of inputs and factors of differentiation
              • 13.3 Landscape disruption
                • Overview on factors of disruption
              • 13.4 Industry risks
                • Impact of key risks on business

              14 Competitive Analysis

              • 14.1 Companies profiled
                • Companies covered
              • 14.2 Company ranking index
                • Company ranking index
              • 14.3 Market positioning of companies
                • Matrix on companies position and classification
              • 14.4 AGC Inc.
                • AGC Inc. - Overview
                • AGC Inc. - Business segments
                • AGC Inc. - Key news
                • AGC Inc. - Key offerings
                • AGC Inc. - Segment focus
                • SWOT
              • 14.5 AvanStrate Inc.
                • AvanStrate Inc. - Overview
                • AvanStrate Inc. - Product / Service
                • AvanStrate Inc. - Key offerings
                • SWOT
              • 14.6 Corning Inc.
                • Corning Inc. - Overview
                • Corning Inc. - Business segments
                • Corning Inc. - Key news
                • Corning Inc. - Key offerings
                • Corning Inc. - Segment focus
                • SWOT
              • 14.7 Nippon Electric Glass Co. Ltd.
                • Nippon Electric Glass Co. Ltd. - Overview
                • Nippon Electric Glass Co. Ltd. - Product / Service
                • Nippon Electric Glass Co. Ltd. - Key offerings
                • SWOT

              15 Appendix

              • 15.1 Scope of the report
                • 15.2 Inclusions and exclusions checklist
                  • Inclusions checklist
                  • Exclusions checklist
                • 15.3 Currency conversion rates for US$
                  • Currency conversion rates for US$
                • 15.4 Research methodology
                  • Research methodology
                • 15.5 Data procurement
                  • Information sources
                • 15.6 Data validation
                  • Data validation
                • 15.7 Validation techniques employed for market sizing
                  • Validation techniques employed for market sizing
                • 15.8 Data synthesis
                  • Data synthesis
                • 15.9 360 degree market analysis
                  • 360 degree market analysis
                • 15.10 List of abbreviations
                  • List of abbreviations

                Research Methodology

                Technavio presents a detailed picture of the market by way of study, synthesis, and summation of data from multiple sources. The analysts have presented the various facets of the market with a particular focus on identifying the key industry influencers. The data thus presented is comprehensive, reliable, and the result of extensive research, both primary and secondary.

                INFORMATION SOURCES

                Primary sources

                • Manufacturers and suppliers
                • Channel partners
                • Industry experts
                • Strategic decision makers

                Secondary sources

                • Industry journals and periodicals
                • Government data
                • Financial reports of key industry players
                • Historical data
                • Press releases

                DATA ANALYSIS

                Data Synthesis

                • Collation of data
                • Estimation of key figures
                • Analysis of derived insights

                Data Validation

                • Triangulation with data models
                • Reference against proprietary databases
                • Corroboration with industry experts

                REPORT WRITING

                Qualitative

                • Market drivers
                • Market challenges
                • Market trends
                • Five forces analysis

                Quantitative

                • Market size and forecast
                • Market segmentation
                • Geographical insights
                • Competitive landscape

                Interested in this report?

                Get your sample now to see our research methodology and insights!

                Download Now

                Frequently Asked Questions

                Lcd Glass market growth will increase by $ 1706.6 mn during 2025-2029 .

                The Lcd Glass market is expected to grow at a CAGR of 5.2% during 2025-2029 .

                Lcd Glass market is segmented by Material( Soda lime, Borosilicate, Aluminosilicate) Application( LCD TVs, Desktop monitors, Notebook PCs, Smartphones and tablets, Others)

                AGC Inc., AvanStrate Inc., Corning Inc., Nippon Electric Glass Co. Ltd. are a few of the key vendors in the Lcd Glass market.

                APAC will register the highest growth rate of 77% among the other regions. Therefore, the Lcd Glass market in APAC is expected to garner significant business opportunities for the vendors during the forecast period.

                China, US, Taiwan, South Korea, Japan, Germany, France, Singapore, UK, India

                • Growing demand for consumer electronicsThe global LCD glass market is experiencing robust growth is the driving factor this market.
                • primarily driven by the increasing demand for consumer electronics such as smartphones is the driving factor this market.
                • tablets is the driving factor this market.
                • laptops is the driving factor this market.
                • televisions is the driving factor this market.
                • and smart wearables. As display technologies advance is the driving factor this market.
                • manufacturers are focusing on developing high-resolution is the driving factor this market.
                • energy-efficient is the driving factor this market.
                • and ultra-thin glass solutions to meet consumer preferences for enhanced visual experiences and sleek designs. The rising adoption of 4K and 8K resolution displays is the driving factor this market.
                • OLED and mini-LED technologies is the driving factor this market.
                • and touchscreen interfaces in both personal and professional devices is further accelerating the demand for advanced LCD glass.The global electronics industry is the driving factor this market.
                • which was valued at 4.3 trillion in 2023 is the driving factor this market.
                • is dominated by China is the driving factor this market.
                • which holds a 60% share. Over the past decade is the driving factor this market.
                • Vietnam has emerged as the fastest-growing player in electronics manufacturing is the driving factor this market.
                • while production in India has also surged is the driving factor this market.
                • largely driven by mobile phones is the driving factor this market.
                • which account for 43% of the total electronics output of the country. Other key nations shaping the electronics sector include Taiwan is the driving factor this market.
                • the US is the driving factor this market.
                • South Korea is the driving factor this market.
                • Vietnam is the driving factor this market.
                • and Malaysia. This rapid expansion of electronics manufacturing hubs is directly influencing the global LCD glass market is the driving factor this market.
                • as high-quality display panels are essential components of consumer electronics.The smartphone industry is the driving factor this market.
                • in particular is the driving factor this market.
                • is a major consumer of LCD glass. Leading brands are launching foldable is the driving factor this market.
                • edge-to-edge is the driving factor this market.
                • and high-refresh-rate displays is the driving factor this market.
                • driving the demand for durable is the driving factor this market.
                • ultra-thin is the driving factor this market.
                • and flexible LCD glass. The adoption of 5G technology is the driving factor this market.
                • coupled with rising disposable incomes and digital transformation is the driving factor this market.
                • is propelling smartphone sales is the driving factor this market.
                • further increasing the need for advanced display glass solutions. Similarly is the driving factor this market.
                • the television segment is witnessing a shift towards larger is the driving factor this market.
                • higher-resolution screens is the driving factor this market.
                • which require high-performance is the driving factor this market.
                • lightweight LCD glass to enhance durability and viewing quality. Additionally is the driving factor this market.
                • the growing popularity of laptops is the driving factor this market.
                • tablets is the driving factor this market.
                • and smartwatches is strengthening the global LCD glass market. The expansion of remote work is the driving factor this market.
                • online learning is the driving factor this market.
                • and gaming industries has intensified the need for high brightness is the driving factor this market.
                • low power consumption is the driving factor this market.
                • and high-refresh-rate displays. Manufacturers are investing in next-generation glass technologies is the driving factor this market.
                • including anti-reflective coatings is the driving factor this market.
                • scratch-resistant surfaces is the driving factor this market.
                • and thinner is the driving factor this market.
                • more flexible glass substrates is the driving factor this market.
                • to meet evolving consumer demands.In summary is the driving factor this market.
                • the expanding consumer electronics industry is the driving factor this market.
                • technological advancements in display panels is the driving factor this market.
                • and the growth of key manufacturing hubs like China is the driving factor this market.
                • Vietnam is the driving factor this market.
                • and India are collectively driving the global LCD glass market. As innovation continues is the driving factor this market.
                • the demand for high-quality is the driving factor this market.
                • durable is the driving factor this market.
                • and energy-efficient LCD glass solutions is expected to rise is the driving factor this market.
                • shaping the future of next-generation consumer displays. is the driving factor this market.

                The Lcd Glass market vendors should focus on grabbing business opportunities from the Soda lime segment as it accounted for the largest market share in the base year.