LED Phosphors Market Size 2025-2029
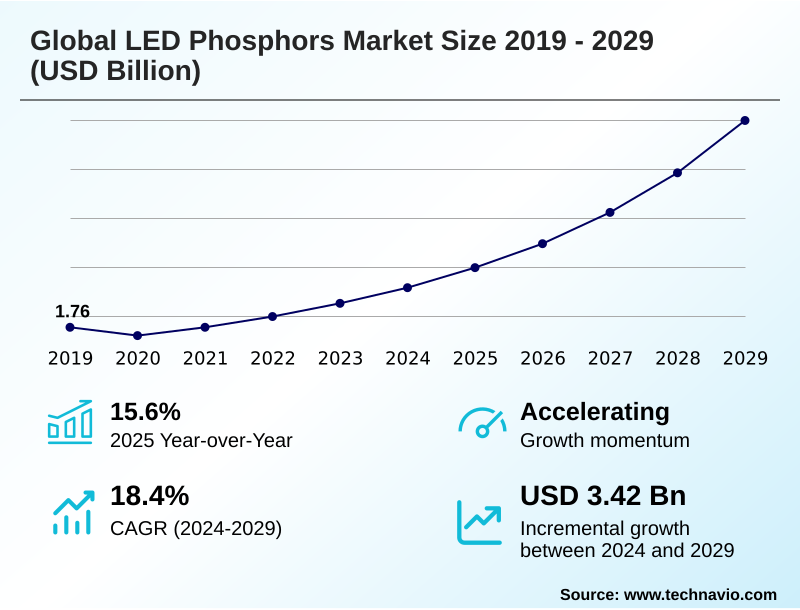
The led phosphors market size is forecast to increase by USD 3.4 billion, at a CAGR of 18.4% between 2024 and 2029.
The adoption of advanced LED technology in the automotive industry is a primary market driver. This is particularly evident in high-end vehicles, where LEDs are displacing traditional halogen and HID lamps in applications such as automotive LED headlamps market. Developments in laser-diode-based white-light sources, which combine blue laser emission with a phosphor converter layer, are pushing performance boundaries. Concurrently, the development of new phosphor materials, a key trend, is enabling better colorization and superior energy efficiency. Researchers are focused on creating materials with higher stability and lower manufacturing costs to meet the stringent demands of the automotive sector and other high-performance applications like the micro light-emitting diode (LED) market.A significant challenge facing the industry is the slowdown in the global automotive sector, which could negatively impact demand for LED phosphors. Economic uncertainties and supply chain disruptions affecting vehicle production directly translate to reduced demand for automotive lighting solutions. This downturn may also lead to cuts in research and development budgets, hindering advancements in phosphor technologies essential for improving lighting efficiency. This situation highlights the industry's dependence on the automotive market's health and underscores the need for continuous innovation in areas like the industrial and commercial led lighting and led encapsulation market to mitigate risks and explore new growth avenues.
What will be the Size of the LED Phosphors Market during the forecast period?

Explore in-depth regional segment analysis with market size data - historical 2019 - 2023 and forecasts 2025-2029 - in the full report.
Request Free Sample
The market is characterized by continuous innovation in photoluminescent material science, with a focus on enhancing quantum efficiency and thermal stability. The development of advanced phosphor compositions, including narrow-band red-emitting phosphors and specialized silicate phosphors, is enabling breakthroughs in the industrial and commercial led lighting sector. These materials are critical for achieving a high color rendering index and specific correlated color temperatures, meeting the sophisticated demands of human-centric lighting and high-quality display backlighting units in the organic light-emitting diode market. This pursuit of material excellence is fundamental to the industry's evolution.Application-driven diversification is another key dynamic shaping the market's trajectory. While general illumination remains a core segment, there is a notable shift toward specialized, high-value applications that require tailored spectral properties. The automotive led lighting market, for instance, demands robust phosphors capable of withstanding extreme temperatures and delivering high lumen density. Similarly, the growing field of horticultural lighting requires specific phosphor blends to create light spectra that optimize plant growth. This move toward specialization is transforming the competitive landscape from a focus on volume to a focus on performance and innovation.
How is this LED Phosphors Industry segmented?
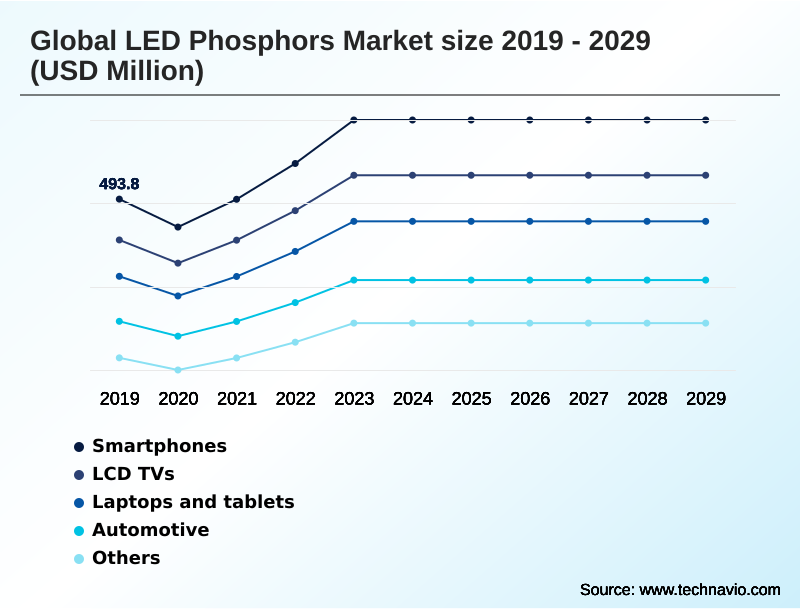
The led phosphors industry research report provides comprehensive data (region-wise segment analysis), with forecasts and estimates in "USD million" for the period 2025-2029, as well as historical data from 2019 - 2023 for the following segments.
- Application
- Smartphones
- LCD TVs
- Laptops and tablets
- Automotive
- Others
- Type
- YAG phosphors
- Silicate phosphors
- Nitride phosphors
- End-user
- Residential
- Commercial
- Industrial
- Geography
- APAC
- China
- Japan
- South Korea
- India
- Taiwan
- Vietnam
- Europe
- Germany
- UK
- France
- Italy
- The Netherlands
- Spain
- North America
- South America
- Middle East and Africa
- Rest of World (ROW)
By Application Insights
The smartphones segment is estimated to witness significant growth during the forecast period.
LED technology has become a leading choice for smartphone displays, with phosphorescent OLEDs (PHOLEDS) seeing increased use in high-end devices. These displays leverage phosphorescent materials to achieve significantly higher efficiency compared to standard fluorescent OLEDs. The demand for red and green PHOLEDs is particularly strong, as they offer longer lifespans, which is a critical factor for consumer electronics. Continuous innovation in blue phosphorescent materials remains a key focus to improve overall display longevity and color accuracy.
While PHOLED technology offers superior efficiency, challenges related to the differential aging of colored pixels can affect image quality over time. This dynamic has spurred research into hybrid display solutions and new advanced phosphor compositions to ensure consistent performance. The global demand for these advanced materials is widespread, with even emerging regions that represent over 7.28% of the market's geographic opportunity contributing to the consumption patterns for high-end consumer electronics, driving further innovation in display technology materials.

Request Free Sample
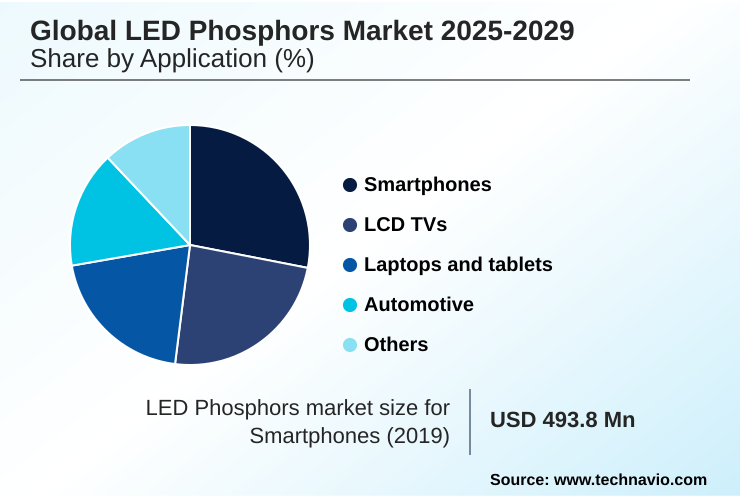
The Smartphones segment was valued at USD 493.80 million in 2019 and showed a gradual increase during the forecast period.

Regional Analysis
APAC is estimated to contribute 49.7% to the growth of the global market during the forecast period.Technavio’s analysts have elaborately explained the regional trends and drivers that shape the market during the forecast period.
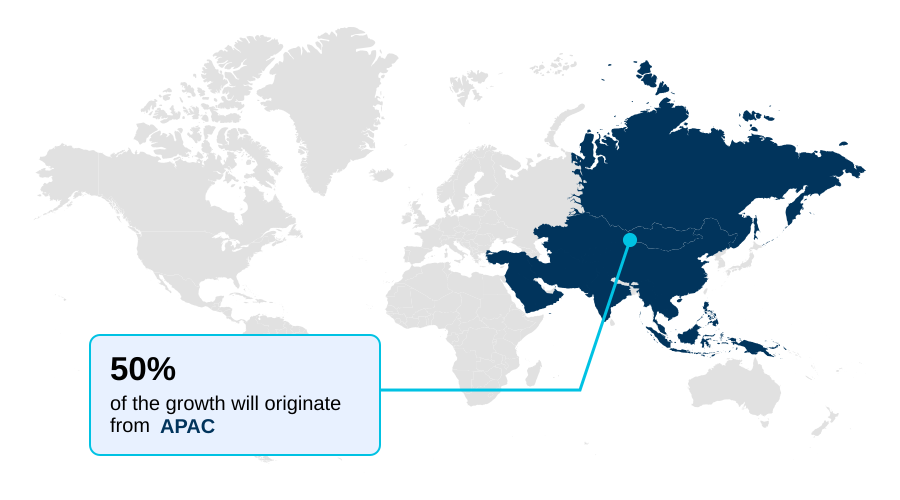
Request Free Sample
The APAC region stands as the central hub for the global LED phosphors market, functioning as both the largest producer and consumer of these critical materials. This dominance is anchored by the immense manufacturing ecosystems in countries like China, which lead the entire LED supply chain from chip fabrication to final product assembly. The market in APAC is characterized by large-scale production, driven by strong government support for the electronics and solid-state lighting industries. High consumer demand for electronics like smartphones and LCD TVs further fuels the need for a wide range of phosphors.
Growth in the APAC market is propelled by favorable government policies, such as India's 'Make in India' initiative, and the region's status as a global manufacturing powerhouse. The continuous investment in research and development, coupled with the high penetration of consumer electronics, ensures sustained demand for both commodity and high-performance phosphor materials. The region's significance is highlighted by the fact that APAC is expected to contribute approximately 49.7% of the market's overall incremental growth, underscoring its pivotal role in the industry's future.
Market Dynamics
Our researchers analyzed the data with 2024 as the base year, along with the key drivers, trends, and challenges. A holistic analysis of drivers will help companies refine their marketing strategies to gain a competitive advantage.
The global LED phosphors market is driven by continuous innovation in photoluminescent materials for solid-state lighting. Core technologies, such as the widely used YAG phosphor for blue LED conversion and the application of silicate phosphors for general lighting, remain fundamental. However, the demand for enhanced performance has intensified research into nitride phosphors in high-power LEDs, which offer superior durability. A key focus for manufacturers and original equipment manufacturers (OEMS) is improving quantum efficiency of phosphors and improving luminous efficacy in PC-LEDs. Concurrently, significant efforts are dedicated to enhancing the thermal stability of phosphor materials and reducing thermal quenching in phosphors to ensure reliability. The efficient use of rare earth elements in phosphor synthesis is also critical for maintaining supply chain stability and managing production costs.Growth in specialized sectors is creating new opportunities, with stringent phosphor requirements for horticultural lighting and the development of specific phosphor materials for automotive headlights. The pursuit of superior visual quality drives high CRI white LED development and the creation of narrow-band red emitting phosphors to enrich color gamuts. This trend extends to consumer electronics, where high-purity phosphors for backlighting and advanced materials for micro-LED displays are in high demand. Furthermore, the market is adapting to wellness trends with human-centric lighting phosphor solutions. Key strategic initiatives include ensuring color stability in LED packages and exploring phosphor integration for cost reduction. Simultaneously, the industry is addressing environmental regulations by developing cadmium-free phosphor alternatives and evaluating the potential of quantum dot substitute for LED phosphors as a next-generation technology.

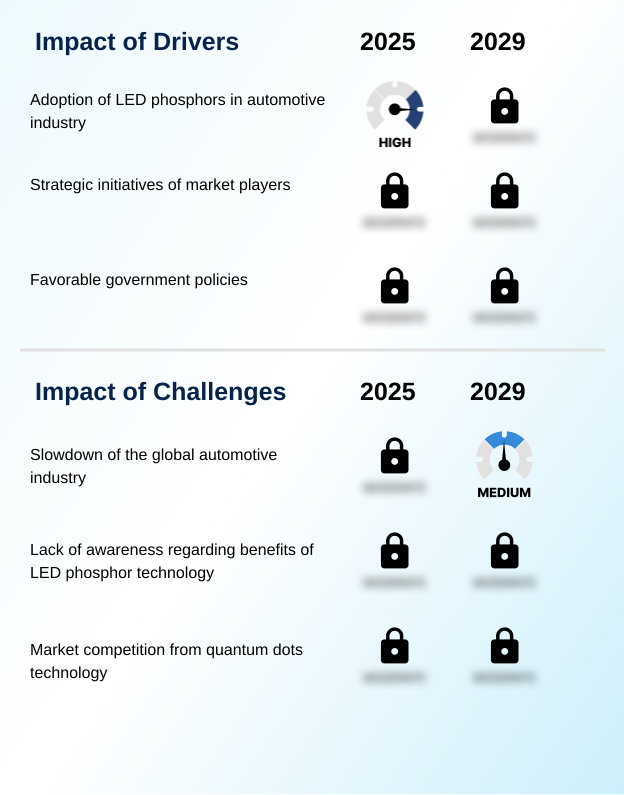
What are the key market drivers leading to the rise in the adoption of LED Phosphors Industry?
- The increasing adoption of LED phosphors within the automotive industry is a significant factor driving market expansion.
The increasing integration of LED technology in the automotive sector is a significant driver for the market. Commercially, LEDs are supplanting traditional light sources in headlights and other vehicle lighting systems. Recent advancements include laser-diode-based white-light sources, where a blue laser emission combines with a phosphor yellow emission to create white light. The development of thermally stable phosphor materials, such as those embedded in ceramics rather than silicone, is crucial for withstanding the extreme temperatures in automotive environments. This focus on high-performance photoluminescent material ensures high lumen density and reliability, supporting the industry's shift toward more efficient and durable solid-state lighting. A significant portion of the incremental market growth, approximately 49.7%, is expected to originate from key manufacturing regions catering to this demand.Strategic initiatives undertaken by market participants are vital for sustaining growth and competitive advantage. These efforts are centered on significant investment in research and development to discover and commercialize new phosphor materials. The goal is to achieve better quantum efficiencies and lumen equivalent ratios, leading to enhanced LED performance. Companies focus on developing proprietary phosphor compositions and integration technologies that can reduce manufacturing costs, maximize production yields, and meet the stringent requirements of end-use industries like consumer electronics. Such strategies enable vendors to differentiate their offerings and capture share in a market where innovation in color rendering index and thermal stability directly translates to commercial success.
What are the market trends shaping the LED Phosphors Industry?
- The ongoing development of new and advanced LED phosphor materials is a key upcoming trend shaping the market.
The continuous development of new LED phosphor materials is a pivotal trend, as the industry evolves to meet demands for better colorization and improved energy efficiency. Vendors are focused on creating materials that satisfy stringent purity and moisture protection requirements for high-value applications like the automotive led lighting market. Recent advancements in red phosphor materials have led to warm white LEDs with superior color rendering index (CRI) values. The pursuit of next-generation materials, such as narrow-band red-emitting phosphors, is enabling significant gains in LED efficacy. For example, certain new materials offer an increased luminous efficacy of 14% compared to standard high-CRI LEDs, driving their adoption in premium lighting and display products like the organic light-emitting diode market.A rising preference for LED lighting technologies over conventional systems is fundamentally reshaping the illumination market. This shift is driven by the superior energy efficiency, longer operational lifespan, and enhanced performance of solid-state lighting. The development of advanced phosphor compositions has played a key role, enabling LEDs to replicate the warm, appealing light of incandescent bulbs while offering greater control over color temperature and quality. As a result, white LEDs are increasingly preferred over halogen and incandescent sources in residential, commercial, and industrial settings. Europe, a region with strong regulatory support for energy efficiency, represents a significant portion of the global opportunity, accounting for over 20.09% of the potential market.
What challenges does the LED Phosphors Industry face during its growth?
- A slowdown in the global automotive industry presents a significant challenge to market growth.
A slowdown in the global automotive industry presents a significant challenge to the market. This downturn, driven by economic uncertainties and supply chain disruptions, directly reduces demand for automotive lighting solutions that utilize LED phosphors. As vehicle production declines, the need for components like phosphor converter layers and high-stability ceramic materials also wanes. Furthermore, the industry's shift towards electric vehicles introduces additional complexity, as manufacturers may prioritize different technologies, potentially limiting investment in new phosphor innovations. This can hinder advancements in luminous efficacy and thermal stability crucial for next-generation automotive lighting. Key automotive manufacturing regions, which represent over 12.36% of the market opportunity, may experience a more pronounced impact.A lack of awareness regarding the benefits of advanced LED phosphor technology poses a notable challenge, particularly in markets where purchasing decisions are highly price-sensitive. While high-performance phosphors offer significant advantages in terms of energy efficiency, color quality (CRI), and long-term stability, their higher initial cost can deter adoption. End-users may not fully recognize the long-term total cost of ownership benefits, including reduced energy consumption and lower maintenance requirements. This is especially true in regions where the transition to solid-state lighting is still in its early stages. In some developing markets, which constitute over 10.59% of global opportunity, educating stakeholders on the performance and value of superior photoluminescent material is essential for driving broader acceptance.
Exclusive Customer Landscape
The led phosphors market forecasting report includes the adoption lifecycle of the market, covering from the innovator’s stage to the laggard’s stage. It focuses on adoption rates in different regions based on penetration. Furthermore, the led phosphors market report also includes key purchase criteria and drivers of price sensitivity to help companies evaluate and develop their market growth analysis strategies.
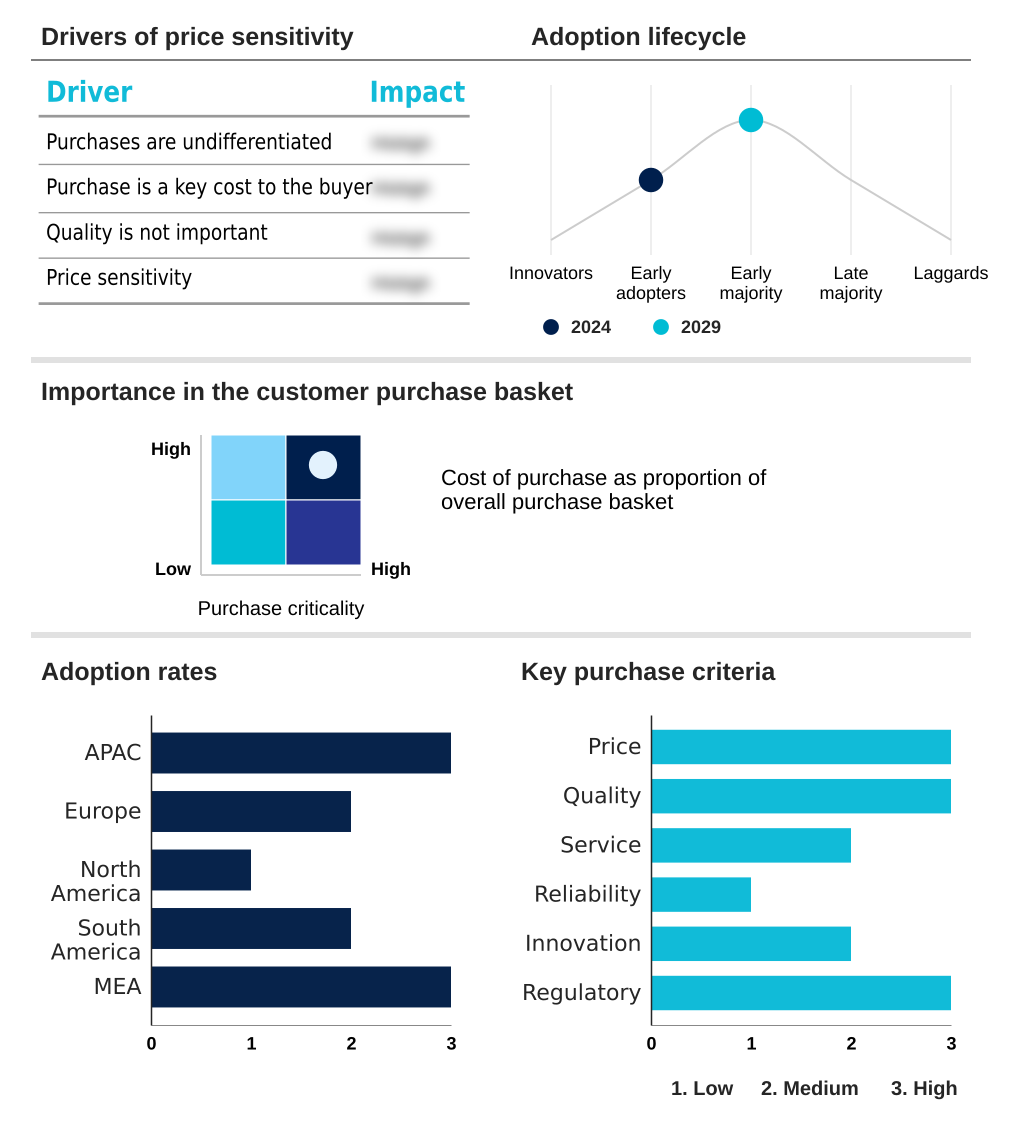
Customer Landscape
Key Companies & Market Insights
Companies are implementing various strategies, such as strategic alliances, led phosphors market forecast, partnerships, mergers and acquisitions, geographical expansion, and product/service launches, to enhance their presence in the industry.
Bridgelux Inc. - The company provides a comprehensive portfolio of phosphor-based solutions designed for advanced lighting systems. Offerings include tunable white arrays using chip-scale package (CSP) and phosphor-dispensed technologies, along with linear boards and dim-to-warm arrays built on surface-mount device (SMD) platforms, catering to a wide range of illumination applications.
The industry research and growth report includes detailed analyses of the competitive landscape of the market and information about key companies, including:
- Bridgelux Inc.
- Citizen Watch Co. Ltd.
- Denka Co. Ltd.
- EPISTAR Corp
- Everlight Electronics Co. Ltd.
- Intematix Corp.
- Lumileds Holding BV
- Materion Corp.
- Merck KGaA
- Mitsubishi Chemical Corp.
- Nichia Corp.
- OSRAM GmbH
- Phosphortech Corp.
- Seoul Semiconductor Co. Ltd.
- SMART Global Holdings Inc.
- Yantai Tongli High tech New Materials Co. Ltd.
- Yuji International Co. Ltd.
Qualitative and quantitative analysis of companies has been conducted to help clients understand the wider business environment as well as the strengths and weaknesses of key industry players. Data is qualitatively analyzed to categorize companies as pure play, category-focused, industry-focused, and diversified; it is quantitatively analyzed to categorize companies as dominant, leading, strong, tentative, and weak.
Recent Development and News in Led Phosphors Market
In February 2024, ams OSRAM launched its OSLON Submount PL family of LEDs, designed for automotive forward lighting, which leverages advanced phosphor conversion technology to meet performance requirements.In January 2024, Lumileds introduced its LUXEON 3030 HE Plus Deep Dimming LEDs, which offer high efficacy and smooth dimming performance for architectural and hospitality lighting, enabled by specialized phosphor formulations.In January 2024, Nichia Corp. announced the NVSW719AC-D5, a high-power 7.0x7.0mm LED designed to deliver high luminous flux and efficacy for applications such as street lights and stadium lighting, utilizing the company's proprietary phosphor technology.
Research Analyst Overview
The evolution of solid-state lighting is closely tied to advancements in photoluminescent material science. The down-conversion process in LEDs, initiated by blue light excitation from indium gallium nitride or gallium nitride chips, relies heavily on the phosphor converter layer. Traditionally, yag phosphors, specifically yttrium aluminum garnet, have been instrumental in producing phosphor yellow emission to create white light. However, the market is witnessing a continuous adaptation with the integration of silicate phosphors and nitride phosphors to enhance performance metrics. These materials directly influence the luminous efficacy, quantum efficiency, color rendering index, and the correlated color temperature of lighting products. The use of rare earth elements remains a critical factor in the composition and performance of these phosphors, impacting everything from general illumination to specialized lighting applications.Innovations are continuously reshaping the composition of the phosphor converter layer to meet demands for superior performance. There is an increasing adoption of advanced red phosphor materials, including narrow-band red phosphors and potassium fluorosilicate, to achieve higher fidelity in human-centric lighting. These developments improve thermal stability and lumen density, which are critical for high-intensity lighting in commercial lighting and industrial lighting. The industry, which is seeing an expansion expectation of over 7% in the coming period, is also exploring quantum dots technology as an alternative to conventional phosphors. Meanwhile, phosphor integration technologies are adapting, using materials like a silicone matrix or more robust ceramic materials in a transparent matrix to support applications such as laser diode white light, distinguishing these systems from technologies like phosphorescent OLEDs.
Dive into Technavio’s robust research methodology, blending expert interviews, extensive data synthesis, and validated models for unparalleled LED Phosphors Market insights. See full methodology.
Market Scope
|
Report Coverage
|
Details
|
Page number
|
297
|
Base year
|
2024
|
Historic period
|
2019 - 2023 |
Forecast period
|
2025-2029
|
Growth momentum & CAGR
|
Accelerating at a CAGR of 18.4%
|
Market growth 2024-2029
|
USD 3.4 billion
|
Market structure
|
Fragmented
|
YoY growth 2024-2029(%)
|
15.6%
|
Key countries
|
China, Japan, South Korea, India, Taiwan, Vietnam, Germany, UK, France, Italy, The Netherlands, Spain, US, Canada, Mexico, Brazil, Argentina, Colombia, Saudi Arabia, UAE, South Africa, Egypt, Nigeria
|
Competitive landscape
|
Leading Companies, Market Positioning of Companies, Competitive Strategies, and Industry Risks
|
Request Free Sample
What are the Key Data Covered in this LED Phosphors Market Research and Growth Report?
- CAGR of the LED Phosphors industry during the forecast period
- Detailed information on factors that will drive the growth and forecasting between 2024 and 2029
- Precise estimation of the size of the market and its contribution of the industry in focus to the parent market
- Accurate predictions about upcoming growth and trends and changes in consumer behaviour
- Growth of the market across APAC, Europe, North America, South America, Middle East and Africa
- Thorough analysis of the market’s competitive landscape and detailed information about companies
- Comprehensive analysis of factors that will challenge the led phosphors market growth of industry companies
We can help! Our analysts can customize this led phosphors market research report to meet your requirements.
Get in touch
1 Executive Summary
- 1 Executive Summary
- 1.1 Market overview
- Executive Summary - Chart on Market Overview
- Executive Summary - Data Table on Market Overview
- Executive Summary - Chart on Global Market Characteristics
- Executive Summary - Chart on Market by Geography
- Executive Summary - Chart on Market Segmentation by Application
- Executive Summary - Chart on Market Segmentation by Type
- Executive Summary - Chart on Market Segmentation by End-user
- Executive Summary - Chart on Incremental Growth
- Executive Summary - Data Table on Incremental Growth
- Executive Summary - Chart on Company Market Positioning
2 Technavio Analysis
- 2 Technavio Analysis
- 2.1 Analysis of price sensitivity, lifecycle, customer purchase basket, adoption rates, and purchase criteria
- Analysis of price sensitivity, lifecycle, customer purchase basket, adoption rates, and purchase criteria
- 2.2 Criticality of inputs and Factors of differentiation
- Chart on Overview on criticality of inputs and factors of differentiation
- 2.3 Factors of disruption
- Chart on Overview on factors of disruption
- 2.4 Impact of drivers and challenges
- Chart on Impact of drivers and challenges in 2024 and 2029
3 Market Landscape
- 3 Market Landscape
- 3.1 Market ecosystem
- Chart on Parent Market
- Data Table on - Parent Market
- 3.2 Market characteristics
- Chart on Market characteristics analysis
- 3.3 Value chain analysis
- Chart on Value chain analysis
4 Market Sizing
- 4 Market Sizing
- 4.1 Market definition
- Data Table on Offerings of companies included in the market definition
- 4.2 Market segment analysis
- 4.3 Market size 2024
- 4.4 Market outlook: Forecast for 2024-2029
- Chart on Global - Market size and forecast 2024-2029 ($ billion)
- Data Table on Global - Market size and forecast 2024-2029 ($ billion)
- Chart on Global Market: Year-over-year growth 2024-2029 (%)
- Data Table on Global Market: Year-over-year growth 2024-2029 (%)
5 Historic Market Size
- 5 Historic Market Size
- 5.1 Global LED Phosphors Market 2019 - 2023
- Historic Market Size - Data Table on Global LED Phosphors Market 2019 - 2023 ($ billion)
- 5.2 Application segment analysis 2019 - 2023
- Historic Market Size - Application Segment 2019 - 2023 ($ billion)
- 5.3 Type segment analysis 2019 - 2023
- Historic Market Size - Type Segment 2019 - 2023 ($ billion)
- 5.4 End-user segment analysis 2019 - 2023
- Historic Market Size - End-user Segment 2019 - 2023 ($ billion)
- 5.5 Geography segment analysis 2019 - 2023
- Historic Market Size - Geography Segment 2019 - 2023 ($ billion)
- 5.6 Country segment analysis 2019 - 2023
- Historic Market Size - Country Segment 2019 - 2023 ($ billion)
6 Qualitative Analysis
- 6 Qualitative Analysis
- 6.1 The impact of AI in Global LED Phosphors Market
7 Five Forces Analysis
- 7 Five Forces Analysis
- 7.1 Five forces summary
- Five forces analysis - Comparison between 2024 and 2029
- 7.2 Bargaining power of buyers
- Bargaining power of buyers - Impact of key factors 2024 and 2029
- 7.3 Bargaining power of suppliers
- Bargaining power of suppliers - Impact of key factors in 2024 and 2029
- 7.4 Threat of new entrants
- Threat of new entrants - Impact of key factors in 2024 and 2029
- 7.5 Threat of substitutes
- Threat of substitutes - Impact of key factors in 2024 and 2029
- 7.6 Threat of rivalry
- Threat of rivalry - Impact of key factors in 2024 and 2029
- 7.7 Market condition
- Chart on Market condition - Five forces 2024 and 2029
8 Market Segmentation by Application
- 8 Market Segmentation by Application
- 8.1 Market segments
- Chart on Application - Market share 2024-2029 (%)
- Data Table on Application - Market share 2024-2029 (%)
- 8.2 Comparison by Application
- Chart on Comparison by Application
- Data Table on Comparison by Application
- 8.3 Smartphones - Market size and forecast 2024-2029
- Chart on Smartphones - Market size and forecast 2024-2029 ($ billion)
- Data Table on Smartphones - Market size and forecast 2024-2029 ($ billion)
- Chart on Smartphones - Year-over-year growth 2024-2029 (%)
- Data Table on Smartphones - Year-over-year growth 2024-2029 (%)
- 8.4 LCD TVs - Market size and forecast 2024-2029
- Chart on LCD TVs - Market size and forecast 2024-2029 ($ billion)
- Data Table on LCD TVs - Market size and forecast 2024-2029 ($ billion)
- Chart on LCD TVs - Year-over-year growth 2024-2029 (%)
- Data Table on LCD TVs - Year-over-year growth 2024-2029 (%)
- 8.5 Laptops and tablets - Market size and forecast 2024-2029
- Chart on Laptops and tablets - Market size and forecast 2024-2029 ($ billion)
- Data Table on Laptops and tablets - Market size and forecast 2024-2029 ($ billion)
- Chart on Laptops and tablets - Year-over-year growth 2024-2029 (%)
- Data Table on Laptops and tablets - Year-over-year growth 2024-2029 (%)
- 8.6 Automotive - Market size and forecast 2024-2029
- Chart on Automotive - Market size and forecast 2024-2029 ($ billion)
- Data Table on Automotive - Market size and forecast 2024-2029 ($ billion)
- Chart on Automotive - Year-over-year growth 2024-2029 (%)
- Data Table on Automotive - Year-over-year growth 2024-2029 (%)
- 8.7 Others - Market size and forecast 2024-2029
- Chart on Others - Market size and forecast 2024-2029 ($ billion)
- Data Table on Others - Market size and forecast 2024-2029 ($ billion)
- Chart on Others - Year-over-year growth 2024-2029 (%)
- Data Table on Others - Year-over-year growth 2024-2029 (%)
- 8.8 Market opportunity by Application
- Market opportunity by Application ($ billion)
- Data Table on Market opportunity by Application ($ billion)
9 Market Segmentation by Type
- 9 Market Segmentation by Type
- 9.1 Market segments
- Chart on Type - Market share 2024-2029 (%)
- Data Table on Type - Market share 2024-2029 (%)
- 9.2 Comparison by Type
- Chart on Comparison by Type
- Data Table on Comparison by Type
- 9.3 YAG phosphors - Market size and forecast 2024-2029
- Chart on YAG phosphors - Market size and forecast 2024-2029 ($ billion)
- Data Table on YAG phosphors - Market size and forecast 2024-2029 ($ billion)
- Chart on YAG phosphors - Year-over-year growth 2024-2029 (%)
- Data Table on YAG phosphors - Year-over-year growth 2024-2029 (%)
- 9.4 Silicate phosphors - Market size and forecast 2024-2029
- Chart on Silicate phosphors - Market size and forecast 2024-2029 ($ billion)
- Data Table on Silicate phosphors - Market size and forecast 2024-2029 ($ billion)
- Chart on Silicate phosphors - Year-over-year growth 2024-2029 (%)
- Data Table on Silicate phosphors - Year-over-year growth 2024-2029 (%)
- 9.5 Nitride phosphors - Market size and forecast 2024-2029
- Chart on Nitride phosphors - Market size and forecast 2024-2029 ($ billion)
- Data Table on Nitride phosphors - Market size and forecast 2024-2029 ($ billion)
- Chart on Nitride phosphors - Year-over-year growth 2024-2029 (%)
- Data Table on Nitride phosphors - Year-over-year growth 2024-2029 (%)
- 9.6 Market opportunity by Type
- Market opportunity by Type ($ billion)
- Data Table on Market opportunity by Type ($ billion)
10 Market Segmentation by End-user
- 10 Market Segmentation by End-user
- 10.1 Market segments
- Chart on End-user - Market share 2024-2029 (%)
- Data Table on End-user - Market share 2024-2029 (%)
- 10.2 Comparison by End-user
- Chart on Comparison by End-user
- Data Table on Comparison by End-user
- 10.3 Residential - Market size and forecast 2024-2029
- Chart on Residential - Market size and forecast 2024-2029 ($ billion)
- Data Table on Residential - Market size and forecast 2024-2029 ($ billion)
- Chart on Residential - Year-over-year growth 2024-2029 (%)
- Data Table on Residential - Year-over-year growth 2024-2029 (%)
- 10.4 Commercial - Market size and forecast 2024-2029
- Chart on Commercial - Market size and forecast 2024-2029 ($ billion)
- Data Table on Commercial - Market size and forecast 2024-2029 ($ billion)
- Chart on Commercial - Year-over-year growth 2024-2029 (%)
- Data Table on Commercial - Year-over-year growth 2024-2029 (%)
- 10.5 Industrial - Market size and forecast 2024-2029
- Chart on Industrial - Market size and forecast 2024-2029 ($ billion)
- Data Table on Industrial - Market size and forecast 2024-2029 ($ billion)
- Chart on Industrial - Year-over-year growth 2024-2029 (%)
- Data Table on Industrial - Year-over-year growth 2024-2029 (%)
- 10.6 Market opportunity by End-user
- Market opportunity by End-user ($ billion)
- Data Table on Market opportunity by End-user ($ billion)
11 Customer Landscape
- 11 Customer Landscape
- 11.1 Customer landscape overview
- Analysis of price sensitivity, lifecycle, customer purchase basket, adoption rates, and purchase criteria
12 Geographic Landscape
- 12 Geographic Landscape
- 12.1 Geographic segmentation
- Chart on Market share by geography 2024-2029 (%)
- Data Table on Market share by geography 2024-2029 (%)
- 12.2 Geographic comparison
- Chart on Geographic comparison
- Data Table on Geographic comparison
- 12.3 APAC - Market size and forecast 2024-2029
- Chart on APAC - Market size and forecast 2024-2029 ($ billion)
- Data Table on APAC - Market size and forecast 2024-2029 ($ billion)
- Chart on APAC - Year-over-year growth 2024-2029 (%)
- Data Table on APAC - Year-over-year growth 2024-2029 (%)
- Chart on Regional Comparison - APAC
- Data Table on Regional Comparison - APAC
- 12.3.1 China - Market size and forecast 2024-2029
- Chart on China - Market size and forecast 2024-2029 ($ billion)
- Data Table on China - Market size and forecast 2024-2029 ($ billion)
- Chart on China - Year-over-year growth 2024-2029 (%)
- Data Table on China - Year-over-year growth 2024-2029 (%)
- 12.3.2 Japan - Market size and forecast 2024-2029
- Chart on Japan - Market size and forecast 2024-2029 ($ billion)
- Data Table on Japan - Market size and forecast 2024-2029 ($ billion)
- Chart on Japan - Year-over-year growth 2024-2029 (%)
- Data Table on Japan - Year-over-year growth 2024-2029 (%)
- 12.3.3 South Korea - Market size and forecast 2024-2029
- Chart on South Korea - Market size and forecast 2024-2029 ($ billion)
- Data Table on South Korea - Market size and forecast 2024-2029 ($ billion)
- Chart on South Korea - Year-over-year growth 2024-2029 (%)
- Data Table on South Korea - Year-over-year growth 2024-2029 (%)
- 12.3.4 India - Market size and forecast 2024-2029
- Chart on India - Market size and forecast 2024-2029 ($ billion)
- Data Table on India - Market size and forecast 2024-2029 ($ billion)
- Chart on India - Year-over-year growth 2024-2029 (%)
- Data Table on India - Year-over-year growth 2024-2029 (%)
- 12.3.5 Taiwan - Market size and forecast 2024-2029
- Chart on Taiwan - Market size and forecast 2024-2029 ($ billion)
- Data Table on Taiwan - Market size and forecast 2024-2029 ($ billion)
- Chart on Taiwan - Year-over-year growth 2024-2029 (%)
- Data Table on Taiwan - Year-over-year growth 2024-2029 (%)
- 12.3.6 Vietnam - Market size and forecast 2024-2029
- Chart on Vietnam - Market size and forecast 2024-2029 ($ billion)
- Data Table on Vietnam - Market size and forecast 2024-2029 ($ billion)
- Chart on Vietnam - Year-over-year growth 2024-2029 (%)
- Data Table on Vietnam - Year-over-year growth 2024-2029 (%)
- 12.4 Europe - Market size and forecast 2024-2029
- Chart on Europe - Market size and forecast 2024-2029 ($ billion)
- Data Table on Europe - Market size and forecast 2024-2029 ($ billion)
- Chart on Europe - Year-over-year growth 2024-2029 (%)
- Data Table on Europe - Year-over-year growth 2024-2029 (%)
- Chart on Regional Comparison - Europe
- Data Table on Regional Comparison - Europe
- 12.4.1 Germany - Market size and forecast 2024-2029
- Chart on Germany - Market size and forecast 2024-2029 ($ billion)
- Data Table on Germany - Market size and forecast 2024-2029 ($ billion)
- Chart on Germany - Year-over-year growth 2024-2029 (%)
- Data Table on Germany - Year-over-year growth 2024-2029 (%)
- 12.4.2 UK - Market size and forecast 2024-2029
- Chart on UK - Market size and forecast 2024-2029 ($ billion)
- Data Table on UK - Market size and forecast 2024-2029 ($ billion)
- Chart on UK - Year-over-year growth 2024-2029 (%)
- Data Table on UK - Year-over-year growth 2024-2029 (%)
- 12.4.3 France - Market size and forecast 2024-2029
- Chart on France - Market size and forecast 2024-2029 ($ billion)
- Data Table on France - Market size and forecast 2024-2029 ($ billion)
- Chart on France - Year-over-year growth 2024-2029 (%)
- Data Table on France - Year-over-year growth 2024-2029 (%)
- 12.4.4 Italy - Market size and forecast 2024-2029
- Chart on Italy - Market size and forecast 2024-2029 ($ billion)
- Data Table on Italy - Market size and forecast 2024-2029 ($ billion)
- Chart on Italy - Year-over-year growth 2024-2029 (%)
- Data Table on Italy - Year-over-year growth 2024-2029 (%)
- 12.4.5 The Netherlands - Market size and forecast 2024-2029
- Chart on The Netherlands - Market size and forecast 2024-2029 ($ billion)
- Data Table on The Netherlands - Market size and forecast 2024-2029 ($ billion)
- Chart on The Netherlands - Year-over-year growth 2024-2029 (%)
- Data Table on The Netherlands - Year-over-year growth 2024-2029 (%)
- 12.4.6 Spain - Market size and forecast 2024-2029
- Chart on Spain - Market size and forecast 2024-2029 ($ billion)
- Data Table on Spain - Market size and forecast 2024-2029 ($ billion)
- Chart on Spain - Year-over-year growth 2024-2029 (%)
- Data Table on Spain - Year-over-year growth 2024-2029 (%)
- 12.5 North America - Market size and forecast 2024-2029
- Chart on North America - Market size and forecast 2024-2029 ($ billion)
- Data Table on North America - Market size and forecast 2024-2029 ($ billion)
- Chart on North America - Year-over-year growth 2024-2029 (%)
- Data Table on North America - Year-over-year growth 2024-2029 (%)
- Chart on Regional Comparison - North America
- Data Table on Regional Comparison - North America
- 12.5.1 US - Market size and forecast 2024-2029
- Chart on US - Market size and forecast 2024-2029 ($ billion)
- Data Table on US - Market size and forecast 2024-2029 ($ billion)
- Chart on US - Year-over-year growth 2024-2029 (%)
- Data Table on US - Year-over-year growth 2024-2029 (%)
- 12.5.2 Canada - Market size and forecast 2024-2029
- Chart on Canada - Market size and forecast 2024-2029 ($ billion)
- Data Table on Canada - Market size and forecast 2024-2029 ($ billion)
- Chart on Canada - Year-over-year growth 2024-2029 (%)
- Data Table on Canada - Year-over-year growth 2024-2029 (%)
- 12.5.3 Mexico - Market size and forecast 2024-2029
- Chart on Mexico - Market size and forecast 2024-2029 ($ billion)
- Data Table on Mexico - Market size and forecast 2024-2029 ($ billion)
- Chart on Mexico - Year-over-year growth 2024-2029 (%)
- Data Table on Mexico - Year-over-year growth 2024-2029 (%)
- 12.6 South America - Market size and forecast 2024-2029
- Chart on South America - Market size and forecast 2024-2029 ($ billion)
- Data Table on South America - Market size and forecast 2024-2029 ($ billion)
- Chart on South America - Year-over-year growth 2024-2029 (%)
- Data Table on South America - Year-over-year growth 2024-2029 (%)
- Chart on Regional Comparison - South America
- Data Table on Regional Comparison - South America
- 12.6.1 Brazil - Market size and forecast 2024-2029
- Chart on Brazil - Market size and forecast 2024-2029 ($ billion)
- Data Table on Brazil - Market size and forecast 2024-2029 ($ billion)
- Chart on Brazil - Year-over-year growth 2024-2029 (%)
- Data Table on Brazil - Year-over-year growth 2024-2029 (%)
- 12.6.2 Argentina - Market size and forecast 2024-2029
- Chart on Argentina - Market size and forecast 2024-2029 ($ billion)
- Data Table on Argentina - Market size and forecast 2024-2029 ($ billion)
- Chart on Argentina - Year-over-year growth 2024-2029 (%)
- Data Table on Argentina - Year-over-year growth 2024-2029 (%)
- 12.6.3 Colombia - Market size and forecast 2024-2029
- Chart on Colombia - Market size and forecast 2024-2029 ($ billion)
- Data Table on Colombia - Market size and forecast 2024-2029 ($ billion)
- Chart on Colombia - Year-over-year growth 2024-2029 (%)
- Data Table on Colombia - Year-over-year growth 2024-2029 (%)
- 12.7 Middle East and Africa - Market size and forecast 2024-2029
- Chart on Middle East and Africa - Market size and forecast 2024-2029 ($ billion)
- Data Table on Middle East and Africa - Market size and forecast 2024-2029 ($ billion)
- Chart on Middle East and Africa - Year-over-year growth 2024-2029 (%)
- Data Table on Middle East and Africa - Year-over-year growth 2024-2029 (%)
- Chart on Regional Comparison - Middle East and Africa
- Data Table on Regional Comparison - Middle East and Africa
- 12.7.1 Saudi Arabia - Market size and forecast 2024-2029
- Chart on Saudi Arabia - Market size and forecast 2024-2029 ($ billion)
- Data Table on Saudi Arabia - Market size and forecast 2024-2029 ($ billion)
- Chart on Saudi Arabia - Year-over-year growth 2024-2029 (%)
- Data Table on Saudi Arabia - Year-over-year growth 2024-2029 (%)
- 12.7.2 UAE - Market size and forecast 2024-2029
- Chart on UAE - Market size and forecast 2024-2029 ($ billion)
- Data Table on UAE - Market size and forecast 2024-2029 ($ billion)
- Chart on UAE - Year-over-year growth 2024-2029 (%)
- Data Table on UAE - Year-over-year growth 2024-2029 (%)
- 12.7.3 South Africa - Market size and forecast 2024-2029
- Chart on South Africa - Market size and forecast 2024-2029 ($ billion)
- Data Table on South Africa - Market size and forecast 2024-2029 ($ billion)
- Chart on South Africa - Year-over-year growth 2024-2029 (%)
- Data Table on South Africa - Year-over-year growth 2024-2029 (%)
- 12.7.4 Egypt - Market size and forecast 2024-2029
- Chart on Egypt - Market size and forecast 2024-2029 ($ billion)
- Data Table on Egypt - Market size and forecast 2024-2029 ($ billion)
- Chart on Egypt - Year-over-year growth 2024-2029 (%)
- Data Table on Egypt - Year-over-year growth 2024-2029 (%)
- 12.7.5 Nigeria - Market size and forecast 2024-2029
- Chart on Nigeria - Market size and forecast 2024-2029 ($ billion)
- Data Table on Nigeria - Market size and forecast 2024-2029 ($ billion)
- Chart on Nigeria - Year-over-year growth 2024-2029 (%)
- Data Table on Nigeria - Year-over-year growth 2024-2029 (%)
- 12.8 Market opportunity by geography
- Market opportunity by geography ($ billion)
- Data Tables on Market opportunity by geography ($ billion)
13 Drivers, Challenges, and Opportunity
- 13 Drivers, Challenges, and Opportunity
- 13.1 Market drivers
- Adoption of LED phosphors in automotive industry
- Strategic initiatives of market players
- Favorable government policies
- 13.2 Market challenges
- Slowdown of the global automotive industry
- Lack of awareness regarding benefits of LED phosphor technology
- Market competition from quantum dots technology
- 13.3 Impact of drivers and challenges
- Impact of drivers and challenges in 2024 and 2029
- 13.4 Market opportunities
- Development of new LED phosphor materials
- Rising preference for LED lighting technologies over conventional lighting systems
- Increased adoption of energy-efficient and smart lighting systems
14 Competitive Landscape
- 14 Competitive Landscape
- 14.1 Overview
- 14.2 Competitive Landscape
- Overview on criticality of inputs and factors of differentiation
- 14.3 Landscape disruption
- Overview on factors of disruption
- 14.4 Industry risks
- Impact of key risks on business
15 Competitive Analysis
- 15 Competitive Analysis
- 15.1 Companies profiled
- 15.2 Company ranking index
- 15.3 Market positioning of companies
- Matrix on companies position and classification
- 15.4 Bridgelux Inc.
- Bridgelux Inc. - Overview
- Bridgelux Inc. - Product / Service
- Bridgelux Inc. - Key offerings
- SWOT
- 15.5 Citizen Watch Co. Ltd.
- Citizen Watch Co. Ltd. - Overview
- Citizen Watch Co. Ltd. - Business segments
- Citizen Watch Co. Ltd. - Key offerings
- Citizen Watch Co. Ltd. - Segment focus
- SWOT
- 15.6 Denka Co. Ltd.
- Denka Co. Ltd. - Overview
- Denka Co. Ltd. - Business segments
- Denka Co. Ltd. - Key offerings
- Denka Co. Ltd. - Segment focus
- SWOT
- 15.7 EPISTAR Corp
- EPISTAR Corp - Overview
- EPISTAR Corp - Product / Service
- EPISTAR Corp - Key offerings
- SWOT
- 15.8 Everlight Electronics Co. Ltd.
- Everlight Electronics Co. Ltd. - Overview
- Everlight Electronics Co. Ltd. - Product / Service
- Everlight Electronics Co. Ltd. - Key offerings
- SWOT
- 15.9 Intematix Corp.
- Intematix Corp. - Overview
- Intematix Corp. - Product / Service
- Intematix Corp. - Key offerings
- SWOT
- 15.10 Lumileds Holding BV
- Lumileds Holding BV - Overview
- Lumileds Holding BV - Product / Service
- Lumileds Holding BV - Key offerings
- SWOT
- 15.11 Materion Corp.
- Materion Corp. - Overview
- Materion Corp. - Business segments
- Materion Corp. - Key offerings
- Materion Corp. - Segment focus
- SWOT
- 15.12 Merck KGaA
- Merck KGaA - Overview
- Merck KGaA - Business segments
- Merck KGaA - Key news
- Merck KGaA - Key offerings
- Merck KGaA - Segment focus
- SWOT
- 15.13 Mitsubishi Chemical Corp.
- Mitsubishi Chemical Corp. - Overview
- Mitsubishi Chemical Corp. - Business segments
- Mitsubishi Chemical Corp. - Key offerings
- Mitsubishi Chemical Corp. - Segment focus
- SWOT
- 15.14 Nichia Corp.
- Nichia Corp. - Overview
- Nichia Corp. - Product / Service
- Nichia Corp. - Key news
- Nichia Corp. - Key offerings
- SWOT
- 15.15 OSRAM GmbH
- OSRAM GmbH - Overview
- OSRAM GmbH - Business segments
- OSRAM GmbH - Key news
- OSRAM GmbH - Key offerings
- OSRAM GmbH - Segment focus
- SWOT
- 15.16 SMART Global Holdings Inc.
- SMART Global Holdings Inc. - Overview
- SMART Global Holdings Inc. - Business segments
- SMART Global Holdings Inc. - Key offerings
- SMART Global Holdings Inc. - Segment focus
- SWOT
- 15.17 Yantai Tongli High tech New Materials Co. Ltd.
- Yantai Tongli High tech New Materials Co. Ltd. - Overview
- Yantai Tongli High tech New Materials Co. Ltd. - Product / Service
- Yantai Tongli High tech New Materials Co. Ltd. - Key offerings
- SWOT
- 15.18 Yuji International Co. Ltd.
- Yuji International Co. Ltd. - Overview
- Yuji International Co. Ltd. - Product / Service
- Yuji International Co. Ltd. - Key offerings
- SWOT
16 Appendix
- 16 Appendix
- 16.1 Scope of the report
- Market definition
- Objectives
- Notes and caveats
- 16.2 Inclusions and exclusions checklist
- Inclusions checklist
- Exclusions checklist
- 16.3 Currency conversion rates for US$
- Currency conversion rates for US$
- 16.4 Research methodology
- 16.5 Data procurement
- 16.6 Data validation
- 16.7 Validation techniques employed for market sizing
- Validation techniques employed for market sizing
- 16.8 Data synthesis
- 16.9 360 degree market analysis
- 360 degree market analysis
- 16.10 List of abbreviations
Research Framework
Technavio presents a detailed picture of the market by way of study, synthesis, and summation of data from multiple sources. The analysts have presented the various facets of the market with a particular focus on identifying the key industry influencers. The data thus presented is comprehensive, reliable, and the result of extensive research, both primary and secondary.
INFORMATION SOURCES
Primary sources
- Manufacturers and suppliers
- Channel partners
- Industry experts
- Strategic decision makers
Secondary sources
- Industry journals and periodicals
- Government data
- Financial reports of key industry players
- Historical data
- Press releases

DATA ANALYSIS
Data Synthesis
- Collation of data
- Estimation of key figures
- Analysis of derived insights
Data Validation
- Triangulation with data models
- Reference against proprietary databases
- Corroboration with industry experts

REPORT WRITING
Qualitative
- Market drivers
- Market challenges
- Market trends
- Five forces analysis
Quantitative
- Market size and forecast
- Market segmentation
- Geographical insights
- Competitive landscape