Level 4 Autonomous Vehicles Market Analysis, Size, and Forecast 2026-2030: North America (US, Canada, and Mexico), Europe (Germany, UK, and France), APAC (China, Japan, and South Korea), Middle East and Africa (Saudi Arabia, UAE, and South Africa), South America (Brazil, Argentina, and Colombia), and Rest of World (ROW)

Level 4 Autonomous Vehicles Market Analysis, Size, and Forecast 2026-2030:
North America (US, Canada, and Mexico), Europe (Germany, UK, and France), APAC (China, Japan, and South Korea), Middle East and Africa (Saudi Arabia, UAE, and South Africa), South America (Brazil, Argentina, and Colombia), and Rest of World (ROW)

Published: Dec 2025 303 Pages SKU: IRTNTR81193

Market Overview at a Glance

$2.82 B
Market Opportunity
38.2%
CAGR 2025 - 2030
40.8%
North America Growth
$270.2 Mn
Robo taxis segment 2024

Level 4 Autonomous Vehicles Market Size 2026-2030

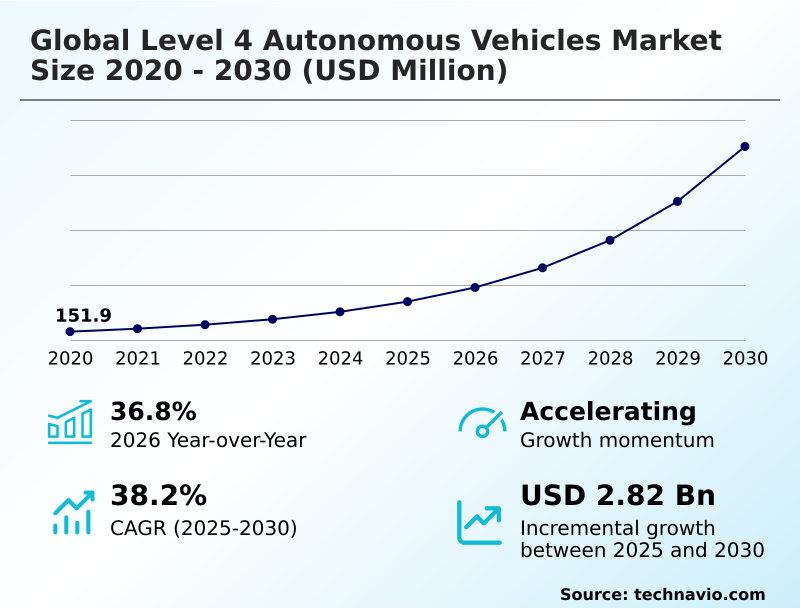
The level 4 autonomous vehicles market size is valued to increase by USD 2.82 billion, at a CAGR of 38.2% from 2025 to 2030. Technological advancements in perception and artificial intelligence will drive the level 4 autonomous vehicles market.

Major Market Trends & Insights

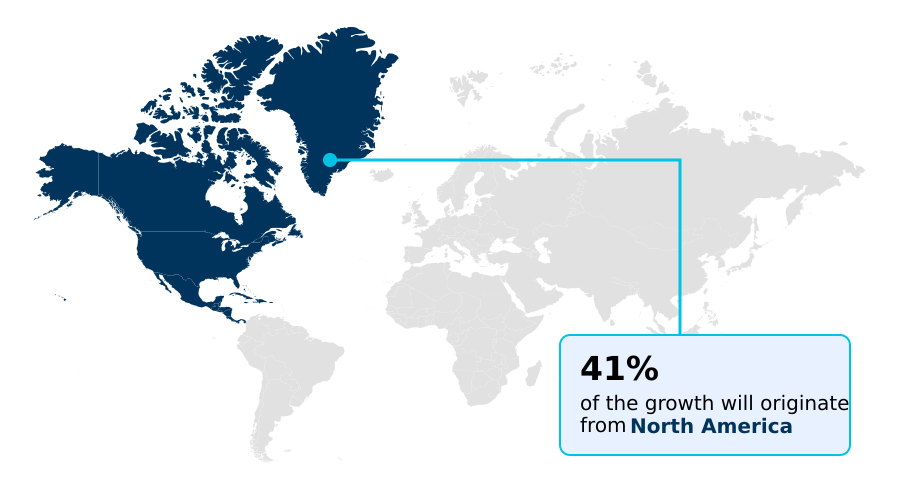
  • North America dominated the market and accounted for a 40.8% growth during the forecast period.
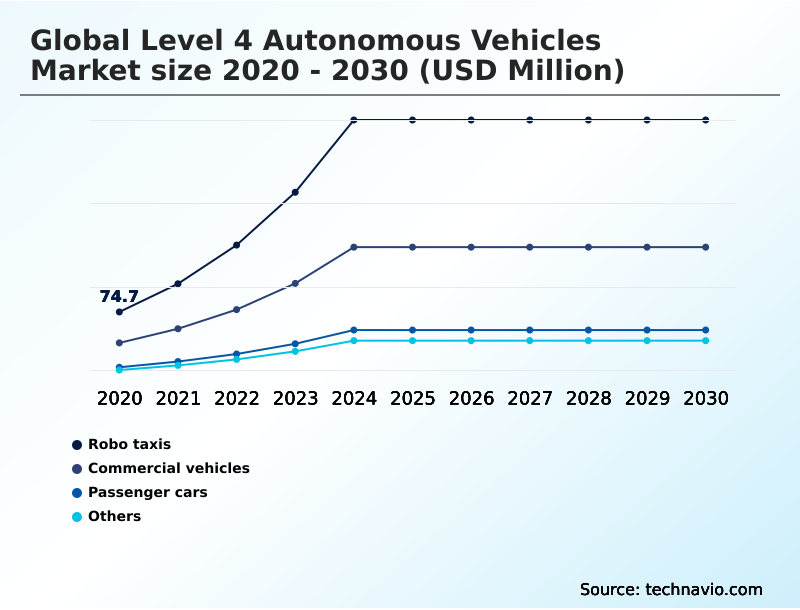
  • By Vehicle Type - Robo taxis segment was valued at USD 270.2 million in 2024
  • By Component - Hardware segment accounted for the largest market revenue share in 2024

Market Size & Forecast

  • Market Opportunities: USD 3.37 billion
  • Market Future Opportunities: USD 2.82 billion
  • CAGR from 2025 to 2030 : 38.2%

Market Summary

  • The level 4 autonomous vehicles market is defined by vehicles capable of high driving automation within a specific operational design domain, eliminating the need for human intervention in geofenced locations. This progress is built upon sophisticated sensor suites and powerful onboard computers that run complex artificial intelligence algorithms for real-time decision making.
  • Key drivers include significant operational cost reductions in logistics and delivery, where a logistics firm might leverage autonomous trucking for long-haul logistics to address driver shortages and achieve up to 14% in fuel savings.
  • However, the path to mass adoption is constrained by challenges such as fragmented regulatory frameworks, cybersecurity measures, and the critical need to build public perception and trust. The successful deployment of driverless trucks and robotaxi services depends on developing fault-tolerant perception systems and robust vehicle-to-everything (v2x) communication within smart infrastructure, ensuring both safety and efficiency.
  • This technological shift is compelling businesses to reconsider their mobility and supply chain strategies, focusing on the economic and safety benefits of removing the human driver from the equation in controlled environments.

What will be the Size of the Level 4 Autonomous Vehicles Market during the forecast period?

Get Key Insights on Market Forecast (PDF) Request Free Sample

How is the Level 4 Autonomous Vehicles Market Segmented?

The level 4 autonomous vehicles industry research report provides comprehensive data (region-wise segment analysis), with forecasts and estimates in "USD million" for the period 2026-2030, as well as historical data from 2020-2024 for the following segments.

  • Vehicle type
    • Robo taxis
    • Commercial vehicles
    • Passenger cars
    • Others
  • Component
    • Hardware
    • Software
    • Services
  • Propulsion
    • Electric
    • Hybrid
    • Internal combustion engine
  • Geography
    • North America
      • US
      • Canada
      • Mexico
    • Europe
      • Germany
      • UK
      • France
    • APAC
      • China
      • Japan
      • South Korea
    • Middle East and Africa
      • Saudi Arabia
      • UAE
      • South Africa
    • South America
      • Brazil
      • Argentina
      • Colombia
    • Rest of World (ROW)

By Vehicle Type Insights

The robo taxis segment is estimated to witness significant growth during the forecast period.

The robotaxi segment is pivotal to the evolution of shared mobility services, transitioning from pilot programs to initial driverless operations. These vehicles rely on sophisticated sensor suites and onboard computers running advanced artificial intelligence algorithms to navigate complex urban routes.

Success hinges on a fault-tolerant perception system capable of precise object recognition and classification and predictive behavior prediction of pedestrians and other vehicles.

While public acceptance varies, with some surveys showing nearly three times higher interest in certain APAC regions compared to North America, the focus remains on safety.

Advanced computer vision algorithms and cybersecurity measures are critical for building trust and enabling scalable autonomous shuttles for logistics and delivery in densely populated areas.

Request Free Sample

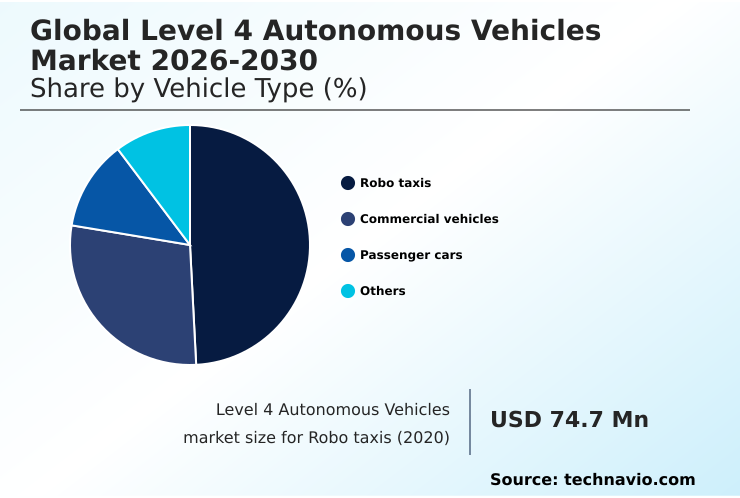
The Robo taxis segment was valued at USD 270.2 million in 2024 and showed a gradual increase during the forecast period.

Request Free Sample

Regional Analysis

North America is estimated to contribute 40.8% to the growth of the global market during the forecast period.Technavio’s analysts have elaborately explained the regional trends and drivers that shape the market during the forecast period.

See How Level 4 Autonomous Vehicles Market Demand is Rising in North America Request Free Sample

The geographic landscape for level 4 autonomy is varied, with distinct regional strategies shaping deployment. North America leads in real-world testing of geofenced mobility, particularly for robotaxis, though progress is moderated by geopolitical tensions impacting supply chains.

In contrast, APAC, driven by government mandates aiming for 30% of new vehicles to have advanced automation, excels in large-scale urban mobility solutions and is rapidly developing smart infrastructure with vehicle-to-everything (v2x) capabilities.

This region's focus on connected mobility is accelerating commercialization. Europe prioritizes regulatory harmonization and public transport applications, leveraging advanced driver assistance systems (adas) as a bridge to full autonomy.

Real-time decision making in these vehicles is powered by centralized computing units running complex machine learning algorithms, tailored to each operational design domain.

This regional divergence necessitates tailored market-entry strategies that account for differing regulatory climates and infrastructure readiness, impacting overall supply chain resilience.

Market Dynamics

Our researchers analyzed the data with 2025 as the base year, along with the key drivers, trends, and challenges. A holistic analysis of drivers will help companies refine their marketing strategies to gain a competitive advantage.

  • The successful integration of level 4 autonomy hinges on addressing specific use cases and their inherent complexities. In urban environments, the economic viability of level 4 robotaxis depends on overcoming significant operational challenges and navigating public trust challenges in self-driving technology.
  • Concurrently, the logistics sector is keenly focused on autonomous trucking for long-haul logistics, where the potential for cost reduction with autonomous freight is a primary driver, though this faces regulatory hurdles for driverless truck deployment. The technological backbone for these applications is advancing rapidly.
  • The use of generative AI for autonomous driving simulation allows for extensive validation, as virtual environments can cover millions of scenarios and reduce physical testing needs by more than 50% compared to traditional methods. Advances in sensor fusion for adverse weather navigation are critical for operational reliability, while robust path planning algorithms for unpredictable scenarios enhance safety.
  • However, the industry must still confront major systemic issues. These include establishing clear sae level 4 autonomous vehicle testing standards, mitigating cybersecurity risks in connected autonomous vehicles, and creating definitive legal liability frameworks for autonomous accidents.
  • The implementation of v2x communication for urban traffic efficiency is essential for optimizing traffic flow, while the design of intuitive human-machine interface design for level 4 is key for systems requiring occasional human interaction.
  • Ultimately, whether for last-mile delivery automation with autonomous pods or integrating level 4 systems in passenger cars, the path forward requires a holistic approach that balances innovation with public safety and regulatory consensus, especially concerning data management for AI training in autonomy.

What are the key market drivers leading to the rise in the adoption of Level 4 Autonomous Vehicles Industry?

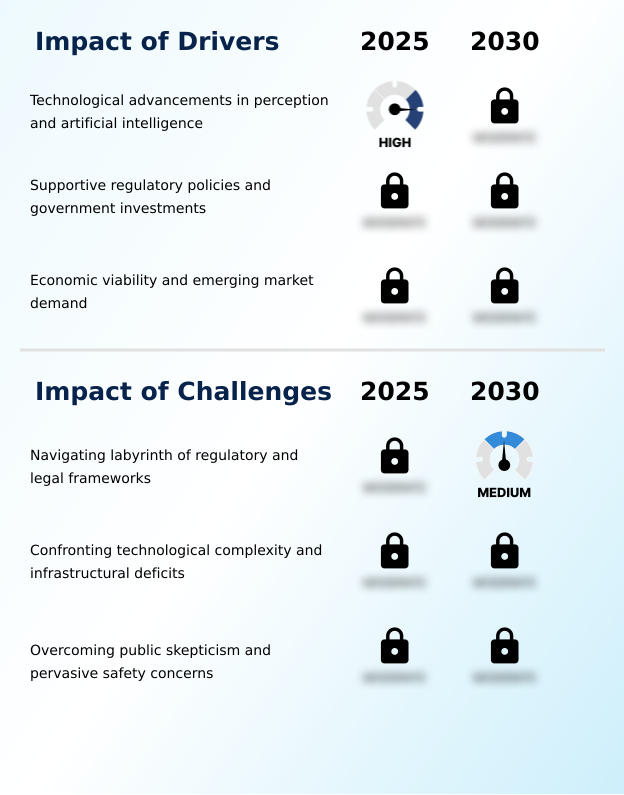
  • Technological advancements in perception and artificial intelligence are the key drivers of market growth.

  • Economic viability is a primary market driver, with commercial applications demonstrating clear pathways to operational cost reduction.
  • In hub-to-hub logistics, driverless trucks operating on autonomous freight corridors can achieve up to 14% in fuel savings and significantly enhance road safety enhancement. Similarly, the expansion of robotaxi services and ride-hailing networks is creating new revenue streams.
  • These deployments are made possible by strategic partnerships between technology developers and vehicle manufacturers, leveraging powerful high-performance system-on-chips (socs) and efficient electric propulsion systems.
  • The focus on specific use cases like last-mile delivery and long-haul trucking allows for targeted deployment, accelerating the realization of benefits such as traffic efficiency improvement and reduced operational expenses, thereby stimulating further investment and market expansion.

What are the market trends shaping the Level 4 Autonomous Vehicles Industry?

  • Advancements in sensor technology and artificial intelligence are a key upcoming market trend. These innovations are critical for enhancing vehicle perception and decision-making capabilities.

  • Key market trends are centered on rapid technological maturation, particularly within the software stack. The use of generative AI models is accelerating data-driven development, allowing for extensive validation and verification of perception and decision-making capabilities in simulated environments, reducing physical testing timelines by over 40%. Concurrently, advancements in sensor fusion techniques are enhancing system reliability.
  • Innovations like solid-state lidar and 4D imaging radar are combined with advanced deep learning models to improve route planning and optimization. This integration is crucial for refining path planning algorithms and localization technology, enabling smoother and safer in-vehicle functions.
  • This focus on software and AI-driven simulation represents a strategic shift toward creating more robust and scalable autonomous systems capable of handling complex, real-world scenarios with greater precision.

What challenges does the Level 4 Autonomous Vehicles Industry face during its growth?

  • Navigating the labyrinth of regulatory and legal frameworks is a key challenge affecting industry growth.

  • Significant challenges persist, primarily in navigating fragmented regulatory frameworks and overcoming low public perception and trust. In some regions, 66% of the public still expresses fear of high driving automation, a sentiment that impedes widespread adoption. The absence of harmonized data sharing protocols complicates efforts to establish clear legal liability, an issue further compounded by underlying infrastructure deficits.
  • Developing a seamless human-machine interface for purpose-built autonomous vehicles remains a complex task. The industry must address these issues systematically, from mandating black box data recorders to facilitating AI-driven urban planning, to build the necessary confidence for deploying sae level 4 autonomy at scale.
  • This includes ensuring the reliability of core technologies like autonomous braking systems, especially for sidewalk delivery robots operating in pedestrian-heavy areas.

Exclusive Technavio Analysis on Customer Landscape

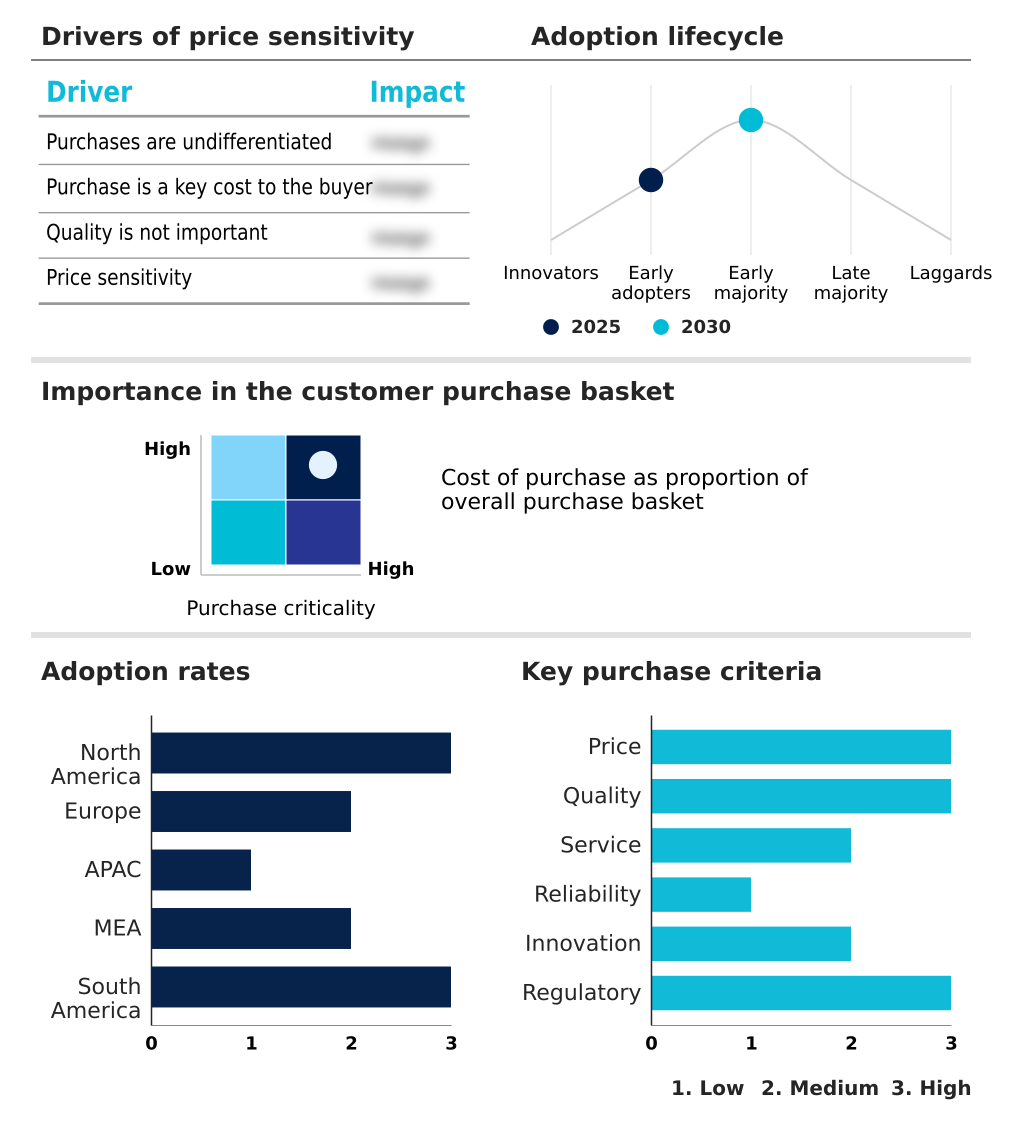
The level 4 autonomous vehicles market forecasting report includes the adoption lifecycle of the market, covering from the innovator’s stage to the laggard’s stage. It focuses on adoption rates in different regions based on penetration. Furthermore, the level 4 autonomous vehicles market report also includes key purchase criteria and drivers of price sensitivity to help companies evaluate and develop their market growth analysis strategies.

Customer Landscape of Level 4 Autonomous Vehicles Industry

Competitive Landscape

Companies are implementing various strategies, such as strategic alliances, level 4 autonomous vehicles market forecast, partnerships, mergers and acquisitions, geographical expansion, and product/service launches, to enhance their presence in the industry.

AB Volvo - These offerings center on commercialized driverless ride-hailing services, leveraging mature AI systems for scalable autonomous mobility within defined urban zones.

The industry research and growth report includes detailed analyses of the competitive landscape of the market and information about key companies, including:

  • AB Volvo
  • Aptiv Plc
  • Aurora Innovation Inc.
  • AutoX Inc.
  • Baidu Inc.
  • BMW AG
  • Ford Motor Co.
  • Mercedes Benz Group AG
  • Mobileye Technologies Ltd.
  • Motional Inc.
  • Nuro Inc.
  • Pony.ai
  • Toyota Motor Corp.
  • Volkswagen AG
  • Waymo LLC
  • WeRide
  • ZF Friedrichshafen AG

Qualitative and quantitative analysis of companies has been conducted to help clients understand the wider business environment as well as the strengths and weaknesses of key industry players. Data is qualitatively analyzed to categorize companies as pure play, category-focused, industry-focused, and diversified; it is quantitatively analyzed to categorize companies as dominant, leading, strong, tentative, and weak.

Recent Development and News in Level 4 autonomous vehicles market

  • In September 2024, the United States government initiated a proposal to prohibit the import and sale of connected vehicles and their components from specific countries, citing national security concerns, with the ban targeting software by 2027 and hardware by 2030.
  • In February 2025, Beep announced a partnership with the Orlando International Airport to deploy a fleet of Level 4 electric shuttles, connecting the main terminal with a new south terminal complex and rental car facilities on dedicated roadways.
  • In March 2025, WeRide and Renault Group offered a public trial of an autonomous Robobus service in Barcelona, demonstrating a real-world application of level 4 technology in public transportation.
  • In April 2025, Aurora launched its first fully autonomous long-haul commercial rides between Dallas and Houston, Texas, showcasing the real-world application and economic potential of its technology for the freight sector.

Dive into Technavio’s robust research methodology, blending expert interviews, extensive data synthesis, and validated models for unparalleled Level 4 Autonomous Vehicles Market insights. See full methodology.

Market Scope
Page number 303
Base year 2025
Historic period 2020-2024
Forecast period 2026-2030
Growth momentum & CAGR Accelerate at a CAGR of 38.2%
Market growth 2026-2030 USD 2820.4 million
Market structure Fragmented
YoY growth 2025-2026(%) 36.8%
Key countries US, Canada, Mexico, Germany, UK, France, Italy, The Netherlands, Spain, China, Japan, South Korea, India, Australia, Indonesia, Saudi Arabia, UAE, South Africa, Israel, Turkey, Brazil, Argentina and Colombia
Competitive landscape Leading Companies, Market Positioning of Companies, Competitive Strategies, and Industry Risks

Request Free Sample

Research Analyst Overview

  • The market for high driving automation is advancing beyond research into commercially viable applications, focusing on robotaxi services and autonomous freight corridors. This evolution is predicated on the integration of advanced sensor suites, high-resolution cameras, and powerful onboard computers capable of processing up to 25 gigabytes of data per minute.
  • Progress is contingent on the sophistication of the software stack, which leverages artificial intelligence algorithms and machine learning algorithms for localization technology and path planning algorithms. For boardroom-level strategy, a critical consideration is the need for co-investment in smart infrastructure, as the reliability of geofenced locations depends on robust vehicle-to-everything (v2x) communication.
  • The deployment of driverless trucks and autonomous shuttles within a defined operational design domain presents clear business cases in logistics and delivery. Success requires not only technological maturity, from autonomous braking systems to centralized computing units, but also navigating the shift toward electric propulsion systems and managing the deployment of purpose-built autonomous vehicles within emerging ride-hailing networks.

What are the Key Data Covered in this Level 4 Autonomous Vehicles Market Research and Growth Report?

  • What is the expected growth of the Level 4 Autonomous Vehicles Market between 2026 and 2030?

    • USD 2.82 billion, at a CAGR of 38.2%

  • What segmentation does the market report cover?

    • The report is segmented by Vehicle Type (Robo taxis, Commercial vehicles, Passenger cars, and Others), Component (Hardware, Software, and Services), Propulsion (Electric, Hybrid, and Internal combustion engine) and Geography (North America, Europe, APAC, Middle East and Africa, South America)

  • Which regions are analyzed in the report?

    • North America, Europe, APAC, Middle East and Africa and South America

  • What are the key growth drivers and market challenges?

    • Technological advancements in perception and artificial intelligence, Navigating labyrinth of regulatory and legal frameworks

  • Who are the major players in the Level 4 Autonomous Vehicles Market?

    • AB Volvo, Aptiv Plc, Aurora Innovation Inc., AutoX Inc., Baidu Inc., BMW AG, Ford Motor Co., Mercedes Benz Group AG, Mobileye Technologies Ltd., Motional Inc., Nuro Inc., Pony.ai, Toyota Motor Corp., Volkswagen AG, Waymo LLC, WeRide and ZF Friedrichshafen AG

Market Research Insights

  • The market dynamics are shaped by a tense interplay between technological capability and external pressures like public perception and trust. For instance, while some data indicates higher accident rates for autonomous systems, this is often attributable to mandatory data sharing protocols for every minor incident, a standard not applied to most human-driven events.
  • Economically, the drive for operational cost reduction is a powerful force, with autonomous trucking pilots demonstrating potential fuel savings of up to 14%. However, these benefits are weighed against complex regulatory frameworks and evolving legal liability standards. The effectiveness of commercial applications and the scalability of shared mobility services depend on resolving these tensions.
  • Progress is contingent on managing infrastructure deficits and achieving a level of road safety enhancement that can overcome widespread consumer skepticism, which remains high in certain Western markets.

We can help! Our analysts can customize this level 4 autonomous vehicles market research report to meet your requirements.

Get in touch

1. Executive Summary

1.1 Market overview

Executive Summary - Chart on Market Overview
Executive Summary - Data Table on Market Overview
Executive Summary - Chart on Global Market Characteristics
Executive Summary - Chart on Market by Geography
Executive Summary - Chart on Market Segmentation by Vehicle Type
Executive Summary - Chart on Market Segmentation by Component
Executive Summary - Chart on Market Segmentation by Propulsion
Executive Summary - Chart on Incremental Growth
Executive Summary - Data Table on Incremental Growth
Executive Summary - Chart on Company Market Positioning

2. Technavio Analysis

2.1 Analysis of price sensitivity, lifecycle, customer purchase basket, adoption rates, and purchase criteria

2.2 Criticality of inputs and Factors of differentiation

Chart on Overview on criticality of inputs and factors of differentiation

2.3 Factors of disruption

Chart on Overview on factors of disruption

2.4 Impact of drivers and challenges

Chart on Impact of drivers and challenges in 2025 and 2030

3. Market Landscape

3.1 Market ecosystem

Chart on Parent Market
Data Table on - Parent Market

3.2 Market characteristics

Chart on Market characteristics analysis

3.3 Value chain analysis

Chart on Value chain analysis

4. Market Sizing

4.1 Market definition

Data Table on Offerings of companies included in the market definition

4.2 Market segment analysis

Market segments

4.3 Market size 2025

4.4 Market outlook: Forecast for 2025-2030

Chart on Global - Market size and forecast 2025-2030 ($ million)
Data Table on Global - Market size and forecast 2025-2030 ($ million)
Chart on Global Market: Year-over-year growth 2025-2030 (%)
Data Table on Global Market: Year-over-year growth 2025-2030 (%)

5. Historic Market Size

5.1 Global Level 4 Autonomous Vehicles Market 2020 - 2024

Historic Market Size - Data Table on Global Level 4 Autonomous Vehicles Market 2020 - 2024 ($ million)

5.2 Vehicle Type segment analysis 2020 - 2024

Historic Market Size - Vehicle Type Segment 2020 - 2024 ($ million)

5.3 Component segment analysis 2020 - 2024

Historic Market Size - Component Segment 2020 - 2024 ($ million)

5.4 Propulsion segment analysis 2020 - 2024

Historic Market Size - Propulsion Segment 2020 - 2024 ($ million)

5.5 Geography segment analysis 2020 - 2024

Historic Market Size - Geography Segment 2020 - 2024 ($ million)

5.6 Country segment analysis 2020 - 2024

Historic Market Size - Country Segment 2020 - 2024 ($ million)

6. Qualitative Analysis

6.1 The AI impact on global level 4 autonomous vehicles market

7. Five Forces Analysis

7.1 Five forces summary

Five forces analysis - Comparison between 2025 and 2030

7.2 Bargaining power of buyers

Bargaining power of buyers - Impact of key factors 2025 and 2030

7.3 Bargaining power of suppliers

Bargaining power of suppliers - Impact of key factors in 2025 and 2030

7.4 Threat of new entrants

Threat of new entrants - Impact of key factors in 2025 and 2030

7.5 Threat of substitutes

Threat of substitutes - Impact of key factors in 2025 and 2030

7.6 Threat of rivalry

Threat of rivalry - Impact of key factors in 2025 and 2030

7.7 Market condition

Chart on Market condition - Five forces 2025 and 2030

8. Market Segmentation by Vehicle Type

8.1 Market segments

Chart on Vehicle Type - Market share 2025-2030 (%)
Data Table on Vehicle Type - Market share 2025-2030 (%)

8.2 Comparison by Vehicle Type

Chart on Comparison by Vehicle Type
Data Table on Comparison by Vehicle Type

8.3 Robo taxis - Market size and forecast 2025-2030

Chart on Robo taxis - Market size and forecast 2025-2030 ($ million)
Data Table on Robo taxis - Market size and forecast 2025-2030 ($ million)
Chart on Robo taxis - Year-over-year growth 2025-2030 (%)
Data Table on Robo taxis - Year-over-year growth 2025-2030 (%)

8.4 Commercial vehicles - Market size and forecast 2025-2030

Chart on Commercial vehicles - Market size and forecast 2025-2030 ($ million)
Data Table on Commercial vehicles - Market size and forecast 2025-2030 ($ million)
Chart on Commercial vehicles - Year-over-year growth 2025-2030 (%)
Data Table on Commercial vehicles - Year-over-year growth 2025-2030 (%)

8.5 Passenger cars - Market size and forecast 2025-2030

Chart on Passenger cars - Market size and forecast 2025-2030 ($ million)
Data Table on Passenger cars - Market size and forecast 2025-2030 ($ million)
Chart on Passenger cars - Year-over-year growth 2025-2030 (%)
Data Table on Passenger cars - Year-over-year growth 2025-2030 (%)

8.6 Others - Market size and forecast 2025-2030

Chart on Others - Market size and forecast 2025-2030 ($ million)
Data Table on Others - Market size and forecast 2025-2030 ($ million)
Chart on Others - Year-over-year growth 2025-2030 (%)
Data Table on Others - Year-over-year growth 2025-2030 (%)

8.7 Market opportunity by Vehicle Type

Market opportunity by Vehicle Type ($ million)
Data Table on Market opportunity by Vehicle Type ($ million)

9. Market Segmentation by Component

9.1 Market segments

Chart on Component - Market share 2025-2030 (%)
Data Table on Component - Market share 2025-2030 (%)

9.2 Comparison by Component

Chart on Comparison by Component
Data Table on Comparison by Component

9.3 Hardware - Market size and forecast 2025-2030

Chart on Hardware - Market size and forecast 2025-2030 ($ million)
Data Table on Hardware - Market size and forecast 2025-2030 ($ million)
Chart on Hardware - Year-over-year growth 2025-2030 (%)
Data Table on Hardware - Year-over-year growth 2025-2030 (%)

9.4 Software - Market size and forecast 2025-2030

Chart on Software - Market size and forecast 2025-2030 ($ million)
Data Table on Software - Market size and forecast 2025-2030 ($ million)
Chart on Software - Year-over-year growth 2025-2030 (%)
Data Table on Software - Year-over-year growth 2025-2030 (%)

9.5 Services - Market size and forecast 2025-2030

Chart on Services - Market size and forecast 2025-2030 ($ million)
Data Table on Services - Market size and forecast 2025-2030 ($ million)
Chart on Services - Year-over-year growth 2025-2030 (%)
Data Table on Services - Year-over-year growth 2025-2030 (%)

9.6 Market opportunity by Component

Market opportunity by Component ($ million)
Data Table on Market opportunity by Component ($ million)

10. Market Segmentation by Propulsion

10.1 Market segments

Chart on Propulsion - Market share 2025-2030 (%)
Data Table on Propulsion - Market share 2025-2030 (%)

10.2 Comparison by Propulsion

Chart on Comparison by Propulsion
Data Table on Comparison by Propulsion

10.3 Electric - Market size and forecast 2025-2030

Chart on Electric - Market size and forecast 2025-2030 ($ million)
Data Table on Electric - Market size and forecast 2025-2030 ($ million)
Chart on Electric - Year-over-year growth 2025-2030 (%)
Data Table on Electric - Year-over-year growth 2025-2030 (%)

10.4 Hybrid - Market size and forecast 2025-2030

Chart on Hybrid - Market size and forecast 2025-2030 ($ million)
Data Table on Hybrid - Market size and forecast 2025-2030 ($ million)
Chart on Hybrid - Year-over-year growth 2025-2030 (%)
Data Table on Hybrid - Year-over-year growth 2025-2030 (%)

10.5 Internal combustion engine - Market size and forecast 2025-2030

Chart on Internal combustion engine - Market size and forecast 2025-2030 ($ million)
Data Table on Internal combustion engine - Market size and forecast 2025-2030 ($ million)
Chart on Internal combustion engine - Year-over-year growth 2025-2030 (%)
Data Table on Internal combustion engine - Year-over-year growth 2025-2030 (%)

10.6 Market opportunity by Propulsion

Market opportunity by Propulsion ($ million)
Data Table on Market opportunity by Propulsion ($ million)

11. Customer Landscape

11.1 Customer landscape overview

Analysis of price sensitivity, lifecycle, customer purchase basket, adoption rates, and purchase criteria

12. Geographic Landscape

12.1 Geographic segmentation

Chart on Market share by geography 2025-2030 (%)
Data Table on Market share by geography 2025-2030 (%)

12.2 Geographic comparison

Chart on Geographic comparison
Data Table on Geographic comparison

12.3 North America - Market size and forecast 2025-2030

Chart on North America - Market size and forecast 2025-2030 ($ million)
Data Table on North America - Market size and forecast 2025-2030 ($ million)
Chart on North America - Year-over-year growth 2025-2030 (%)
Data Table on North America - Year-over-year growth 2025-2030 (%)
Chart on Regional Comparison - North America
Data Table on Regional Comparison - North America

12.3.1 US - Market size and forecast 2025-2030

Chart on US - Market size and forecast 2025-2030 ($ million)
Data Table on US - Market size and forecast 2025-2030 ($ million)
Chart on US - Year-over-year growth 2025-2030 (%)
Data Table on US - Year-over-year growth 2025-2030 (%)

12.3.2 Canada - Market size and forecast 2025-2030

Chart on Canada - Market size and forecast 2025-2030 ($ million)
Data Table on Canada - Market size and forecast 2025-2030 ($ million)
Chart on Canada - Year-over-year growth 2025-2030 (%)
Data Table on Canada - Year-over-year growth 2025-2030 (%)

12.3.3 Mexico - Market size and forecast 2025-2030

Chart on Mexico - Market size and forecast 2025-2030 ($ million)
Data Table on Mexico - Market size and forecast 2025-2030 ($ million)
Chart on Mexico - Year-over-year growth 2025-2030 (%)
Data Table on Mexico - Year-over-year growth 2025-2030 (%)

12.4 Europe - Market size and forecast 2025-2030

Chart on Europe - Market size and forecast 2025-2030 ($ million)
Data Table on Europe - Market size and forecast 2025-2030 ($ million)
Chart on Europe - Year-over-year growth 2025-2030 (%)
Data Table on Europe - Year-over-year growth 2025-2030 (%)
Chart on Regional Comparison - Europe
Data Table on Regional Comparison - Europe

12.4.1 Germany - Market size and forecast 2025-2030

Chart on Germany - Market size and forecast 2025-2030 ($ million)
Data Table on Germany - Market size and forecast 2025-2030 ($ million)
Chart on Germany - Year-over-year growth 2025-2030 (%)
Data Table on Germany - Year-over-year growth 2025-2030 (%)

12.4.2 UK - Market size and forecast 2025-2030

Chart on UK - Market size and forecast 2025-2030 ($ million)
Data Table on UK - Market size and forecast 2025-2030 ($ million)
Chart on UK - Year-over-year growth 2025-2030 (%)
Data Table on UK - Year-over-year growth 2025-2030 (%)

12.4.3 France - Market size and forecast 2025-2030

Chart on France - Market size and forecast 2025-2030 ($ million)
Data Table on France - Market size and forecast 2025-2030 ($ million)
Chart on France - Year-over-year growth 2025-2030 (%)
Data Table on France - Year-over-year growth 2025-2030 (%)

12.4.4 Italy - Market size and forecast 2025-2030

Chart on Italy - Market size and forecast 2025-2030 ($ million)
Data Table on Italy - Market size and forecast 2025-2030 ($ million)
Chart on Italy - Year-over-year growth 2025-2030 (%)
Data Table on Italy - Year-over-year growth 2025-2030 (%)

12.4.5 The Netherlands - Market size and forecast 2025-2030

Chart on The Netherlands - Market size and forecast 2025-2030 ($ million)
Data Table on The Netherlands - Market size and forecast 2025-2030 ($ million)
Chart on The Netherlands - Year-over-year growth 2025-2030 (%)
Data Table on The Netherlands - Year-over-year growth 2025-2030 (%)

12.4.6 Spain - Market size and forecast 2025-2030

Chart on Spain - Market size and forecast 2025-2030 ($ million)
Data Table on Spain - Market size and forecast 2025-2030 ($ million)
Chart on Spain - Year-over-year growth 2025-2030 (%)
Data Table on Spain - Year-over-year growth 2025-2030 (%)

12.5 APAC - Market size and forecast 2025-2030

Chart on APAC - Market size and forecast 2025-2030 ($ million)
Data Table on APAC - Market size and forecast 2025-2030 ($ million)
Chart on APAC - Year-over-year growth 2025-2030 (%)
Data Table on APAC - Year-over-year growth 2025-2030 (%)
Chart on Regional Comparison - APAC
Data Table on Regional Comparison - APAC

12.5.1 China - Market size and forecast 2025-2030

Chart on China - Market size and forecast 2025-2030 ($ million)
Data Table on China - Market size and forecast 2025-2030 ($ million)
Chart on China - Year-over-year growth 2025-2030 (%)
Data Table on China - Year-over-year growth 2025-2030 (%)

12.5.2 Japan - Market size and forecast 2025-2030

Chart on Japan - Market size and forecast 2025-2030 ($ million)
Data Table on Japan - Market size and forecast 2025-2030 ($ million)
Chart on Japan - Year-over-year growth 2025-2030 (%)
Data Table on Japan - Year-over-year growth 2025-2030 (%)

12.5.3 South Korea - Market size and forecast 2025-2030

Chart on South Korea - Market size and forecast 2025-2030 ($ million)
Data Table on South Korea - Market size and forecast 2025-2030 ($ million)
Chart on South Korea - Year-over-year growth 2025-2030 (%)
Data Table on South Korea - Year-over-year growth 2025-2030 (%)

12.5.4 India - Market size and forecast 2025-2030

Chart on India - Market size and forecast 2025-2030 ($ million)
Data Table on India - Market size and forecast 2025-2030 ($ million)
Chart on India - Year-over-year growth 2025-2030 (%)
Data Table on India - Year-over-year growth 2025-2030 (%)

12.5.5 Australia - Market size and forecast 2025-2030

Chart on Australia - Market size and forecast 2025-2030 ($ million)
Data Table on Australia - Market size and forecast 2025-2030 ($ million)
Chart on Australia - Year-over-year growth 2025-2030 (%)
Data Table on Australia - Year-over-year growth 2025-2030 (%)

12.5.6 Indonesia - Market size and forecast 2025-2030

Chart on Indonesia - Market size and forecast 2025-2030 ($ million)
Data Table on Indonesia - Market size and forecast 2025-2030 ($ million)
Chart on Indonesia - Year-over-year growth 2025-2030 (%)
Data Table on Indonesia - Year-over-year growth 2025-2030 (%)

12.6 Middle East and Africa - Market size and forecast 2025-2030

Chart on Middle East and Africa - Market size and forecast 2025-2030 ($ million)
Data Table on Middle East and Africa - Market size and forecast 2025-2030 ($ million)
Chart on Middle East and Africa - Year-over-year growth 2025-2030 (%)
Data Table on Middle East and Africa - Year-over-year growth 2025-2030 (%)
Chart on Regional Comparison - Middle East and Africa
Data Table on Regional Comparison - Middle East and Africa

12.6.1 Saudi Arabia - Market size and forecast 2025-2030

Chart on Saudi Arabia - Market size and forecast 2025-2030 ($ million)
Data Table on Saudi Arabia - Market size and forecast 2025-2030 ($ million)
Chart on Saudi Arabia - Year-over-year growth 2025-2030 (%)
Data Table on Saudi Arabia - Year-over-year growth 2025-2030 (%)

12.6.2 UAE - Market size and forecast 2025-2030

Chart on UAE - Market size and forecast 2025-2030 ($ million)
Data Table on UAE - Market size and forecast 2025-2030 ($ million)
Chart on UAE - Year-over-year growth 2025-2030 (%)
Data Table on UAE - Year-over-year growth 2025-2030 (%)

12.6.3 South Africa - Market size and forecast 2025-2030

Chart on South Africa - Market size and forecast 2025-2030 ($ million)
Data Table on South Africa - Market size and forecast 2025-2030 ($ million)
Chart on South Africa - Year-over-year growth 2025-2030 (%)
Data Table on South Africa - Year-over-year growth 2025-2030 (%)

12.6.4 Israel - Market size and forecast 2025-2030

Chart on Israel - Market size and forecast 2025-2030 ($ million)
Data Table on Israel - Market size and forecast 2025-2030 ($ million)
Chart on Israel - Year-over-year growth 2025-2030 (%)
Data Table on Israel - Year-over-year growth 2025-2030 (%)

12.6.5 Turkey - Market size and forecast 2025-2030

Chart on Turkey - Market size and forecast 2025-2030 ($ million)
Data Table on Turkey - Market size and forecast 2025-2030 ($ million)
Chart on Turkey - Year-over-year growth 2025-2030 (%)
Data Table on Turkey - Year-over-year growth 2025-2030 (%)

12.7 South America - Market size and forecast 2025-2030

Chart on South America - Market size and forecast 2025-2030 ($ million)
Data Table on South America - Market size and forecast 2025-2030 ($ million)
Chart on South America - Year-over-year growth 2025-2030 (%)
Data Table on South America - Year-over-year growth 2025-2030 (%)
Chart on Regional Comparison - South America
Data Table on Regional Comparison - South America

12.7.1 Brazil - Market size and forecast 2025-2030

Chart on Brazil - Market size and forecast 2025-2030 ($ million)
Data Table on Brazil - Market size and forecast 2025-2030 ($ million)
Chart on Brazil - Year-over-year growth 2025-2030 (%)
Data Table on Brazil - Year-over-year growth 2025-2030 (%)

12.7.2 Argentina - Market size and forecast 2025-2030

Chart on Argentina - Market size and forecast 2025-2030 ($ million)
Data Table on Argentina - Market size and forecast 2025-2030 ($ million)
Chart on Argentina - Year-over-year growth 2025-2030 (%)
Data Table on Argentina - Year-over-year growth 2025-2030 (%)

12.7.3 Colombia - Market size and forecast 2025-2030

Chart on Colombia - Market size and forecast 2025-2030 ($ million)
Data Table on Colombia - Market size and forecast 2025-2030 ($ million)
Chart on Colombia - Year-over-year growth 2025-2030 (%)
Data Table on Colombia - Year-over-year growth 2025-2030 (%)

12.8 Market opportunity by geography

Market opportunity by geography ($ million)
Data Tables on Market opportunity by geography ($ million)

13. Drivers, Challenges, and Opportunity

13.1 Market drivers

Technological advancements in perception and artificial intelligence
Supportive regulatory policies and government investments
Economic viability and emerging market demand

13.2 Market challenges

Navigating labyrinth of regulatory and legal frameworks
Confronting technological complexity and infrastructural deficits
Overcoming public skepticism and pervasive safety concerns

13.3 Impact of drivers and challenges

Impact of drivers and challenges in 2025 and 2030

13.4 Market opportunities

Advancements in sensor technology and artificial intelligence
Expansion of commercial applications and strategic partnerships
Evolving regulatory frameworks and government initiatives

14. Competitive Landscape

14.1 Overview

14.2

Overview on criticality of inputs and factors of differentiation

14.3 Landscape disruption

Overview on factors of disruption

14.4 Industry risks

Impact of key risks on business

15. Competitive Analysis

15.1 Companies profiled

Companies covered

15.2 Company ranking index

15.3 Market positioning of companies

Matrix on companies position and classification

15.4 AB Volvo

AB Volvo - Overview
AB Volvo - Business segments
AB Volvo - Key news
AB Volvo - Key offerings
AB Volvo - Segment focus
SWOT

15.5 Aptiv Plc

Aptiv Plc - Overview
Aptiv Plc - Business segments
Aptiv Plc - Key news
Aptiv Plc - Key offerings
Aptiv Plc - Segment focus
SWOT

15.6 Aurora Innovation Inc.

Aurora Innovation Inc. - Overview
Aurora Innovation Inc. - Product / Service
Aurora Innovation Inc. - Key offerings
SWOT

15.7 AutoX Inc.

AutoX Inc. - Overview
AutoX Inc. - Product / Service
AutoX Inc. - Key offerings
SWOT

15.8 Baidu Inc.

Baidu Inc. - Overview
Baidu Inc. - Business segments
Baidu Inc. - Key offerings
Baidu Inc. - Segment focus
SWOT

15.9 Mercedes Benz Group AG

Mercedes Benz Group AG - Overview
Mercedes Benz Group AG - Product / Service
Mercedes Benz Group AG - Key offerings
SWOT

15.10 Mobileye Technologies Ltd.

Mobileye Technologies Ltd. - Overview
Mobileye Technologies Ltd. - Product / Service
Mobileye Technologies Ltd. - Key offerings
SWOT

15.11 Motional Inc.

Motional Inc. - Overview
Motional Inc. - Product / Service
Motional Inc. - Key offerings
SWOT

15.12 Nuro Inc.

Nuro Inc. - Overview
Nuro Inc. - Product / Service
Nuro Inc. - Key offerings
SWOT

15.13 Pony.ai

Pony.ai - Overview
Pony.ai - Product / Service
Pony.ai - Key offerings
SWOT

15.14 Toyota Motor Corp.

Toyota Motor Corp. - Overview
Toyota Motor Corp. - Business segments
Toyota Motor Corp. - Key news
Toyota Motor Corp. - Key offerings
Toyota Motor Corp. - Segment focus
SWOT

15.15 Volkswagen AG

Volkswagen AG - Overview
Volkswagen AG - Business segments
Volkswagen AG - Key news
Volkswagen AG - Key offerings
Volkswagen AG - Segment focus
SWOT

15.16 Waymo LLC

Waymo LLC - Overview
Waymo LLC - Product / Service
Waymo LLC - Key offerings
SWOT

15.17 WeRide

WeRide - Overview
WeRide - Product / Service
WeRide - Key offerings
SWOT

15.18 ZF Friedrichshafen AG

ZF Friedrichshafen AG - Overview
ZF Friedrichshafen AG - Business segments
ZF Friedrichshafen AG - Key news
ZF Friedrichshafen AG - Key offerings
ZF Friedrichshafen AG - Segment focus
SWOT

16. Appendix

16.1 Scope of the report

Market definition
Objectives
Notes and caveats

16.2 Inclusions and exclusions checklist

Inclusions checklist
Exclusions checklist

16.3 Currency conversion rates for US$

16.4 Research methodology

16.5 Data procurement

Information sources

16.6 Data validation

16.7 Validation techniques employed for market sizing

16.8 Data synthesis

16.9 360 degree market analysis

16.10 List of abbreviations

Research Methodology

Technavio presents a detailed picture of the market by way of study, synthesis, and summation of data from multiple sources. The analysts have presented the various facets of the market with a particular focus on identifying the key industry influencers. The data thus presented is comprehensive, reliable, and the result of extensive research, both primary and secondary.

INFORMATION SOURCES

Primary sources

  • Manufacturers and suppliers
  • Channel partners
  • Industry experts
  • Strategic decision makers

Secondary sources

  • Industry journals and periodicals
  • Government data
  • Financial reports of key industry players
  • Historical data
  • Press releases

DATA ANALYSIS

Data Synthesis

  • Collation of data
  • Estimation of key figures
  • Analysis of derived insights

Data Validation

  • Triangulation with data models
  • Reference against proprietary databases
  • Corroboration with industry experts

REPORT WRITING

Qualitative

  • Market drivers
  • Market challenges
  • Market trends
  • Five forces analysis

Quantitative

  • Market size and forecast
  • Market segmentation
  • Geographical insights
  • Competitive landscape

Interested in this report?

Get your sample now to see our research methodology and insights!

Download Now

Frequently Asked Questions

Level 4 Autonomous Vehicles market growth will increase by USD 2820.4 million during 2026-2030 .

The Level 4 Autonomous Vehicles market is expected to grow at a CAGR of 38.2% during 2026-2030 .

Level 4 Autonomous Vehicles market is segmented by Vehicle type (Robo taxis, Commercial vehicles, Passenger cars, Others) Component (Hardware, Software, Services) Propulsion (Electric, Hybrid, Internal combustion engine)

AB Volvo, Aptiv Plc, Aurora Innovation Inc., AutoX Inc., Baidu Inc., BMW AG, Ford Motor Co., Mercedes Benz Group AG, Mobileye Technologies Ltd., Motional Inc., Nuro Inc., Pony.ai, Toyota Motor Corp., Volkswagen AG, Waymo LLC, WeRide, ZF Friedrichshafen AG are a few of the key vendors in the Level 4 Autonomous Vehicles market.

North America will register the highest growth rate of 40.8% among the other regions. Therefore, the Level 4 Autonomous Vehicles market in North America is expected to garner significant business opportunities for the vendors during the forecast period.

US, Canada, Mexico, Germany, UK, France, Italy, The Netherlands, Spain, China, Japan, South Korea, India, Australia, Indonesia, Saudi Arabia, UAE, South Africa, Israel, Turkey, Brazil, Argentina, Colombia

  • Technological advancements in perception and artificial intelligence is the driving factor this market.

The Level 4 Autonomous Vehicles market vendors should focus on grabbing business opportunities from the Vehicle type segment as it accounted for the largest market share in the base year.