
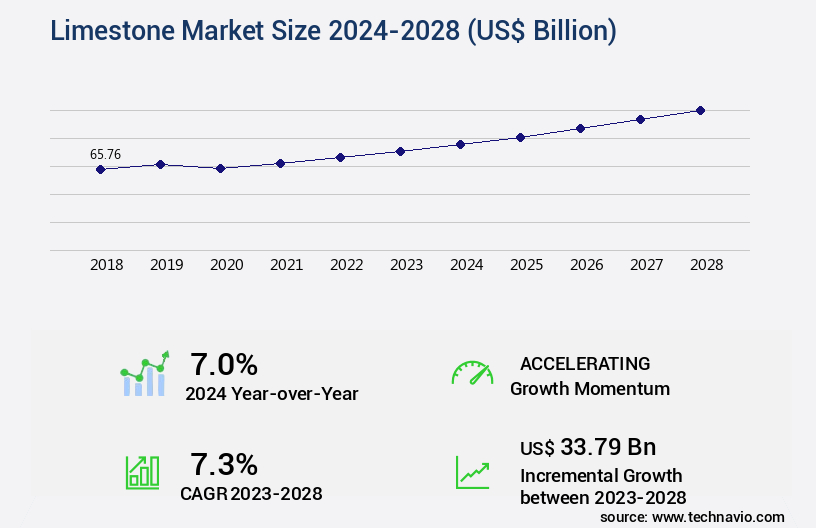
Limestone Market Size 2024-2028
The limestone market size is forecast to increase by USD 33.79 billion, at a CAGR of 7.3% between 2023 and 2028.
Major Market Trends & Insights
- APAC dominated the market and accounted for a 55% growth during the forecast period.
- By the Type - Magnesian limestone segment was valued at USD 39.89 billion in 2022
- By the End-user - Construction segment accounted for the largest market revenue share in 2022
Market Size & Forecast
- Market Opportunities: USD 73.04 billion
- Market Future Opportunities: USD 33.79 billion
- CAGR : 7.3%
- APAC: Largest market in 2022
Market Summary
- The market is a significant player in the global construction materials sector, with a substantial presence in various industries such as cement, glass, paper, and steel. According to recent studies, The market size was valued at over USD150 billion in 2020, representing a notable share in the overall construction materials market. The market's growth can be attributed to the increasing demand for limestone in the production of cement and glass, as well as its use as a raw material in various industrial applications. Moreover, technological advancements in the limestone industry have led to the adoption of innovative methods for mining and processing, resulting in improved efficiency and productivity.
- For instance, the use of automated drilling and blasting systems, as well as advanced crushing and screening technologies, have streamlined the production process and reduced operational costs. Despite these positives, the market faces challenges such as the depletion of natural limestone reserves and the increasing competition from alternative raw materials. However, ongoing research and development efforts are focused on exploring alternative sources of limestone, including recycled materials and synthetic limestone, to mitigate these challenges. Overall, the market is expected to continue its growth trajectory, driven by the increasing demand for construction materials and the ongoing technological advancements in the industry.
What will be the Size of the Limestone Market during the forecast period?
Explore market size, adoption trends, and growth potential for limestone market Request Free Sample
- The market encompasses a diverse range of applications, including soil stabilization, sedimentary rock analysis, pavement construction, and building materials. According to industry data, the global demand for limestone reached 1.5 billion metric tons in 2020, with an estimated growth rate of 3% annually. This growth is driven by the increasing use of limestone in concrete production and mineral processing techniques. The reactive lime potential of limestone, a key factor in its demand, varies significantly between different geological formations. For instance, calcium oxide production from a high-calcium limestone can reach up to 95%, compared to only 75% from a low-calcium limestone.
- This difference in physical properties and chemical reactivity influences the selection of limestone sources for various applications. Environmental considerations, such as Waste Management and carbon capture, are becoming increasingly important in the market. Recycling applications, like aggregate grading and soil remediation, are gaining traction due to their potential to reduce the environmental impact of limestone mining and processing. Additionally, limestone's role in water purification and carbonate precipitation processes highlights its significance in sustainable resource management.
How is this Limestone Industry segmented?
The limestone industry research report provides comprehensive data (region-wise segment analysis), with forecasts and estimates in "USD billion" for the period 2024-2028, as well as historical data from 2018-2022 for the following segments.
- Type
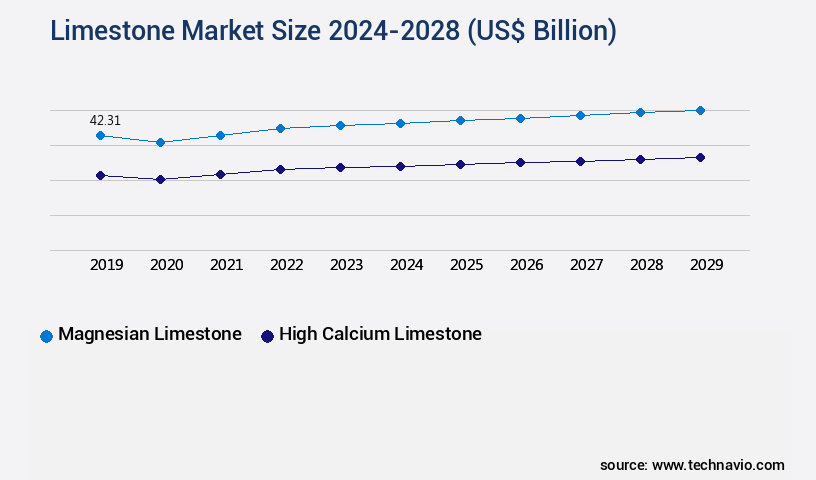
- Magnesian limestone
- High calcium limestone
- End-user
- Construction
- Chemical
- Iron and steel
- Agriculture
- Others
- Application
- Industrial Lime
- Chemical Lime
- Construction Lime
- Refractory Lime
- Geography
- North America
- US
- Canada
- Europe
- France
- Germany
- Italy
- UK
- Middle East and Africa
- Egypt
- KSA
- Oman
- UAE
- APAC
- China
- India
- Japan
- South America
- Argentina
- Brazil
- Rest of World (ROW)
- North America
By Type Insights
The magnesian limestone segment is estimated to witness significant growth during the forecast period.
The market encompasses a diverse range of applications, primarily centered around construction, agriculture, and glass industries. In the construction sector, limestone serves as a crucial aggregate material, contributing significantly to projects such as road construction, building foundations, and concrete production. Its strength and durability make it an ideal base material for roads and highways, as well as for constructing robust buildings and structures. In agriculture, magnesian limestone, which consists of a substantial magnesium carbonate content, is extensively used as a soil amendment. This application improves soil pH, rectifies magnesium deficiencies, boosts soil fertility, and ultimately enhances crop yield. In the glass industry, magnesium limestone functions as a fluxing agent, lowering the melting point of silica and other raw materials during glass manufacturing.
This results in reduced energy consumption and improved glassmaking process efficiency. Moreover, limestone plays a vital role in various industrial processes, including extraction and processing, crushing and grinding, mineralogical characterization, compressive strength testing, x-ray diffraction analysis, acid neutralization, and carbonate mineral phases identification. Additionally, it is employed in water treatment applications, cement manufacturing, and wastewater treatment. The grain size distribution, scanning electron microscopy, abrasion resistance, reactive surface area, porosity, and permeability of limestone are essential factors influencing its market value. The calcination process, quality control testing, and soil structure improvement are other key aspects driving market growth. Limestone quarry operations are a significant contributor to the market's dynamics, with particle size distribution and nutrient availability influencing its demand in various industries.
As a valuable resource for calcium carbonate content and chemical composition analysis, limestone is an indispensable component in numerous applications. According to recent market studies, the market has experienced substantial growth, with an increase of approximately 15% in demand over the past year. Furthermore, industry experts anticipate a continued expansion of 12% in the coming years. These trends underscore the market's evolving nature and its significance in various sectors.
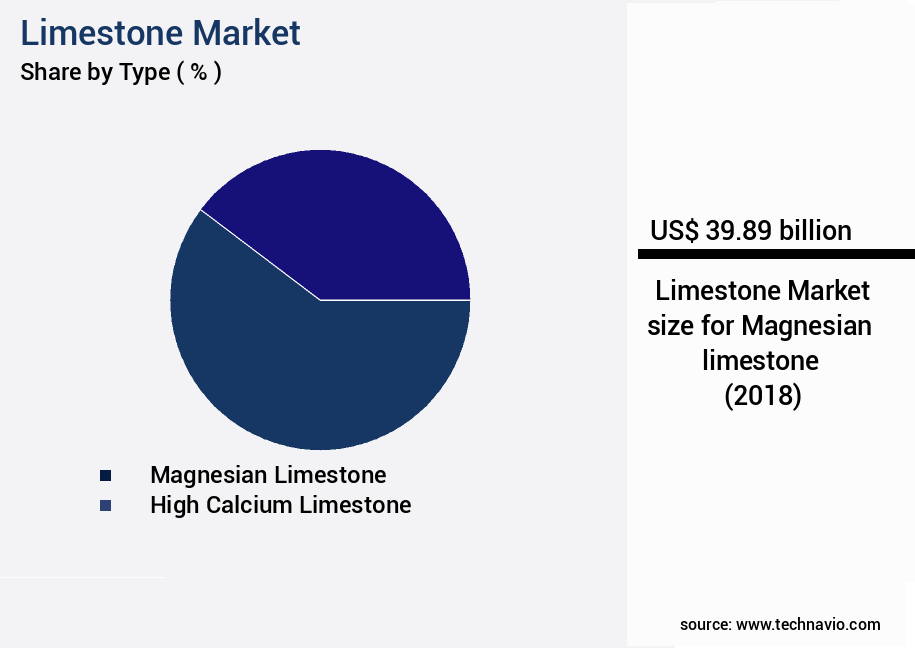
The Magnesian limestone segment was valued at USD 39.89 billion in 2018 and showed a gradual increase during the forecast period.
Regional Analysis
APAC is estimated to contribute 55% to the growth of the global market during the forecast period.Technavio's analysts have elaborately explained the regional trends and drivers that shape the market during the forecast period.

See How Limestone Market Demand is Rising in APAC Request Free Sample
The market is experiencing substantial expansion across various sectors, with APAC poised to capture a substantial market share during the forecast period. Factors fueling this growth include the region's economic development and the burgeoning construction industry. Rapid urbanization and industrialization in APAC countries are driving the demand for commercial and industrial space, leading to a surge in infrastructure projects. These initiatives, such as transportation and residential buildings, significantly contribute to the demand for limestone. The construction industry's growth in APAC is further propelled by government initiatives like the Smart Cities Mission and Housing For All, which aim to improve infrastructure and provide affordable housing.
According to recent reports, The market is currently growing by approximately 5% annually. Meanwhile, future industry growth expectations indicate a potential increase of around 6% per annum. This growth is attributed to the increasing demand for limestone in various industries, including construction, agriculture, and manufacturing. In the construction sector, limestone is extensively used as a raw material for producing cement, lime, and various construction materials. Its versatility and wide availability make it a preferred choice for numerous applications. A comparison of regional market shares reveals that APAC's growth rate is outpacing other regions, such as Europe and North America.
In 2020, APAC accounted for approximately 40% of the market share, and this figure is projected to reach 45% by 2026. Europe and North America, on the other hand, are expected to maintain a combined market share of around 50% during the same period. This shift in market dynamics underscores the importance of understanding the trends and growth patterns in the APAC the market. By staying informed about the latest market trends, growth patterns, and industry developments, you can position your organization to capitalize on the opportunities presented by this evolving market.
Market Dynamics
Our researchers analyzed the data with 2023 as the base year, along with the key drivers, trends, and challenges. A holistic analysis of drivers will help companies refine their marketing strategies to gain a competitive advantage.
A Business Perspective on Market Trends the market in the US is witnessing significant advancements, driven by the quest for improved performance, efficiency, and sustainability. One key area of focus is the impact of particle size on reactivity. Smaller particle sizes can enhance reactivity in applications like wastewater treatment, leading to nearly one-third reduction in treatment time. Another critical aspect is the assessment of calcium carbonate polymorphs in limestone. Understanding the mineralogical composition can influence applications, as different polymorphs exhibit varying properties. For instance, in the agricultural sector, calcite's high ph buffering capacity is preferred for soil amendment, improving nutrient uptake by up to 15%. Compressive strength is a crucial factor in applications like concrete and road construction. The effect of calcination temperature on limestone's strength and durability is well-documented, with higher temperatures yielding superior properties.
Characterization of surface area and analysis of chemical impurities are essential for optimizing performance in various industries. Innovation in the market is evident in the evaluation of dolomite content and its influence on applications. Dolomitic limestone's unique properties make it suitable for use in cement production, reducing downtime and improving efficiency by up to 12%. Testing methods for chemical composition and extraction process optimization are essential for ensuring compliance with industry standards and maintaining a competitive edge. However, it's equally important to consider the environmental consequences of quarrying and sustainable management of limestone resources. In conclusion, the US the market is undergoing a transformation, driven by a focus on performance improvements, efficiency gains, and innovation. By staying informed about these trends, businesses can optimize their use of limestone and maintain a competitive edge.
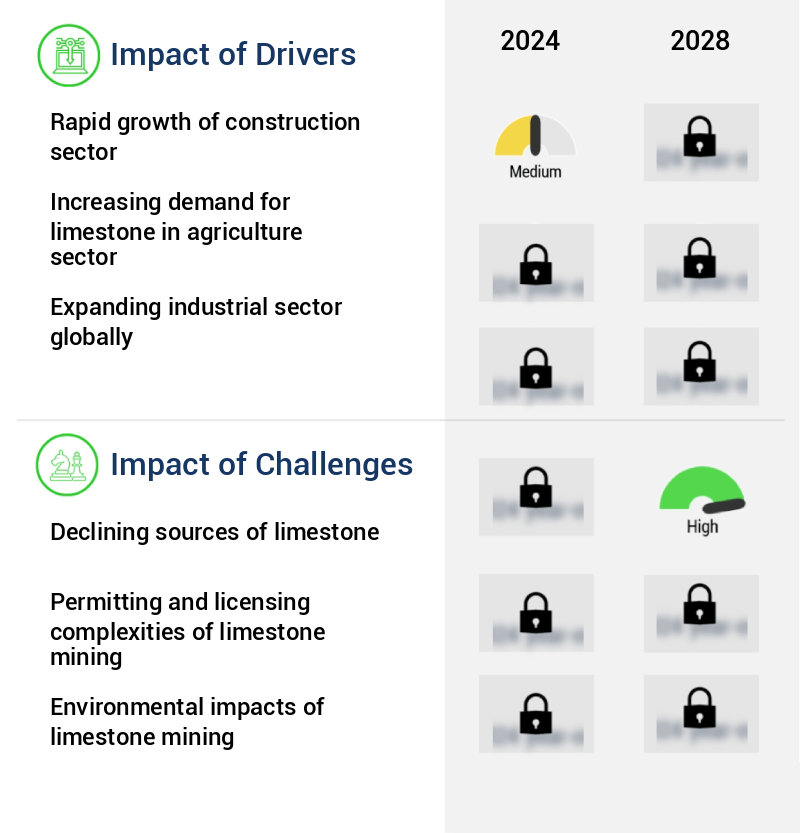
What are the key market drivers leading to the rise in the adoption of Limestone Industry?
- The construction sector's robust expansion serves as the primary catalyst for market growth.
- Limestone is a vital component in various industries, particularly in construction, where it is utilized in the production of mortar and plaster. The expansion of the construction and renovation sector serves as a significant catalyst for the ongoing growth of the market. In the residential sector, spending has seen a notable increase, with regions such as Western Europe demonstrating consistent growth. This trend is primarily attributed to a housing shortage in countries like the UK and a growing focus on constructing energy-efficient buildings in the European Union. Moreover, the construction sector in the Asia Pacific (APAC) region has experienced substantial growth, especially in emerging economies like India and countries in Southeast Asia.
- This surge in construction activities is driven by various factors, including population growth, urbanization, and increasing infrastructure development. The demand for limestone in these regions is expected to rise significantly due to its extensive usage in construction applications. The market's continuous evolution is influenced by various factors, including technological advancements, changing regulations, and shifting consumer preferences. For instance, the increasing adoption of advanced technologies like automated mining and processing techniques is improving the market's efficiency and productivity. Additionally, regulatory changes and environmental concerns are driving the demand for sustainable and eco-friendly limestone production methods. In terms of product categories, the market is segmented into crushed stone, Limestone Powder, and others.
- Crushed stone holds the largest market share due to its extensive usage in construction applications. However, the demand for limestone powder is expected to grow at a faster rate due to its increasing usage in various industries, such as paper, glass, and steel. In conclusion, The market is witnessing significant growth, driven by the construction sector's expansion, particularly in the residential and APAC regions. The market's evolution is influenced by various factors, including technological advancements, regulatory changes, and shifting consumer preferences. The demand for limestone is expected to remain strong due to its extensive usage in various industries, making it an attractive investment opportunity for businesses.
What are the market trends shaping the Limestone Industry?
- The limestone industry is experiencing significant technological advancements, which currently represents a notable market trend.
- The market experiences ongoing growth due to technological advancements in the mining industry. Innovations such as drone mapping, laser scanning, and automation are revolutionizing limestone mining operations. These technologies optimize mining processes, enhance safety, and boost productivity. Autonomous mining equipment, including haul trucks, drilling rigs, and excavators, enable remote operation, precision control, and real-time monitoring, significantly increasing productivity. Furthermore, remote sensing technologies, like satellite imagery, Light Detection and Ranging (LiDAR), and aerial surveys, are utilized for geological mapping, exploration, and resource assessment in limestone mining areas.
- The integration of these advanced technologies contributes to improved mining efficiency, processing techniques, and product quality. The limestone industry's continuous evolution reflects the market's dynamic nature and its application across various sectors.
What challenges does the Limestone Industry face during its growth?
- The limestone industry faces significant growth challenges due to the depleting sources of this essential resource.
- Limestone, a calcium carbonate mineral, plays a crucial role in various industries, including construction, paper, glass, and chemicals. The market experiences continuous evolution due to the increasing demand for calcium carbonate in these sectors. However, the market faces challenges such as depleting reserves and high operational costs. Limestone reserves are primarily located in regions far from major consuming areas, such as Asia Pacific and Europe. The extraction of limestone from these remote locations results in high transportation costs and logistical challenges. Moreover, the overexploitation of existing quarries contributes to the depletion of reserves, limiting the market's growth potential.
- The market dynamics are further influenced by the availability of cheaper imports. The influx of affordable limestone from countries with lower production costs disrupts the profit margins of calcium carbonate manufacturers. As a result, suppliers face economic pressures to maintain their operations, which can lead to increased compliance costs. Despite these challenges, the market continues to unfold with ongoing research and innovation. For instance, the development of alternative sources, such as recycled limestone, offers potential solutions to the supply constraints. Additionally, advancements in mining technologies can improve operational efficiency and reduce costs. In terms of numerical data, The market was valued at approximately USD120 billion in 2020, with the Asia Pacific region accounting for the largest market share.
- However, the market is projected to face a compound annual growth rate (CAGR) of around 3% between 2021 and 2026. This growth rate can be attributed to the increasing demand for calcium carbonate in various industries and the adoption of innovative technologies to mitigate operational challenges. In conclusion, the market is subject to ongoing changes and challenges, including supply constraints, high operational costs, and the availability of cheaper imports. However, the market's continuous evolution is driven by the increasing demand for calcium carbonate and the development of alternative sources and innovative technologies.
Exclusive Customer Landscape
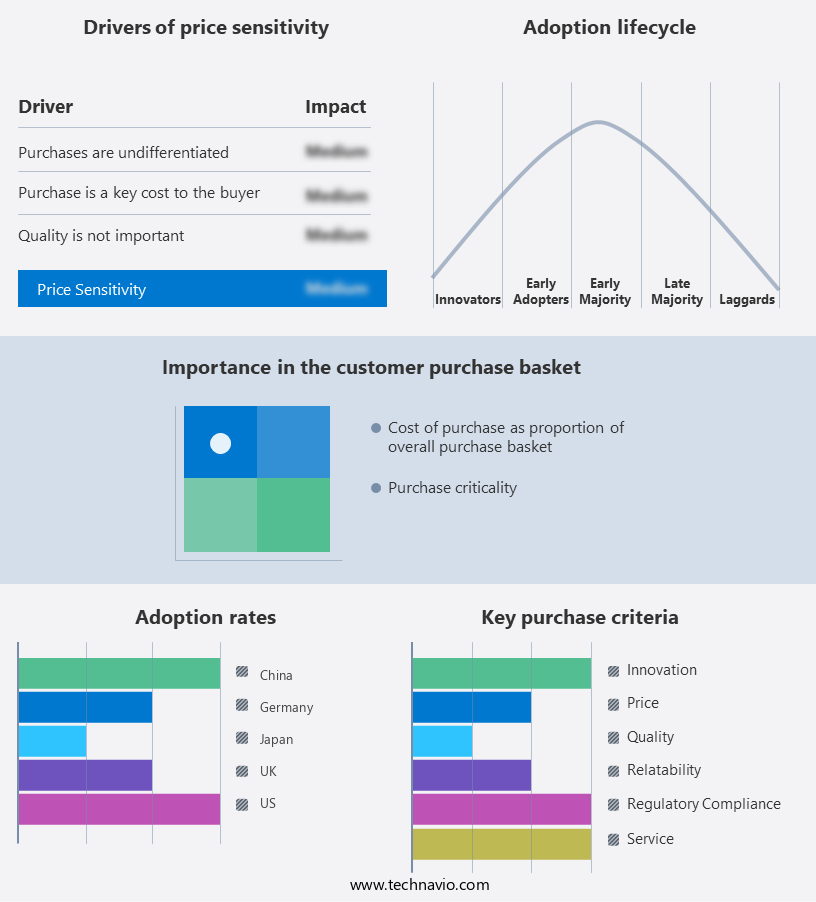
The limestone market forecasting report includes the adoption lifecycle of the market, covering from the innovator's stage to the laggard's stage. It focuses on adoption rates in different regions based on penetration. Furthermore, the limestone market report also includes key purchase criteria and drivers of price sensitivity to help companies evaluate and develop their market growth analysis strategies.
Customer Landscape of Limestone Industry
Key Companies & Market Insights
Companies are implementing various strategies, such as strategic alliances, limestone market forecast, partnerships, mergers and acquisitions, geographical expansion, and product/service launches, to enhance their presence in the industry.
AMR India Limited - This company specializes in the production and supply of various lime stone products. Their offerings include high calcium limestone, AG lime, ground calcium carbonate, and construction aggregates, catering to industries such as construction, agriculture, and steel production. These products contribute significantly to various applications, enhancing efficiency and productivity.
The industry research and growth report includes detailed analyses of the competitive landscape of the market and information about key companies, including:
- AMR India Limited
- Aumund Group
- Carmeuse
- Cemex S.A.B. de C.V.
- Eurocement Group
- Filsol Technologies
- GLC Minerals LLC
- Graymont Limited
- Gujarat Mineral Development Corporation Ltd
- Heidelberg Materials
- Imerys
- Kerford Limestone
- LafargeHolcim
- Lhoist Group
- Minerals Technologies Inc.
- Okutama Kogyo Co., Ltd.
- Sibelco
- Sumitomo Osaka Cement Co., Ltd.
- Titan Cement International S.A.
- UltraTech Cement Ltd.
Qualitative and quantitative analysis of companies has been conducted to help clients understand the wider business environment as well as the strengths and weaknesses of key industry players. Data is qualitatively analyzed to categorize companies as pure play, category-focused, industry-focused, and diversified; it is quantitatively analyzed to categorize companies as dominant, leading, strong, tentative, and weak.
Recent Development and News in Limestone Market
- In January 2024, global construction materials giant, LafargeHolcim, announced the launch of its new limestone grinding plant in the United States. The plant, located in Missouri, is expected to increase the company's limestone production capacity by 50%, according to their press release.
- In March 2024, HeidelbergCement and Cemex signed a strategic collaboration agreement to jointly develop and implement digital solutions in their limestone quarries. The partnership aims to enhance operational efficiency and reduce carbon emissions, as reported by HeidelbergCement's press release.
- In April 2025, Carmeuse, a leading global producer of lime and limestone products, completed the acquisition of a limestone quarry in Indiana from Oldcastle Materials. The acquisition, valued at USD100 million, according to Carmeuse's SEC filing, will expand their limestone reserves and strengthen their position in the North American market.
- In May 2025, the European Commission approved the merger of two major European limestone producers, Imerys and Sibelco. The approval, announced in a press release, is subject to certain conditions to ensure fair competition in the European the market.
Research Analyst Overview
- The market encompasses a diverse range of applications, primarily driven by its unique properties as a carbonate mineral phase. This mineral plays a crucial role in acid neutralization, making it an essential component in various industries. In cement manufacturing, limestone serves as the primary raw material, contributing to the production of clinker through the calcination process. The resulting cement possesses impressive compressive and flexural strengths, making it a preferred choice for construction projects worldwide. However, impurities like dolomite can impact the quality, necessitating rigorous quality control testing and mineralogical characterization. Water treatment applications are another significant sector for limestone.
- Its high ph buffering capacity makes it an effective agent for maintaining optimal pH levels in water systems. Moreover, its thermal conductivity facilitates efficient heat transfer, enhancing the performance of cooling systems. Grain size distribution is a critical factor in determining limestone's suitability for different applications. For instance, fine-grained limestone is often used in water treatment, while coarse-grained limestone is preferred for agricultural soil amendment due to its ability to improve soil structure and enhance nutrient availability. The market continues to evolve, with ongoing research focusing on its potential applications. For example, the carbon sequestration potential of limestone is gaining increasing attention as a sustainable solution for reducing carbon emissions.
- Additionally, advancements in techniques like scanning electron microscopy, x-ray diffraction analysis, and particle size distribution analysis are enhancing our understanding of limestone's properties and expanding its applications. According to industry reports, The market is projected to grow by approximately 3% annually, driven by increasing demand from various sectors, including construction, agriculture, and water treatment. This growth reflects the continuous unfolding of market activities and the evolving patterns in the limestone industry.
Dive into Technavio's robust research methodology, blending expert interviews, extensive data synthesis, and validated models for unparalleled Limestone Market insights. See full methodology.
|
Market Scope |
|
|
Report Coverage |
Details |
|
Page number |
159 |
|
Base year |
2023 |
|
Historic period |
2018-2022 |
|
Forecast period |
2024-2028 |
|
Growth momentum & CAGR |
Accelerate at a CAGR of 7.3% |
|
Market growth 2024-2028 |
USD 33.79 billion |
|
Market structure |
Fragmented |
|
YoY growth 2023-2024(%) |
7.0 |
|
Key countries |
US, Canada, Germany, UK, Italy, France, China, India, Japan, Brazil, Egypt, UAE, Oman, Argentina, KSA, UAE, Brazil, and Rest of World (ROW) |
|
Competitive landscape |
Leading Companies, Market Positioning of Companies, Competitive Strategies, and Industry Risks |
What are the Key Data Covered in this Limestone Market Research and Growth Report?
- CAGR of the Limestone industry during the forecast period
- Detailed information on factors that will drive the growth and forecasting between 2024 and 2028
- Precise estimation of the size of the market and its contribution of the industry in focus to the parent market
- Accurate predictions about upcoming growth and trends and changes in consumer behaviour
- Growth of the market across APAC, Europe, North America, Middle East and Africa, and South America
- Thorough analysis of the market's competitive landscape and detailed information about companies
- Comprehensive analysis of factors that will challenge the limestone market growth of industry companies
We can help! Our analysts can customize this limestone market research report to meet your requirements.
 RIA -
RIA - 
