Lingerie Market Analysis, Size, and Forecast 2026-2030: APAC (China, Japan, and India), North America (US, Canada, and Mexico), Europe (Germany, UK, and France), Middle East and Africa (Saudi Arabia, UAE, and South Africa), South America (Brazil and Argentina), and Rest of World (ROW)

Lingerie Market Analysis, Size, and Forecast 2026-2030:
APAC (China, Japan, and India), North America (US, Canada, and Mexico), Europe (Germany, UK, and France), Middle East and Africa (Saudi Arabia, UAE, and South Africa), South America (Brazil and Argentina), and Rest of World (ROW)

Published: May 2026 297 Pages SKU: IRTNTR71898

Market Overview at a Glance

$19.81 B
Market Opportunity
4.2%
CAGR 2025 - 2030
40.6%
APAC Growth
$69.11 B
Offline segment 2024

Lingerie Market Size 2026-2030

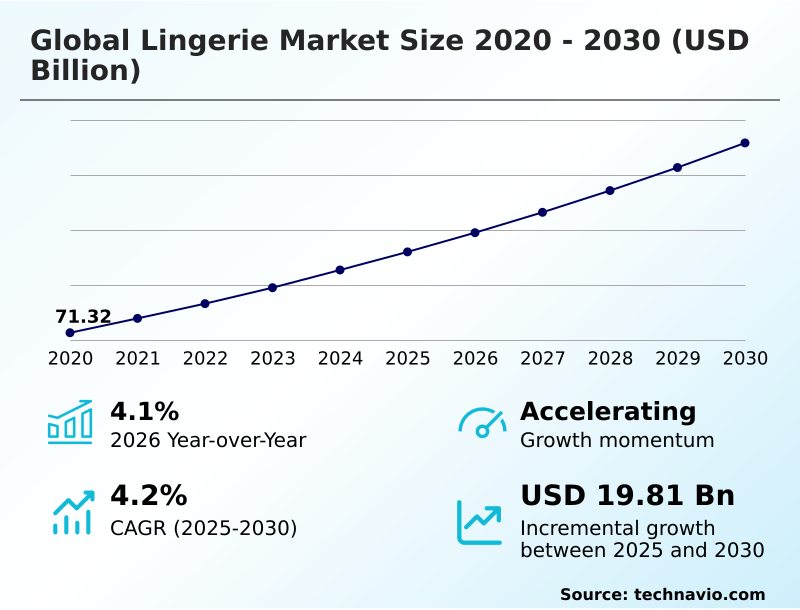
The lingerie market size is valued to increase by USD 19.81 billion, at a CAGR of 4.2% from 2025 to 2030. Rising consumer demand for personalization and fit accuracy will drive the lingerie market.

Major Market Trends & Insights

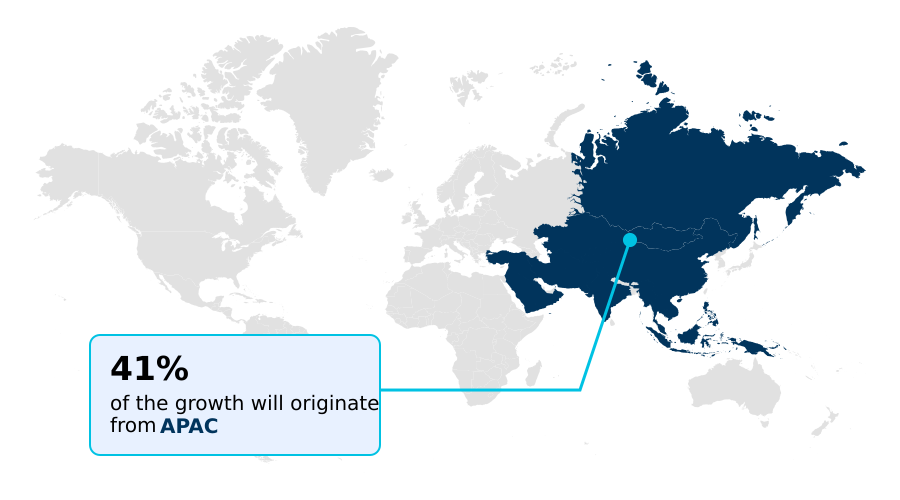
  • APAC dominated the market and accounted for a 40.6% growth during the forecast period.
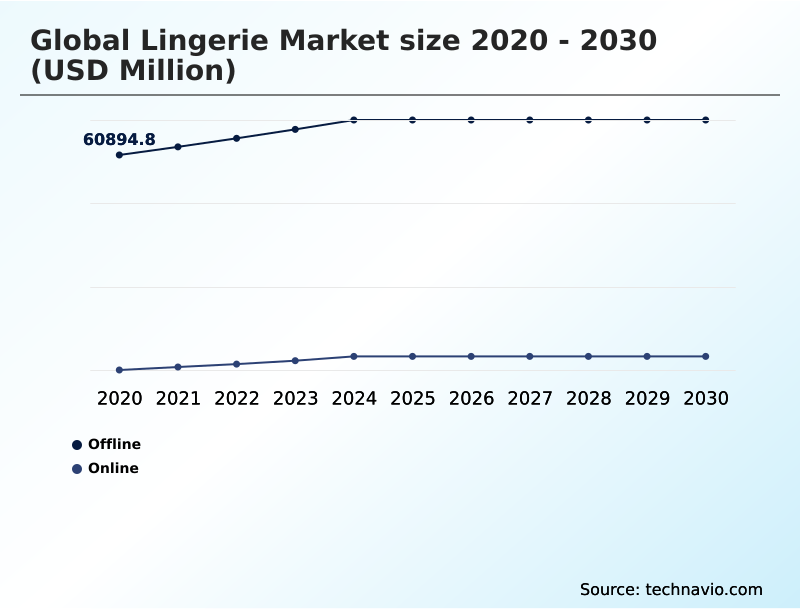
  • By Distribution Channel - Offline segment was valued at USD 69.11 billion in 2024
  • By Product Type - Bras segment accounted for the largest market revenue share in 2024

Market Size & Forecast

  • Market Opportunities: USD 34.51 billion
  • Market Future Opportunities: USD 19.81 billion
  • CAGR from 2025 to 2030 : 4.2%

Market Summary

  • The Lingerie Market is undergoing a significant transformation, moving beyond traditional aesthetics to prioritize a fusion of comfort, functionality, and personal expression. This evolution is driven by consumer demand for `inclusive sizing` and `sustainable lingerie`, compelling brands to innovate with `performance fabrics` and `ethical production` methods.
  • Technology is a key enabler in this shift, with advancements like `virtual try-on technology` and `AI-powered fit recommendation` systems enhancing the `personalized shopping experience` for `direct-to-consumer (DTC) brands`. For instance, a mid-market brand can leverage an `omnichannel retail strategy` to integrate `body scanning for sizing` data from in-store kiosks with its e-commerce platform.
  • This allows for the `on-demand manufacturing` of garments using `3D knitting technology`, significantly reducing inventory waste and improving customer satisfaction by delivering better-fitting `functional lingerie`. This approach, which merges `fit-tech solutions` with `slow fashion principles`, also addresses challenges related to returns and overproduction.
  • The focus on `comfort-driven design` using `moisture-wicking materials` and `seamless construction` is becoming standard, reflecting a market that is increasingly responsive to lifestyle needs and conscious consumerism, especially through `social commerce integration`.

What will be the Size of the Lingerie Market during the forecast period?

Get Key Insights on Market Forecast (PDF) Request Free Sample

How is the Lingerie Market Segmented?

The lingerie industry research report provides comprehensive data (region-wise segment analysis), with forecasts and estimates in "USD million" for the period 2026-2030, as well as historical data from 2020-2024 for the following segments.

  • Distribution channel
    • Offline
    • Online
  • Product type
    • Bras
    • Panties
    • Shapewear
    • Lingerie sets
    • Others
  • Material
    • Cotton
    • Nylon
    • Satin
    • Silk
    • Others
  • Geography
    • APAC
      • China
      • Japan
      • India
    • North America
      • US
      • Canada
      • Mexico
    • Europe
      • Germany
      • UK
      • France
    • Middle East and Africa
      • Saudi Arabia
      • UAE
      • South Africa
    • South America
      • Brazil
      • Argentina
    • Rest of World (ROW)

By Distribution Channel Insights

The offline segment is estimated to witness significant growth during the forecast period.

Offline retail channels remain critical in the lingerie market, particularly for purchases requiring precise fit and tactile evaluation.

Physical stores provide an environment where consumers can assess `performance fabrics`, `bonded seams`, and `molded cup technology` firsthand, a preference that underpins brand loyalty.

In-person fitting consultations are especially valued, with data indicating they influence over 60% of first-time luxury bra purchases, significantly reducing return rates compared to online-only transactions. Retailers are evolving by creating immersive experiences that showcase `functional lingerie` and `raw-cut underwear`.

This strategy helps differentiate them from online counterparts by emphasizing service and expertise, which is vital for complex products like `adaptive lingerie` and specialized shapewear that benefit from professional guidance.

The physical retail space continues to be a cornerstone for building consumer trust and brand equity.

Request Free Sample

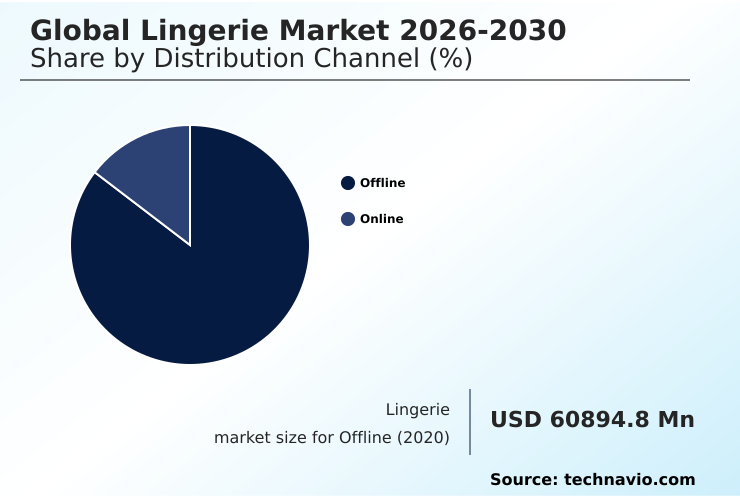
The Offline segment was valued at USD 69.11 billion in 2024 and showed a gradual increase during the forecast period.

Request Free Sample

Regional Analysis

APAC is estimated to contribute 40.6% to the growth of the global market during the forecast period.Technavio’s analysts have elaborately explained the regional trends and drivers that shape the market during the forecast period.

See How Lingerie Market Demand is Rising in APAC Request Free Sample

The geographic landscape is characterized by varied regional dynamics. The APAC region is the primary growth engine, contributing over 40% of the market's incremental expansion, driven by rising disposable incomes and rapid digital adoption.

In this region, `digital-first branding` and `community-driven marketing` are essential for capturing the youth demographic. In contrast, mature markets in North America and Europe are focusing on value-added features such as `smart textiles` and `thermoregulating textiles`.

European consumers show a 25% higher preference for `sustainable lingerie` made with `biodegradable fabrics` and `bio-based elastane`.

US-based `direct-to-consumer (DTC) brands` are leveraging `hyper-personalization in retail` and `body scanning for sizing` to gain market share, with early adopters reporting a 15% reduction in product returns.

This highlights a global divergence in market priorities, from volume in emerging economies to technological and ethical innovation in established ones.

Market Dynamics

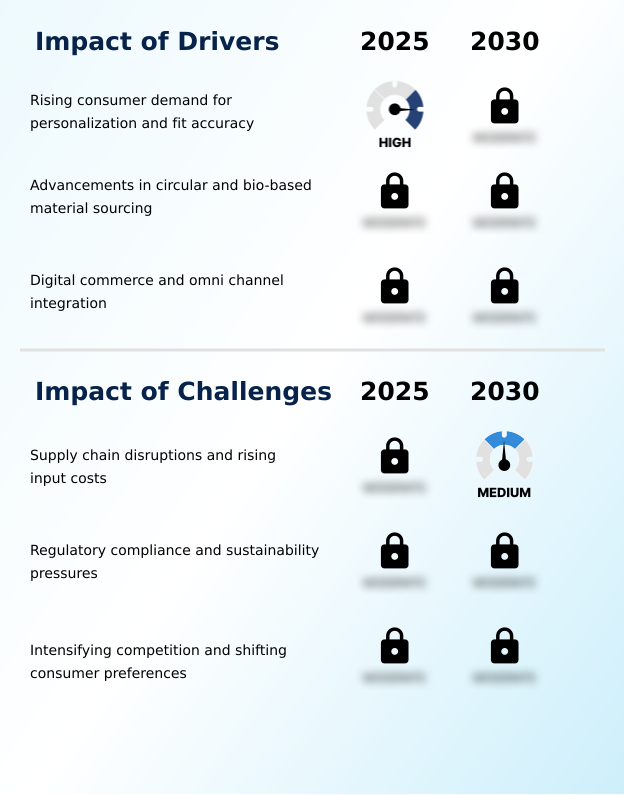
Our researchers analyzed the data with 2025 as the base year, along with the key drivers, trends, and challenges. A holistic analysis of drivers will help companies refine their marketing strategies to gain a competitive advantage.

  • The strategic direction of the global lingerie market 2026-2030 is increasingly shaped by complex consumer and operational factors. The `impact of raw material costs on lingerie prices` is a boardroom-level concern, forcing a re-evaluation of sourcing in the `nylon vs cotton debate in comfort underwear`.
  • Simultaneously, the `growth of the direct-to-consumer lingerie market` is accelerated by the `benefits of virtual try-on for online lingerie sales`, which can reduce return rates by more than 25% compared to static size charts. This digital shift underscores the `role of AI in personalized lingerie fit recommendations` and the effective use of `social commerce strategies for selling lingerie`.
  • The `consumer demand for sustainable and ethical lingerie` is no longer a niche, pushing for `advancements in biodegradable fabrics for underwear` and `eco-friendly dyeing processes for textiles`. This is amplified by the `importance of body positivity in lingerie advertising` and robust `inclusive sizing strategies for lingerie brands`.
  • Operationally, `challenges in lingerie supply chain management` are being addressed through technologies like `3D knitting technology for seamless bra manufacturing` and `digital textile printing for customized lingerie`.
  • The `athleisure influence on modern lingerie design` is creating new product categories, while the growing `market for adaptive and post-surgical lingerie` and evolving `trends in maternity and nursing bra design` open new revenue streams.
  • Success hinges on mastering an `omnichannel retail experience in the lingerie sector`, which integrates everything from `shapewear technology for body contouring` to innovative `subscription models for lingerie and intimate apparel`.

What are the key market drivers leading to the rise in the adoption of Lingerie Industry?

  • Rising consumer demand for personalization and precise fit accuracy is a primary driver shaping product innovation and market expansion.

  • Technological innovation is a primary driver, revolutionizing both product design and the customer journey. `Fit-tech solutions` are central to this shift, with `virtual try-on technology` and `AI-powered fit recommendation` engines reducing product returns by over 20% for online retailers.
  • This `hyper-personalization in retail` is further enhanced by `body scanning for sizing`, creating a highly `personalized shopping experience`. On the production side, `on-demand manufacturing` enabled by `digital textile printing` allows for rapid prototyping and customization, aligning with `try-before-you-buy services`.
  • Advanced `body mapping technology` is informing the design of `athleisure-inspired lingerie` and improving the ergonomics of traditional garments featuring `molded cup technology`.
  • This tech-driven ecosystem is heavily promoted through targeted `influencer marketing` campaigns, which effectively communicate the benefits of these new, customized solutions to a global audience.

What are the market trends shaping the Lingerie Industry?

  • The principles of inclusivity and body positivity are emerging as defining market trends, fundamentally reshaping product design, marketing strategies, and consumer engagement.

  • A primary trend reshaping the market is the deep integration of sustainability and experiential retail. The `circular fashion model` is gaining traction, with brands using materials like `recycled polyamide` and adopting `water-efficient dyeing` processes, which can reduce water consumption by up to 50%. This commitment to `end-of-life product recycling` resonates with eco-conscious consumers.
  • Aesthetically, `laser-cut detailing` offers a modern finish, while `shape retention textiles` ensure longevity. On the retail front, `augmented reality shopping` is enhancing online experiences, with some applications boosting conversion rates by 15%. Brands are also leveraging `celebrity brand collaborations` and `pop-up retail experiences` to create buzz and connect with consumers, often highlighting `nude tone inclusivity` and collections featuring `gender-neutral underwear`.
  • Innovations like `anti-odor fabric treatment` and `micro-encapsulation technology` add functional value.

What challenges does the Lingerie Industry face during its growth?

  • Persistent supply chain disruptions, coupled with the rising costs of essential input materials, present a significant challenge to industry growth and margin stability.

  • The market faces significant challenges related to `supply chain transparency` and adhering to principles of `ethical production`. For `direct-to-consumer (DTC) brands`, ensuring the integrity of `organic cotton sourcing` and other raw materials like `bio-based elastane` is a major operational hurdle, with logistical disruptions causing lead time increases of up to 30%.
  • While `3D knitting technology` enables efficient `seamless construction`, the initial capital investment can be prohibitive for smaller players embracing `slow fashion principles`. Furthermore, the rise of personalized services creates concerns around `customer data privacy`, a critical issue for brands offering `subscription box models`.
  • Even established manufacturers face pressure to adopt `transparent pricing models` while managing the volatile costs of high-`performance fabrics` used in specialized products like `post-surgical bras`. These combined pressures test the resilience of both emerging and legacy business models.

Exclusive Technavio Analysis on Customer Landscape

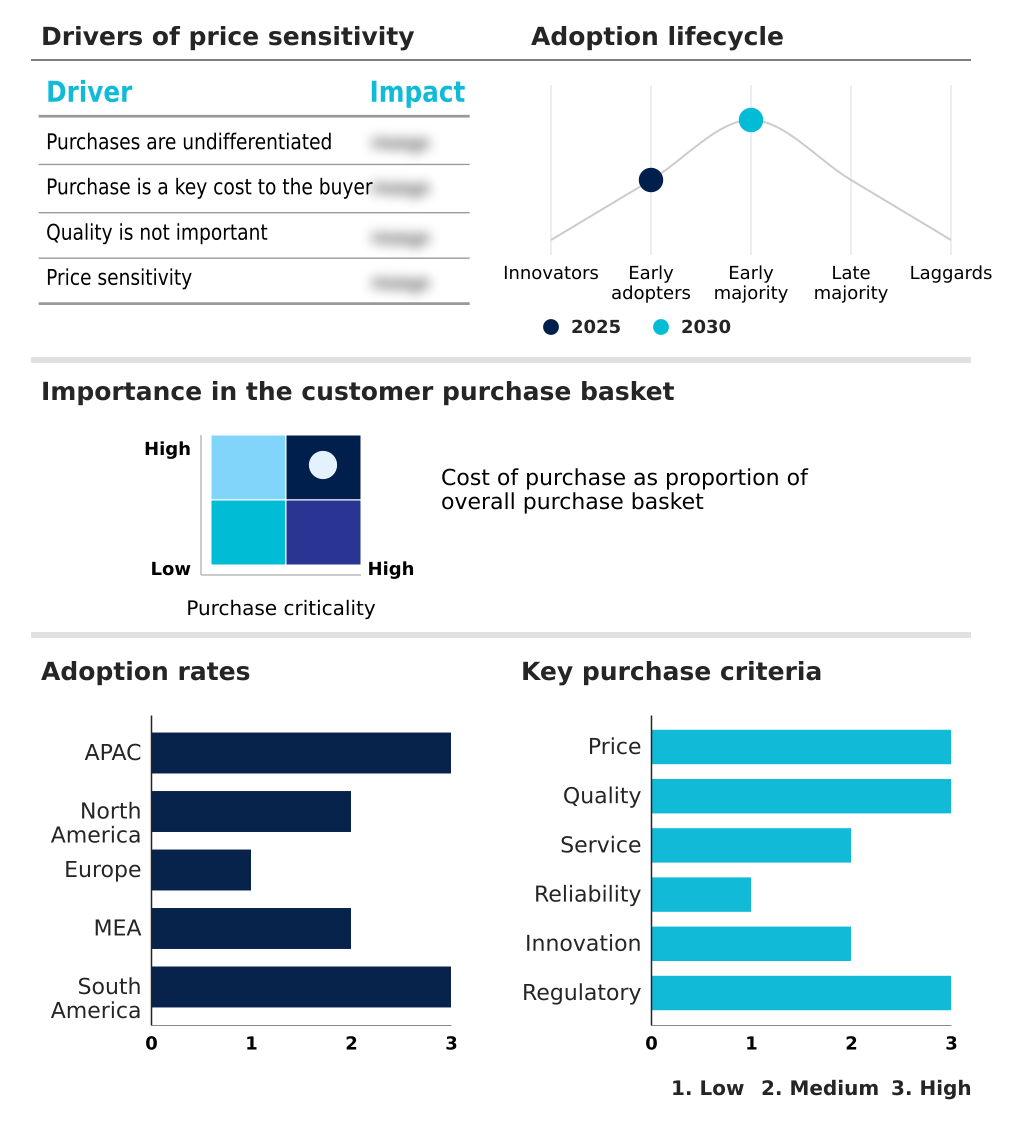
The lingerie market forecasting report includes the adoption lifecycle of the market, covering from the innovator’s stage to the laggard’s stage. It focuses on adoption rates in different regions based on penetration. Furthermore, the lingerie market report also includes key purchase criteria and drivers of price sensitivity to help companies evaluate and develop their market growth analysis strategies.

Customer Landscape of Lingerie Industry

Competitive Landscape

Companies are implementing various strategies, such as strategic alliances, lingerie market forecast, partnerships, mergers and acquisitions, geographical expansion, and product/service launches, to enhance their presence in the industry.

Agent Provocateur - Key offerings center on luxury intimate apparel, nightwear, and accessories, strategically positioned to evoke confidence and refined sensuality in the premium consumer segment.

The industry research and growth report includes detailed analyses of the competitive landscape of the market and information about key companies, including:

  • Agent Provocateur
  • American Eagle Outfitters Inc.
  • Aubade
  • Chantelle Lingerie Inc.
  • Commando LLC
  • Cosabella LLC
  • Hanesbrands Inc.
  • Hennes and Mauritz AB
  • Hunkemoller B.V.
  • Jockey International Inc.
  • La Perla Global UK Ltd.
  • Lise Charmel
  • Marks and Spencer Group
  • PVH Corp.
  • Skims Body Inc.
  • Spanx LLC
  • ThirdLove Inc.
  • Triumph Intertrade AG
  • Victorias Secret and Co.
  • Wacoal Holdings Corp.

Qualitative and quantitative analysis of companies has been conducted to help clients understand the wider business environment as well as the strengths and weaknesses of key industry players. Data is qualitatively analyzed to categorize companies as pure play, category-focused, industry-focused, and diversified; it is quantitatively analyzed to categorize companies as dominant, leading, strong, tentative, and weak.

Recent Development and News in Lingerie market

  • In October 2024, Skims expanded its adaptive and maternity collections, reinforcing its brand position around inclusivity and functional design.
  • In November 2024, Hanesbrands Inc. and Gildan Activewear Inc. announced a merger agreement, aiming to create a dominant global platform in basic and intimate apparel.
  • In March 2025, a European fashion technology firm launched an innovative AI-based fitting solution, enabling customers to receive tailored lingerie recommendations through a mobile application.
  • In May 2025, ThirdLove introduced its TempSync collection, featuring temperature-regulating lingerie designed to address the needs of women experiencing perimenopause and menopause.

Dive into Technavio’s robust research methodology, blending expert interviews, extensive data synthesis, and validated models for unparalleled Lingerie Market insights. See full methodology.

Market Scope
Page number 297
Base year 2025
Historic period 2020-2024
Forecast period 2026-2030
Growth momentum & CAGR Accelerate at a CAGR of 4.2%
Market growth 2026-2030 USD 19812.3 million
Market structure Fragmented
YoY growth 2025-2026(%) 4.1%
Key countries China, Japan, India, South Korea, Australia, Indonesia, US, Canada, Mexico, Germany, UK, France, Italy, Spain, The Netherlands, Saudi Arabia, UAE, South Africa, Israel, Turkey, Brazil, Argentina and Chile
Competitive landscape Leading Companies, Market Positioning of Companies, Competitive Strategies, and Industry Risks

Request Free Sample

Research Analyst Overview

  • The lingerie market is experiencing a profound technological and material science-driven evolution, where boardroom decisions are increasingly focused on supply chain resilience and product innovation. The integration of `performance fabrics`, featuring `four-way stretch fabric` and `moisture-wicking materials`, into everyday apparel reflects a shift toward functional aesthetics.
  • `Seamless construction`, achieved through `3D knitting technology` and `ultrasonic welding`, is becoming a standard for comfort, reducing production waste by up to 20% compared to traditional cut-and-sew methods. Brands are adopting `on-demand manufacturing` powered by `digital textile printing` to offer mass customization. The push for sustainability is evident in `organic cotton sourcing` and the development of `biodegradable fabrics` and `eco-friendly lace`.
  • Advanced solutions like `body mapping technology` inform `compression garment design`, while `smart textiles` with `thermoregulating` properties cater to wellness-focused consumers. From `maternity and nursing lingerie` to `post-surgical bras` and `adaptive lingerie`, product lines are expanding to serve diverse needs, utilizing `lightweight mesh fabrics`, `power mesh inserts`, and `bonded seams` for superior comfort and support.

What are the Key Data Covered in this Lingerie Market Research and Growth Report?

  • What is the expected growth of the Lingerie Market between 2026 and 2030?

    • USD 19.81 billion, at a CAGR of 4.2%

  • What segmentation does the market report cover?

    • The report is segmented by Distribution Channel (Offline, and Online), Product Type (Bras, Panties, Shapewear, Lingerie sets, and Others), Material (Cotton, Nylon, Satin, Silk, and Others) and Geography (APAC, North America, Europe, Middle East and Africa, South America)

  • Which regions are analyzed in the report?

    • APAC, North America, Europe, Middle East and Africa and South America

  • What are the key growth drivers and market challenges?

    • Rising consumer demand for personalization and fit accuracy, Supply chain disruptions and rising input costs

  • Who are the major players in the Lingerie Market?

    • Agent Provocateur, American Eagle Outfitters Inc., Aubade, Chantelle Lingerie Inc., Commando LLC, Cosabella LLC, Hanesbrands Inc., Hennes and Mauritz AB, Hunkemoller B.V., Jockey International Inc., La Perla Global UK Ltd., Lise Charmel, Marks and Spencer Group, PVH Corp., Skims Body Inc., Spanx LLC, ThirdLove Inc., Triumph Intertrade AG, Victorias Secret and Co. and Wacoal Holdings Corp.

Market Research Insights

  • The market's dynamism is fueled by a confluence of `direct-to-consumer (DTC) brands` and the widespread adoption of `influencer marketing`, which has proven to boost brand engagement by over 40% for campaigns emphasizing the `body positivity movement`. The rise of `subscription box models` and `try-before-you-buy services` reflects a pivot toward a `personalized shopping experience`.
  • Brands that implement an effective `omnichannel retail strategy` see up to a 15% higher customer retention rate compared to single-channel retailers. Furthermore, `social commerce integration` is critical, with some platforms facilitating a checkout process that is 30% faster than traditional e-commerce sites, directly impacting conversion rates for products marketed with `minimalist aesthetics` and a `comfort-driven design`.

We can help! Our analysts can customize this lingerie market research report to meet your requirements.

Get in touch

1. Executive Summary

1.1 Market overview

Executive Summary - Chart on Market Overview
Executive Summary - Data Table on Market Overview
Executive Summary - Chart on Global Market Characteristics
Executive Summary - Chart on Market by Geography
Executive Summary - Chart on Market Segmentation by Distribution Channel
Executive Summary - Chart on Market Segmentation by Product Type
Executive Summary - Chart on Market Segmentation by Material
Executive Summary - Chart on Incremental Growth
Executive Summary - Data Table on Incremental Growth
Executive Summary - Chart on Company Market Positioning

2. Technavio Analysis

2.1 Analysis of price sensitivity, lifecycle, customer purchase basket, adoption rates, and purchase criteria

2.2 Criticality of inputs and Factors of differentiation

Chart on Overview on criticality of inputs and factors of differentiation

2.3 Factors of disruption

Chart on Overview on factors of disruption

2.4 Impact of drivers and challenges

Chart on Impact of drivers and challenges in 2025 and 2030

3. Market Landscape

3.1 Market ecosystem

Chart on Parent Market
Data Table on - Parent Market

3.2 Market characteristics

Chart on Market characteristics analysis

3.3 Value chain analysis

Chart on Value chain analysis

4. Market Sizing

4.1 Market definition

Data Table on Offerings of companies included in the market definition

4.2 Market segment analysis

Market segments

4.3 Market size 2025

4.4 Market outlook: Forecast for 2025-2030

Chart on Global - Market size and forecast 2025-2030 ($ million)
Data Table on Global - Market size and forecast 2025-2030 ($ million)
Chart on Global Market: Year-over-year growth 2025-2030 (%)
Data Table on Global Market: Year-over-year growth 2025-2030 (%)

5. Historic Market Size

5.1 Global Lingerie Market 2020 - 2024

Historic Market Size - Data Table on Global Lingerie Market 2020 - 2024 ($ million)

5.2 Distribution Channel segment analysis 2020 - 2024

Historic Market Size - Distribution Channel Segment 2020 - 2024 ($ million)

5.3 Product Type segment analysis 2020 - 2024

Historic Market Size - Product Type Segment 2020 - 2024 ($ million)

5.4 Material segment analysis 2020 - 2024

Historic Market Size - Material Segment 2020 - 2024 ($ million)

5.5 Geography segment analysis 2020 - 2024

Historic Market Size - Geography Segment 2020 - 2024 ($ million)

5.6 Country segment analysis 2020 - 2024

Historic Market Size - Country Segment 2020 - 2024 ($ million)

6. Qualitative Analysis

6.1 Impact of AI in global lingerie market

6.2 Impact of geopolitical conflict on global lingerie market

7. Five Forces Analysis

7.1 Five forces summary

Five forces analysis - Comparison between 2025 and 2030

7.2 Bargaining power of buyers

Bargaining power of buyers - Impact of key factors 2025 and 2030

7.3 Bargaining power of suppliers

Bargaining power of suppliers - Impact of key factors in 2025 and 2030

7.4 Threat of new entrants

Threat of new entrants - Impact of key factors in 2025 and 2030

7.5 Threat of substitutes

Threat of substitutes - Impact of key factors in 2025 and 2030

7.6 Threat of rivalry

Threat of rivalry - Impact of key factors in 2025 and 2030

7.7 Market condition

Chart on Market condition - Five forces 2025 and 2030

8. Market Segmentation by Distribution Channel

8.1 Market segments

Chart on Distribution Channel - Market share 2025-2030 (%)
Data Table on Distribution Channel - Market share 2025-2030 (%)

8.2 Comparison by Distribution Channel

Chart on Comparison by Distribution Channel
Data Table on Comparison by Distribution Channel

8.3 Offline - Market size and forecast 2025-2030

Chart on Offline - Market size and forecast 2025-2030 ($ million)
Data Table on Offline - Market size and forecast 2025-2030 ($ million)
Chart on Offline - Year-over-year growth 2025-2030 (%)
Data Table on Offline - Year-over-year growth 2025-2030 (%)

8.4 Online - Market size and forecast 2025-2030

Chart on Online - Market size and forecast 2025-2030 ($ million)
Data Table on Online - Market size and forecast 2025-2030 ($ million)
Chart on Online - Year-over-year growth 2025-2030 (%)
Data Table on Online - Year-over-year growth 2025-2030 (%)

8.5 Market opportunity by Distribution Channel

Market opportunity by Distribution Channel ($ million)
Data Table on Market opportunity by Distribution Channel ($ million)

9. Market Segmentation by Product Type

9.1 Market segments

Chart on Product Type - Market share 2025-2030 (%)
Data Table on Product Type - Market share 2025-2030 (%)

9.2 Comparison by Product Type

Chart on Comparison by Product Type
Data Table on Comparison by Product Type

9.3 Bras - Market size and forecast 2025-2030

Chart on Bras - Market size and forecast 2025-2030 ($ million)
Data Table on Bras - Market size and forecast 2025-2030 ($ million)
Chart on Bras - Year-over-year growth 2025-2030 (%)
Data Table on Bras - Year-over-year growth 2025-2030 (%)

9.4 Panties - Market size and forecast 2025-2030

Chart on Panties - Market size and forecast 2025-2030 ($ million)
Data Table on Panties - Market size and forecast 2025-2030 ($ million)
Chart on Panties - Year-over-year growth 2025-2030 (%)
Data Table on Panties - Year-over-year growth 2025-2030 (%)

9.5 Shapewear - Market size and forecast 2025-2030

Chart on Shapewear - Market size and forecast 2025-2030 ($ million)
Data Table on Shapewear - Market size and forecast 2025-2030 ($ million)
Chart on Shapewear - Year-over-year growth 2025-2030 (%)
Data Table on Shapewear - Year-over-year growth 2025-2030 (%)

9.6 Lingerie sets - Market size and forecast 2025-2030

Chart on Lingerie sets - Market size and forecast 2025-2030 ($ million)
Data Table on Lingerie sets - Market size and forecast 2025-2030 ($ million)
Chart on Lingerie sets - Year-over-year growth 2025-2030 (%)
Data Table on Lingerie sets - Year-over-year growth 2025-2030 (%)

9.7 Others - Market size and forecast 2025-2030

Chart on Others - Market size and forecast 2025-2030 ($ million)
Data Table on Others - Market size and forecast 2025-2030 ($ million)
Chart on Others - Year-over-year growth 2025-2030 (%)
Data Table on Others - Year-over-year growth 2025-2030 (%)

9.8 Market opportunity by Product Type

Market opportunity by Product Type ($ million)
Data Table on Market opportunity by Product Type ($ million)

10. Market Segmentation by Material

10.1 Market segments

Chart on Material - Market share 2025-2030 (%)
Data Table on Material - Market share 2025-2030 (%)

10.2 Comparison by Material

Chart on Comparison by Material
Data Table on Comparison by Material

10.3 Cotton - Market size and forecast 2025-2030

Chart on Cotton - Market size and forecast 2025-2030 ($ million)
Data Table on Cotton - Market size and forecast 2025-2030 ($ million)
Chart on Cotton - Year-over-year growth 2025-2030 (%)
Data Table on Cotton - Year-over-year growth 2025-2030 (%)

10.4 Nylon - Market size and forecast 2025-2030

Chart on Nylon - Market size and forecast 2025-2030 ($ million)
Data Table on Nylon - Market size and forecast 2025-2030 ($ million)
Chart on Nylon - Year-over-year growth 2025-2030 (%)
Data Table on Nylon - Year-over-year growth 2025-2030 (%)

10.5 Satin - Market size and forecast 2025-2030

Chart on Satin - Market size and forecast 2025-2030 ($ million)
Data Table on Satin - Market size and forecast 2025-2030 ($ million)
Chart on Satin - Year-over-year growth 2025-2030 (%)
Data Table on Satin - Year-over-year growth 2025-2030 (%)

10.6 Silk - Market size and forecast 2025-2030

Chart on Silk - Market size and forecast 2025-2030 ($ million)
Data Table on Silk - Market size and forecast 2025-2030 ($ million)
Chart on Silk - Year-over-year growth 2025-2030 (%)
Data Table on Silk - Year-over-year growth 2025-2030 (%)

10.7 Others - Market size and forecast 2025-2030

Chart on Others - Market size and forecast 2025-2030 ($ million)
Data Table on Others - Market size and forecast 2025-2030 ($ million)
Chart on Others - Year-over-year growth 2025-2030 (%)
Data Table on Others - Year-over-year growth 2025-2030 (%)

10.8 Market opportunity by Material

Market opportunity by Material ($ million)
Data Table on Market opportunity by Material ($ million)

11. Customer Landscape

11.1 Customer landscape overview

Analysis of price sensitivity, lifecycle, customer purchase basket, adoption rates, and purchase criteria

12. Geographic Landscape

12.1 Geographic segmentation

Chart on Market share by geography 2025-2030 (%)
Data Table on Market share by geography 2025-2030 (%)

12.2 Geographic comparison

Chart on Geographic comparison
Data Table on Geographic comparison

12.3 APAC - Market size and forecast 2025-2030

Chart on APAC - Market size and forecast 2025-2030 ($ million)
Data Table on APAC - Market size and forecast 2025-2030 ($ million)
Chart on APAC - Year-over-year growth 2025-2030 (%)
Data Table on APAC - Year-over-year growth 2025-2030 (%)
Chart on Regional Comparison - APAC
Data Table on Regional Comparison - APAC

12.3.1 China - Market size and forecast 2025-2030

Chart on China - Market size and forecast 2025-2030 ($ million)
Data Table on China - Market size and forecast 2025-2030 ($ million)
Chart on China - Year-over-year growth 2025-2030 (%)
Data Table on China - Year-over-year growth 2025-2030 (%)

12.3.2 Japan - Market size and forecast 2025-2030

Chart on Japan - Market size and forecast 2025-2030 ($ million)
Data Table on Japan - Market size and forecast 2025-2030 ($ million)
Chart on Japan - Year-over-year growth 2025-2030 (%)
Data Table on Japan - Year-over-year growth 2025-2030 (%)

12.3.3 India - Market size and forecast 2025-2030

Chart on India - Market size and forecast 2025-2030 ($ million)
Data Table on India - Market size and forecast 2025-2030 ($ million)
Chart on India - Year-over-year growth 2025-2030 (%)
Data Table on India - Year-over-year growth 2025-2030 (%)

12.3.4 South Korea - Market size and forecast 2025-2030

Chart on South Korea - Market size and forecast 2025-2030 ($ million)
Data Table on South Korea - Market size and forecast 2025-2030 ($ million)
Chart on South Korea - Year-over-year growth 2025-2030 (%)
Data Table on South Korea - Year-over-year growth 2025-2030 (%)

12.3.5 Australia - Market size and forecast 2025-2030

Chart on Australia - Market size and forecast 2025-2030 ($ million)
Data Table on Australia - Market size and forecast 2025-2030 ($ million)
Chart on Australia - Year-over-year growth 2025-2030 (%)
Data Table on Australia - Year-over-year growth 2025-2030 (%)

12.3.6 Indonesia - Market size and forecast 2025-2030

Chart on Indonesia - Market size and forecast 2025-2030 ($ million)
Data Table on Indonesia - Market size and forecast 2025-2030 ($ million)
Chart on Indonesia - Year-over-year growth 2025-2030 (%)
Data Table on Indonesia - Year-over-year growth 2025-2030 (%)

12.4 North America - Market size and forecast 2025-2030

Chart on North America - Market size and forecast 2025-2030 ($ million)
Data Table on North America - Market size and forecast 2025-2030 ($ million)
Chart on North America - Year-over-year growth 2025-2030 (%)
Data Table on North America - Year-over-year growth 2025-2030 (%)
Chart on Regional Comparison - North America
Data Table on Regional Comparison - North America

12.4.1 US - Market size and forecast 2025-2030

Chart on US - Market size and forecast 2025-2030 ($ million)
Data Table on US - Market size and forecast 2025-2030 ($ million)
Chart on US - Year-over-year growth 2025-2030 (%)
Data Table on US - Year-over-year growth 2025-2030 (%)

12.4.2 Canada - Market size and forecast 2025-2030

Chart on Canada - Market size and forecast 2025-2030 ($ million)
Data Table on Canada - Market size and forecast 2025-2030 ($ million)
Chart on Canada - Year-over-year growth 2025-2030 (%)
Data Table on Canada - Year-over-year growth 2025-2030 (%)

12.4.3 Mexico - Market size and forecast 2025-2030

Chart on Mexico - Market size and forecast 2025-2030 ($ million)
Data Table on Mexico - Market size and forecast 2025-2030 ($ million)
Chart on Mexico - Year-over-year growth 2025-2030 (%)
Data Table on Mexico - Year-over-year growth 2025-2030 (%)

12.5 Europe - Market size and forecast 2025-2030

Chart on Europe - Market size and forecast 2025-2030 ($ million)
Data Table on Europe - Market size and forecast 2025-2030 ($ million)
Chart on Europe - Year-over-year growth 2025-2030 (%)
Data Table on Europe - Year-over-year growth 2025-2030 (%)
Chart on Regional Comparison - Europe
Data Table on Regional Comparison - Europe

12.5.1 Germany - Market size and forecast 2025-2030

Chart on Germany - Market size and forecast 2025-2030 ($ million)
Data Table on Germany - Market size and forecast 2025-2030 ($ million)
Chart on Germany - Year-over-year growth 2025-2030 (%)
Data Table on Germany - Year-over-year growth 2025-2030 (%)

12.5.2 UK - Market size and forecast 2025-2030

Chart on UK - Market size and forecast 2025-2030 ($ million)
Data Table on UK - Market size and forecast 2025-2030 ($ million)
Chart on UK - Year-over-year growth 2025-2030 (%)
Data Table on UK - Year-over-year growth 2025-2030 (%)

12.5.3 France - Market size and forecast 2025-2030

Chart on France - Market size and forecast 2025-2030 ($ million)
Data Table on France - Market size and forecast 2025-2030 ($ million)
Chart on France - Year-over-year growth 2025-2030 (%)
Data Table on France - Year-over-year growth 2025-2030 (%)

12.5.4 Italy - Market size and forecast 2025-2030

Chart on Italy - Market size and forecast 2025-2030 ($ million)
Data Table on Italy - Market size and forecast 2025-2030 ($ million)
Chart on Italy - Year-over-year growth 2025-2030 (%)
Data Table on Italy - Year-over-year growth 2025-2030 (%)

12.5.5 Spain - Market size and forecast 2025-2030

Chart on Spain - Market size and forecast 2025-2030 ($ million)
Data Table on Spain - Market size and forecast 2025-2030 ($ million)
Chart on Spain - Year-over-year growth 2025-2030 (%)
Data Table on Spain - Year-over-year growth 2025-2030 (%)

12.5.6 The Netherlands - Market size and forecast 2025-2030

Chart on The Netherlands - Market size and forecast 2025-2030 ($ million)
Data Table on The Netherlands - Market size and forecast 2025-2030 ($ million)
Chart on The Netherlands - Year-over-year growth 2025-2030 (%)
Data Table on The Netherlands - Year-over-year growth 2025-2030 (%)

12.6 Middle East and Africa - Market size and forecast 2025-2030

Chart on Middle East and Africa - Market size and forecast 2025-2030 ($ million)
Data Table on Middle East and Africa - Market size and forecast 2025-2030 ($ million)
Chart on Middle East and Africa - Year-over-year growth 2025-2030 (%)
Data Table on Middle East and Africa - Year-over-year growth 2025-2030 (%)
Chart on Regional Comparison - Middle East and Africa
Data Table on Regional Comparison - Middle East and Africa

12.6.1 Saudi Arabia - Market size and forecast 2025-2030

Chart on Saudi Arabia - Market size and forecast 2025-2030 ($ million)
Data Table on Saudi Arabia - Market size and forecast 2025-2030 ($ million)
Chart on Saudi Arabia - Year-over-year growth 2025-2030 (%)
Data Table on Saudi Arabia - Year-over-year growth 2025-2030 (%)

12.6.2 UAE - Market size and forecast 2025-2030

Chart on UAE - Market size and forecast 2025-2030 ($ million)
Data Table on UAE - Market size and forecast 2025-2030 ($ million)
Chart on UAE - Year-over-year growth 2025-2030 (%)
Data Table on UAE - Year-over-year growth 2025-2030 (%)

12.6.3 South Africa - Market size and forecast 2025-2030

Chart on South Africa - Market size and forecast 2025-2030 ($ million)
Data Table on South Africa - Market size and forecast 2025-2030 ($ million)
Chart on South Africa - Year-over-year growth 2025-2030 (%)
Data Table on South Africa - Year-over-year growth 2025-2030 (%)

12.6.4 Israel - Market size and forecast 2025-2030

Chart on Israel - Market size and forecast 2025-2030 ($ million)
Data Table on Israel - Market size and forecast 2025-2030 ($ million)
Chart on Israel - Year-over-year growth 2025-2030 (%)
Data Table on Israel - Year-over-year growth 2025-2030 (%)

12.6.5 Turkey - Market size and forecast 2025-2030

Chart on Turkey - Market size and forecast 2025-2030 ($ million)
Data Table on Turkey - Market size and forecast 2025-2030 ($ million)
Chart on Turkey - Year-over-year growth 2025-2030 (%)
Data Table on Turkey - Year-over-year growth 2025-2030 (%)

12.7 South America - Market size and forecast 2025-2030

Chart on South America - Market size and forecast 2025-2030 ($ million)
Data Table on South America - Market size and forecast 2025-2030 ($ million)
Chart on South America - Year-over-year growth 2025-2030 (%)
Data Table on South America - Year-over-year growth 2025-2030 (%)
Chart on Regional Comparison - South America
Data Table on Regional Comparison - South America

12.7.1 Brazil - Market size and forecast 2025-2030

Chart on Brazil - Market size and forecast 2025-2030 ($ million)
Data Table on Brazil - Market size and forecast 2025-2030 ($ million)
Chart on Brazil - Year-over-year growth 2025-2030 (%)
Data Table on Brazil - Year-over-year growth 2025-2030 (%)

12.7.2 Argentina - Market size and forecast 2025-2030

Chart on Argentina - Market size and forecast 2025-2030 ($ million)
Data Table on Argentina - Market size and forecast 2025-2030 ($ million)
Chart on Argentina - Year-over-year growth 2025-2030 (%)
Data Table on Argentina - Year-over-year growth 2025-2030 (%)

12.7.3 Chile - Market size and forecast 2025-2030

Chart on Chile - Market size and forecast 2025-2030 ($ million)
Data Table on Chile - Market size and forecast 2025-2030 ($ million)
Chart on Chile - Year-over-year growth 2025-2030 (%)
Data Table on Chile - Year-over-year growth 2025-2030 (%)

12.8 Market opportunity by geography

Market opportunity by geography ($ million)
Data Tables on Market opportunity by geography ($ million)

13. Drivers, Challenges, and Opportunity

13.1 Market drivers

Rising consumer demand for personalization and fit accuracy
Advancements in circular and bio-based material sourcing
Digital commerce and omni channel integration

13.2 Market challenges

Supply chain disruptions and rising input costs
Regulatory compliance and sustainability pressures
Intensifying competition and shifting consumer preferences

13.3 Impact of drivers and challenges

Impact of drivers and challenges in 2025 and 2030

13.4 Market opportunities

Inclusivity and body positivity
Sustainability and eco conscious innovation
Industrialization of AI driven virtual fitting

14. Competitive Landscape

14.1 Overview

14.2

Overview on criticality of inputs and factors of differentiation

14.3 Landscape disruption

Overview on factors of disruption

14.4 Industry risks

Impact of key risks on business

15. Competitive Analysis

15.1 Companies profiled

Companies covered

15.2 Company ranking index

15.3 Market positioning of companies

Matrix on companies position and classification

15.4 Agent Provocateur

Agent Provocateur - Overview
Agent Provocateur - Product / Service
Agent Provocateur - Key offerings
SWOT

15.5 American Eagle Outfitters Inc.

American Eagle Outfitters Inc. - Overview
American Eagle Outfitters Inc. - Business segments
American Eagle Outfitters Inc. - Key offerings
American Eagle Outfitters Inc. - Segment focus
SWOT

15.6 Chantelle Lingerie Inc.

Chantelle Lingerie Inc. - Overview
Chantelle Lingerie Inc. - Product / Service
Chantelle Lingerie Inc. - Key offerings
SWOT

15.7 Commando LLC

Commando LLC - Overview
Commando LLC - Product / Service
Commando LLC - Key offerings
SWOT

15.8 Hanesbrands Inc.

Hanesbrands Inc. - Overview
Hanesbrands Inc. - Business segments
Hanesbrands Inc. - Key offerings
Hanesbrands Inc. - Segment focus
SWOT

15.9 Hennes and Mauritz AB

Hennes and Mauritz AB - Overview
Hennes and Mauritz AB - Business segments
Hennes and Mauritz AB - Key offerings
Hennes and Mauritz AB - Segment focus
SWOT

15.10 Hunkemoller B.V.

Hunkemoller B.V. - Overview
Hunkemoller B.V. - Product / Service
Hunkemoller B.V. - Key offerings
SWOT

15.11 Jockey International Inc.

Jockey International Inc. - Overview
Jockey International Inc. - Product / Service
Jockey International Inc. - Key offerings
SWOT

15.12 Marks and Spencer Group

Marks and Spencer Group - Overview
Marks and Spencer Group - Business segments
Marks and Spencer Group - Key offerings
Marks and Spencer Group - Segment focus
SWOT

15.13 PVH Corp.

PVH Corp. - Overview
PVH Corp. - Business segments
PVH Corp. - Key offerings
PVH Corp. - Segment focus
SWOT

15.14 Skims Body Inc.

Skims Body Inc. - Overview
Skims Body Inc. - Product / Service
Skims Body Inc. - Key offerings
SWOT

15.15 ThirdLove Inc.

ThirdLove Inc. - Overview
ThirdLove Inc. - Product / Service
ThirdLove Inc. - Key offerings
SWOT

15.16 Triumph Intertrade AG

Triumph Intertrade AG - Overview
Triumph Intertrade AG - Product / Service
Triumph Intertrade AG - Key offerings
SWOT

15.17 Victorias Secret and Co.

Victorias Secret and Co. - Overview
Victorias Secret and Co. - Business segments
Victorias Secret and Co. - Key offerings
Victorias Secret and Co. - Segment focus
SWOT

15.18 Wacoal Holdings Corp.

Wacoal Holdings Corp. - Overview
Wacoal Holdings Corp. - Business segments
Wacoal Holdings Corp. - Key offerings
Wacoal Holdings Corp. - Segment focus
SWOT

16. Appendix

16.1 Scope of the report

Market definition
Objectives
Notes and caveats

16.2 Inclusions and exclusions checklist

Inclusions checklist
Exclusions checklist

16.3 Currency conversion rates for US$

16.4 Research methodology

16.5 Data procurement

Information sources

16.6 Data validation

16.7 Validation techniques employed for market sizing

16.8 Data synthesis

16.9 360 degree market analysis

16.10 List of abbreviations

Research Methodology

Technavio presents a detailed picture of the market by way of study, synthesis, and summation of data from multiple sources. The analysts have presented the various facets of the market with a particular focus on identifying the key industry influencers. The data thus presented is comprehensive, reliable, and the result of extensive research, both primary and secondary.

INFORMATION SOURCES

Primary sources

  • Manufacturers and suppliers
  • Channel partners
  • Industry experts
  • Strategic decision makers

Secondary sources

  • Industry journals and periodicals
  • Government data
  • Financial reports of key industry players
  • Historical data
  • Press releases

DATA ANALYSIS

Data Synthesis

  • Collation of data
  • Estimation of key figures
  • Analysis of derived insights

Data Validation

  • Triangulation with data models
  • Reference against proprietary databases
  • Corroboration with industry experts

REPORT WRITING

Qualitative

  • Market drivers
  • Market challenges
  • Market trends
  • Five forces analysis

Quantitative

  • Market size and forecast
  • Market segmentation
  • Geographical insights
  • Competitive landscape

Interested in this report?

Get your sample now to see our research methodology and insights!

Download Now

Frequently Asked Questions

Lingerie market growth will increase by USD 19812.3 million during 2026-2030.

The Lingerie market is expected to grow at a CAGR of 4.2% during 2026-2030.

Lingerie market is segmented by Distribution channel (Offline, Online) Product type (Bras, Panties, Shapewear, Lingerie sets, Others) Material (Cotton, Nylon, Satin, Silk, Others)

Agent Provocateur, American Eagle Outfitters Inc., Aubade, Chantelle Lingerie Inc., Commando LLC, Cosabella LLC, Hanesbrands Inc., Hennes and Mauritz AB, Hunkemoller B.V., Jockey International Inc., La Perla Global UK Ltd., Lise Charmel, Marks and Spencer Group, PVH Corp., Skims Body Inc., Spanx LLC, ThirdLove Inc., Triumph Intertrade AG, Victorias Secret and Co., Wacoal Holdings Corp. are a few of the key vendors in the Lingerie market.

APAC will register the highest growth rate of 40.6% among the other regions. Therefore, the Lingerie market in APAC is expected to garner significant business opportunities for the vendors during the forecast period.

China, Japan, India, South Korea, Australia, Indonesia, US, Canada, Mexico, Germany, UK, France, Italy, Spain, The Netherlands, Saudi Arabia, UAE, South Africa, Israel, Turkey, Brazil, Argentina, Chile

  • Rising consumer demand for personalization and fit accuracy is the driving factor this market.

The Lingerie market vendors should focus on grabbing business opportunities from the Distribution channel segment as it accounted for the largest market share in the base year.
RIA - Research AI Assistant
Ask RIA