Intimate Apparel Market Analysis, Size, and Forecast 2025-2029: North America (US and Canada), Europe (France, Germany, and UK), APAC (China, India, Japan, and South Korea), and Rest of World (ROW)

Intimate Apparel Market Analysis, Size, and Forecast 2025-2029:
North America (US and Canada), Europe (France, Germany, and UK), APAC (China, India, Japan, and South Korea), and Rest of World (ROW)

Published: May 2025 245 Pages SKU: IRTNTR73342

Market Overview at a Glance

$32 B
Market Opportunity
6.6%
CAGR
5.6
YoY growth 2024-2025(%)

Intimate Apparel Market Size 2025-2029

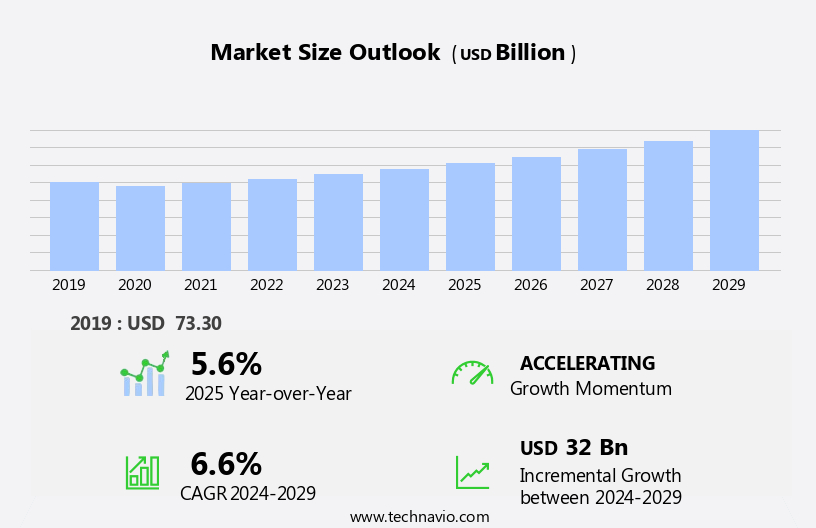
The intimate apparel market size is forecast to increase by USD 32 billion at a CAGR of 6.6% between 2024 and 2029.

  • The market is driven by the increasing preference for visually appealing and fashionable intimate apparel, particularly among women who prioritize comfort and style. This trend is further amplified by the rising popularity of athleisure in the intimate apparel industry, as consumers seek versatile and functional garments suitable for various activities. However, this market landscape also presents challenges for key players. The fewer barriers to entry in the intimate apparel industry result in intense competition among established brands, requiring companies to innovate and differentiate themselves to maintain market share. The market is experiencing significant growth, driven by the increasing preference for visually appealing fast fashion and intimate apparel, particularly among women.
  • To capitalize on opportunities and navigate challenges effectively, market participants must focus on offering unique designs, superior quality, and competitive pricing, while also investing in digital marketing and omnichannel sales strategies to reach and engage customers. To capitalize on this market opportunity, companies should focus on understanding the evolving preferences of their customers and staying abreast of the latest trends in the apparel industry.

What will be the Size of the Intimate Apparel Market during the forecast period?

Intimate Apparel Market Size

 Request Free Sample

  • The market continues to evolve, shaped by various dynamics and applications across diverse sectors. Seamless underwear, designer lingerie, and e-commerce retailers dominate the landscape, with brand building and customer satisfaction at the forefront. Price point and value proposition remain crucial factors, as digital marketing and personalized recommendations drive sales. Innovations in technology, such as 3D body scanning and virtual fitting, enhance the user experience and cater to diverse consumer needs. Sustainable materials, including organic cotton and recycled fabrics, are increasingly prioritized, reflecting the importance of eco-consciousness and brand loyalty. Influencer marketing, body positivity, and size inclusivity further shape the market, with technological advancements streamlining retail operations and supply chain management. Maternity wear and maternity bras, adjustable straps, and size charts are essential offerings for expectant mothers.
  • Seasonal collections, maternity wear, luxury lingerie, sports bras, and compression garments cater to diverse target audiences, while data analytics and social media marketing provide competitive advantages. The ongoing unfolding of market activities reveals evolving patterns and trends, as the industry continues to adapt and innovate. Lounge wear, pajama sets, and sleep shirts offer comfort and convenience. Seamless technology, front closure, and convertible bras provide flexibility and ease.

How is this Intimate Apparel Industry segmented?

The intimate apparel industry research report provides comprehensive data (region-wise segment analysis), with forecasts and estimates in "USD billion" for the period 2025-2029, as well as historical data from 2019-2023 for the following segments.

  • Product
    • Lower inner wear
    • Upper inner wear
    • Sleepwear and loungewear
    • Thermal wear
    • Others
  • Gender
    • Female
    • Male
  • Distribution Channel
    • Offline
    • Online
  • Material
    • Cotton
    • Silk
    • Satin
    • Nylon
    • Others
  • Geography
    • North America
      • US
      • Canada
    • Europe
      • France
      • Germany
      • UK
    • APAC
      • China
      • India
      • Japan
      • South Korea
    • Rest of World (ROW)

By Product Insights

The lower inner wear segment is estimated to witness significant growth during the forecast period. In the market, consumer preferences prioritize comfort and innovation. Seamless underwear, especially panties, are gaining popularity due to their comfort and suitability for various clothing styles, particularly in the workplace. Younger generations favor full-coverage panties over thongs, while the rise of working women contributes to the demand for seamless options. Intimate apparel brands cater to this trend by offering affordable packaged deals, allowing customers to purchase multiple items at once. Diversity and inclusion are essential, leading to an expansion of size inclusivity and body positivity campaigns. Fashion trends influence purchasing patterns, with sustainable materials, eco-friendly lingerie, and recycled fabrics becoming increasingly popular. Lingerie styles range from push-up bras, underwire bras, non-padded bras, strapless bras, corset tops, and thong underwear.

Intimate Apparel Market Size

Request Free Sample

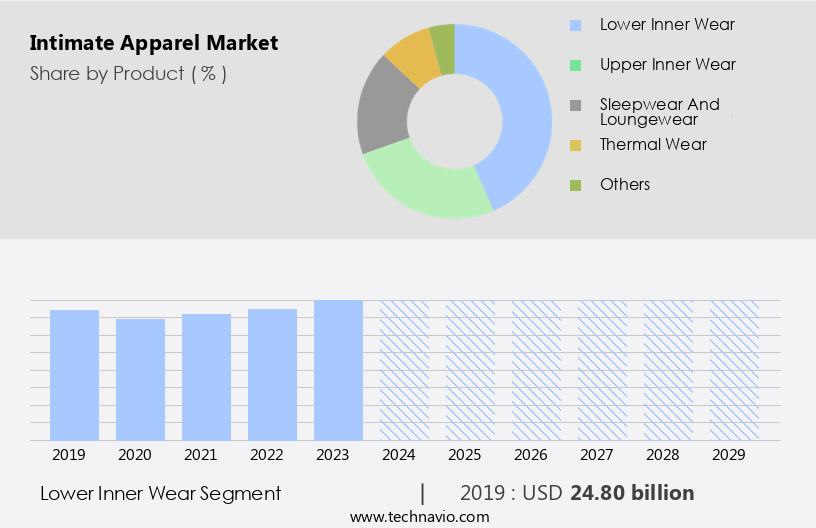
The Lower inner wear segment was valued at USD 24.80 billion in 2019 and showed a gradual increase during the forecast period.  Consumers are looking for bras that provide support and comfort during workouts, as well as seamless designs that reduce visible lines under clothing. Digital marketing strategies, including personalized recommendations and social media marketing, are crucial for reaching the target audience. Technological advancements, such as 3D body scanning and virtual fitting, enhance the user experience and improve customer satisfaction. Brand building through designer collaborations and luxury lingerie lines adds value to the market. Seasonal collections and fashion trends continue to drive sales, while maternity wear and compression garments cater to specific consumer needs. Retail operations and supply chain management are optimized through data analytics and e-commerce platforms. Overall, the market is dynamic, with a focus on comfort, innovation, and inclusivity. As the trend of wearing athletic clothing beyond gym sessions continues to grow, the demand for sports bras and active wear is expected to rise accordingly.

Regional Analysis

APAC is estimated to contribute 48% to the growth of the global market during the forecast period. Technavio's analysts have elaborately explained the regional trends and drivers that shape the market during the forecast period.

Intimate Apparel Market Share by Geography

 Request Free Sample

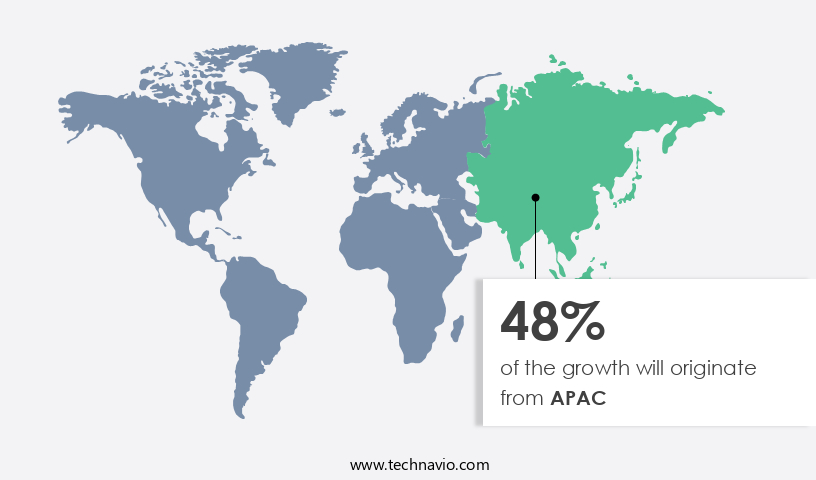
The market in the region experiences continuous growth, driven by population expansion, rising income levels, and Westernized buying habits. India and China serve as preferred destinations for international competitors due to their large consumer bases. Price consciousness is a significant factor influencing consumer behavior, leading some brands to introduce affordable lines. The increasing number of working women has resulted in higher demand for trendy and premium intimate apparel products. High-end brands from L Brands, Victoria's Secret, and Triumph International are gaining popularity among consumers. Competitors cater to local preferences by offering customized products, including seamless underwear, designer lingerie, maternity wear, and sports bras.

Innovations in technology, such as 3D body scanning, virtual fitting, and size inclusivity, enhance the user experience. Sustainable materials, eco-friendly lingerie, and recycled fabrics are gaining traction due to consumer awareness and the desire for brand loyalty. Digital marketing, social media engagement, and influencer collaborations are essential strategies for customer acquisition and retention. Retail operations and supply chain management are undergoing technological advancements, while data analytics and personalized recommendations improve customer experience. Brands focus on fabric innovation, product quality, and competitive pricing to differentiate themselves in the market.

Market Dynamics

Our researchers analyzed the data with 2024 as the base year, along with the key drivers, trends, and challenges. A holistic analysis of drivers will help companies refine their marketing strategies to gain a competitive advantage.

What are the key market drivers leading to the rise in the adoption of Intimate Apparel Industry?

  • Fashion-conscious consumers, particularly women, hold a strong preference for visually appealing intimate apparel, driving the market's growth.  Intimate apparel, encompassing seamless underwear and designer lingerie, continues to be a significant market with a strong focus on customer satisfaction. With an increasing number of women seeking visually appealing and functional undergarments, the market is witnessing robust growth. Seamless underwear, designed for comfort under formal wear, is a noteworthy trend. Brands are investing in brand building and innovation to cater to the diverse needs of consumers. Digital marketing plays a pivotal role in customer engagement, with personalized recommendations based on 3D body scanning technology becoming increasingly popular.
  • Sustainable materials and fabric innovation are also key factors driving the market. Competitors are focusing on price point and value proposition to attract and retain customers. As the market becomes more competitive, companies are differentiating themselves through unique features and superior quality.

What are the market trends shaping the Intimate Apparel Industry?

  • The rising trend in the intimate apparel industry is the increasing popularity of athleisure wear. This market trend signifies a shift towards comfortable and functional garments that can be worn both for workout sessions and everyday activities. Intimate apparel, once considered a basic necessity, has transformed into a fashionable and functional category, particularly for women. Brands are capitalizing on this evolution by expanding their offerings beyond traditional lingerie to include versatile and stylish innerwear. Sports bras, a popular athleisure clothing product, exemplify this trend. With their superior comfort, functionality, and fashion appeal, many women are making the switch from regular bras. Brand loyalty is a significant factor in the market, with consumers seeking eco-friendly and sustainable lingerie options. Influencer marketing plays a crucial role in promoting body positivity and size inclusivity, driving growth in the plus-size lingerie segment.
  • Retail operations are adapting to consumer preferences by implementing data analytics and virtual fitting technologies to enhance the shopping experience. Intimate apparel brands are leveraging these market dynamics to innovate and cater to the evolving needs of consumers. Sustainable materials and production methods are becoming increasingly important, as are size inclusivity and virtual fitting solutions. Retail lingerie stores are embracing these trends to remain competitive and meet the demands of modern consumers.

What challenges does the Intimate Apparel Industry face during its growth?

  • The intense competition among key brands in the industry is a significant challenge, as fewer barriers to entry allow for an influx of new competitors, thereby hindering industry growth.  The market is characterized by a vast array of key players, including established names such as AEO Management, Berkshire Hathaway, Hanesbrands, Jockey International, PVH, and L Brands. Over the past five years, the market has witnessed an influx of new entrants, including e-retailers and private labels, as well as start-ups like ADOREME.COM, which offer luxury lingerie at competitive prices via e-commerce platforms. This intensified competition has led to price wars, making product differentiation crucial. Manufacturers distinguish their offerings through factors such as comfort level, fabric quality, and variety.
  • Technological advancements have played a significant role in the market, with the integration of recycled materials, organic cotton, and compression garments becoming increasingly popular. Social media marketing and customer experience have also emerged as key drivers, shaping the market dynamics.

Exclusive Customer Landscape

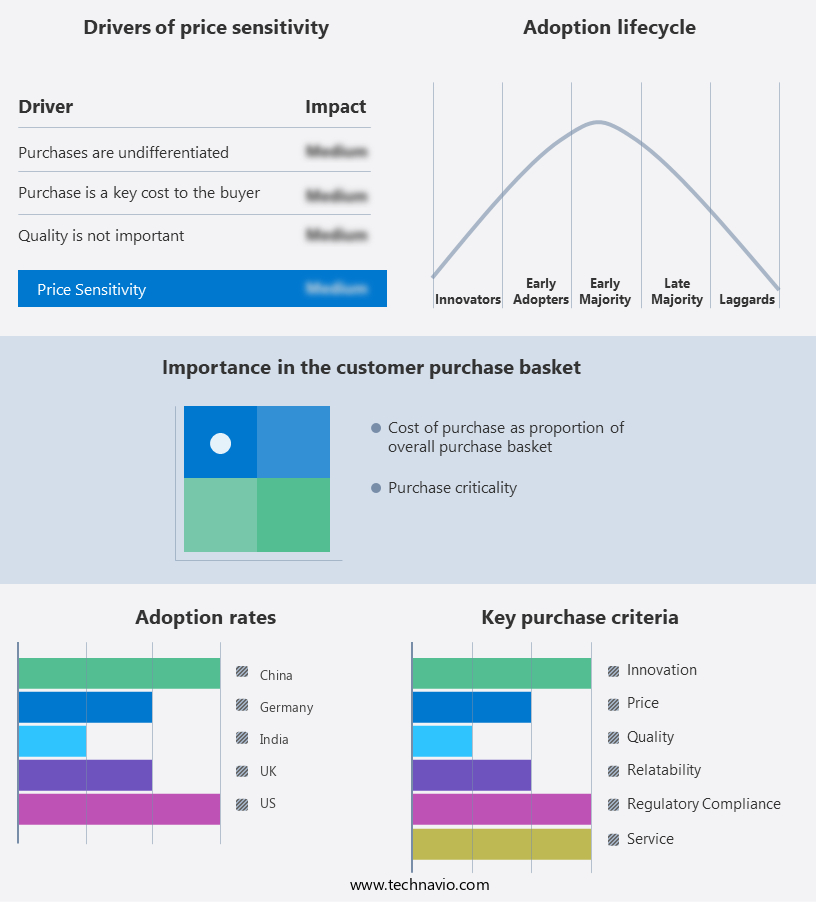
The intimate apparel market forecasting report includes the adoption lifecycle of the market, covering from the innovator's stage to the laggard's stage. It focuses on adoption rates in different regions based on penetration. Furthermore, the intimate apparel market report also includes key purchase criteria and drivers of price sensitivity to help companies evaluate and develop their market growth analysis strategies.

Intimate Apparel Market Share by Geography

 Customer Landscape

Key Companies & Market Insights

Companies are implementing various strategies, such as strategic alliances, intimate apparel market forecast, partnerships, mergers and acquisitions, geographical expansion, and product/service launches, to enhance their presence in the industry.

American Eagle Outfitters Inc. - The company specializes in the production and distribution of intimate apparel, including bras and panties, under the brand name Aerie.

The industry research and growth report includes detailed analyses of the competitive landscape of the market and information about key companies, including:

  • American Eagle Outfitters Inc.
  • BAREWEB INC.
  • Chantelle SA
  • Debenhams Plc
  • Embry Holdings Ltd.
  • Hanesbrands Inc.
  • Hanky Panky Ltd.
  • Jockey International Inc.
  • Lise Charmel
  • Marks and Spencer Group plc
  • MAS Holdings Pvt. Ltd.
  • PVH Corp.
  • Shenzhen Huijie Group Co. Ltd.
  • Sockkobe Co. Ltd.
  • Stella McCartney Ltd.
  • Triumph Intertrade AG
  • Urban Outfitters Inc.
  • Victorias Secret and Co.
  • Wacoal Holdings Corp.
  • Zivame Platform

Qualitative and quantitative analysis of companies has been conducted to help clients understand the wider business environment as well as the strengths and weaknesses of key industry players. Data is qualitatively analyzed to categorize companies as pure play, category-focused, industry-focused, and diversified; it is quantitatively analyzed to categorize companies as dominant, leading, strong, tentative, and weak.

Recent Development and News in Intimate Apparel Market

  • In February 2024, Victoria's Secret, a leading player in the market, announced the launch of its new "Body by Victoria" collection, focusing on size inclusivity and diversity, aiming to cater to a broader customer base (Victoria's Secret press release, 2024).
  • In October 2025, HanesBrands Inc. and shapewear brand Spanx entered into a strategic partnership to expand HanesBrands' shapewear offerings, combining HanesBrands' manufacturing capabilities with Spanx's design expertise (HanesBrands Inc. SEC filing, 2025).
  • In March 2024, Wacoal International Ltd. completed the acquisition of Maidenform Brands Inc., significantly expanding its market presence and strengthening its position in the North American market (Wacoal International Ltd. Press release, 2024).
  • In July 2025, the European Union passed new regulations requiring intimate apparel manufacturers to label their products with detailed information on materials, care instructions, and composition, enhancing transparency and consumer safety (European Parliament press release, 2025).

Research Analyst Overview

The market is experiencing dynamic shifts, with a focus on performance fabrics and innovative materials taking center stage. Biodegradable materials and sustainable manufacturing practices are gaining traction, aligning with the circular economy trend. Ethical lingerie, embracing body acceptance and fair trade practices, is resonating with consumers seeking authenticity. Smart textiles, including body mapping and fitting algorithms, offer comfort and personalized styling services. Social proof, such as online reviews and customer testimonials, influences purchasing decisions. Augmented reality and virtual try-on technology enhance the in-store experience, while data-driven marketing and omnichannel retailing cater to modern consumers' needs. Inclusivity initiatives and personalized sizing further strengthen brand storytelling. AI and seamless technology streamline operations and elevate the industry, shaping the future of intimate apparel.

Dive into Technavio's robust research methodology, blending expert interviews, extensive data synthesis, and validated models for unparalleled Intimate Apparel Market insights. See full methodology.

Market Scope

Report Coverage

Details

Page number

245

Base year

2024

Historic period

2019-2023

Forecast period

2025-2029

Growth momentum & CAGR

Accelerate at a CAGR of 6.6%

Market growth 2025-2029

USD 32 billion

Market structure

Fragmented

YoY growth 2024-2025(%)

5.6

Key countries

China, Japan, India, Germany, UK, South Korea, Saudi Arabia, US, France, and Canada

Competitive landscape

Leading Companies, Market Positioning of Companies, Competitive Strategies, and Industry Risks

Request Free Sample

What are the Key Data Covered in this Intimate Apparel Market Research and Growth Report?

  • CAGR of the Intimate Apparel industry during the forecast period
  • Detailed information on factors that will drive the growth and forecasting between 2025 and 2029
  • Precise estimation of the size of the market and its contribution of the industry in focus to the parent market
  • Accurate predictions about upcoming growth and trends and changes in consumer behaviour
  • Growth of the market across APAC, Europe, North America, South America, and Middle East and Africa
  • Thorough analysis of the market's competitive landscape and detailed information about companies
  • Comprehensive analysis of factors that will challenge the intimate apparel market growth of industry companies

We can help! Our analysts can customize this intimate apparel market research report to meet your requirements.

Get in touch

1 Executive Summary

  • 1.1 Market overview
    • Executive Summary - Chart on Market Overview
    • Executive Summary - Data Table on Market Overview
    • Executive Summary - Chart on Global Market Characteristics
    • Executive Summary - Chart on Market by Geography
    • Executive Summary - Chart on Market Segmentation by Product
    • Executive Summary - Chart on Market Segmentation by Gender
    • Executive Summary - Chart on Market Segmentation by Distribution Channel
    • Executive Summary - Chart on Market Segmentation by Material
    • Executive Summary - Chart on Incremental Growth
    • Executive Summary - Data Table on Incremental Growth
    • Executive Summary - Chart on Company Market Positioning

2 Technavio Analysis

  • 2.1 Analysis of price sensitivity, lifecycle, customer purchase basket, adoption rates, and purchase criteria
    • Analysis of price sensitivity, lifecycle, customer purchase basket, adoption rates, and purchase criteria
  • 2.2 Criticality of inputs and Factors of differentiation
    • Overview on criticality of inputs and factors of differentiation
  • 2.3 Factors of disruption
    • Overview on factors of disruption
  • 2.4 Impact of drivers and challenges
    • Impact of drivers and challenges in 2024 and 2029

3 Market Landscape

  • 3.1 Market ecosystem
    • Parent Market
    • Data Table on - Parent Market
  • 3.2 Market characteristics
    • Market characteristics analysis
  • 3.3 Value chain analysis
    • Value chain analysis

4 Market Sizing

  • 4.1 Market definition
    • Offerings of companies included in the market definition
  • 4.2 Market segment analysis
    • Market segments
  • 4.3 Market size 2024
    • 4.4 Market outlook: Forecast for 2024-2029
      • Chart on Global - Market size and forecast 2024-2029 ($ billion)
      • Data Table on Global - Market size and forecast 2024-2029 ($ billion)
      • Chart on Global Market: Year-over-year growth 2024-2029 (%)
      • Data Table on Global Market: Year-over-year growth 2024-2029 (%)

    5 Historic Market Size

    • 5.1 Global Intimate Apparel Market 2019 - 2023
      • Historic Market Size - Data Table on Global Intimate Apparel Market 2019 - 2023 ($ billion)
    • 5.2 Product segment analysis 2019 - 2023
      • Historic Market Size - Product Segment 2019 - 2023 ($ billion)
    • 5.3 Gender segment analysis 2019 - 2023
      • Historic Market Size - Gender Segment 2019 - 2023 ($ billion)
    • 5.4 Distribution Channel segment analysis 2019 - 2023
      • Historic Market Size - Distribution Channel Segment 2019 - 2023 ($ billion)
    • 5.5 Material segment analysis 2019 - 2023
      • Historic Market Size - Material Segment 2019 - 2023 ($ billion)
    • 5.6 Geography segment analysis 2019 - 2023
      • Historic Market Size - Geography Segment 2019 - 2023 ($ billion)
    • 5.7 Country segment analysis 2019 - 2023
      • Historic Market Size - Country Segment 2019 - 2023 ($ billion)

    6 Qualitative Analysis

    • 6.1 Impact of AI on Global Intimate Apparel Market

      7 Five Forces Analysis

      • 7.1 Five forces summary
        • Five forces analysis - Comparison between 2024 and 2029
      • 7.2 Bargaining power of buyers
        • Bargaining power of buyers - Impact of key factors 2024 and 2029
      • 7.3 Bargaining power of suppliers
        • Bargaining power of suppliers - Impact of key factors in 2024 and 2029
      • 7.4 Threat of new entrants
        • Threat of new entrants - Impact of key factors in 2024 and 2029
      • 7.5 Threat of substitutes
        • Threat of substitutes - Impact of key factors in 2024 and 2029
      • 7.6 Threat of rivalry
        • Threat of rivalry - Impact of key factors in 2024 and 2029
      • 7.7 Market condition
        • Chart on Market condition - Five forces 2024 and 2029

      8 Market Segmentation by Product

      • 8.1 Market segments
        • Chart on Product - Market share 2024-2029 (%)
        • Data Table on Product - Market share 2024-2029 (%)
      • 8.2 Comparison by Product
        • Chart on Comparison by Product
        • Data Table on Comparison by Product
      • 8.3 Lower inner wear - Market size and forecast 2024-2029
        • Chart on Lower inner wear - Market size and forecast 2024-2029 ($ billion)
        • Data Table on Lower inner wear - Market size and forecast 2024-2029 ($ billion)
        • Chart on Lower inner wear - Year-over-year growth 2024-2029 (%)
        • Data Table on Lower inner wear - Year-over-year growth 2024-2029 (%)
      • 8.4 Upper inner wear - Market size and forecast 2024-2029
        • Chart on Upper inner wear - Market size and forecast 2024-2029 ($ billion)
        • Data Table on Upper inner wear - Market size and forecast 2024-2029 ($ billion)
        • Chart on Upper inner wear - Year-over-year growth 2024-2029 (%)
        • Data Table on Upper inner wear - Year-over-year growth 2024-2029 (%)
      • 8.5 Sleepwear and loungewear - Market size and forecast 2024-2029
        • Chart on Sleepwear and loungewear - Market size and forecast 2024-2029 ($ billion)
        • Data Table on Sleepwear and loungewear - Market size and forecast 2024-2029 ($ billion)
        • Chart on Sleepwear and loungewear - Year-over-year growth 2024-2029 (%)
        • Data Table on Sleepwear and loungewear - Year-over-year growth 2024-2029 (%)
      • 8.6 Thermal wear - Market size and forecast 2024-2029
        • Chart on Thermal wear - Market size and forecast 2024-2029 ($ billion)
        • Data Table on Thermal wear - Market size and forecast 2024-2029 ($ billion)
        • Chart on Thermal wear - Year-over-year growth 2024-2029 (%)
        • Data Table on Thermal wear - Year-over-year growth 2024-2029 (%)
      • 8.7 Others - Market size and forecast 2024-2029
        • Chart on Others - Market size and forecast 2024-2029 ($ billion)
        • Data Table on Others - Market size and forecast 2024-2029 ($ billion)
        • Chart on Others - Year-over-year growth 2024-2029 (%)
        • Data Table on Others - Year-over-year growth 2024-2029 (%)
      • 8.8 Market opportunity by Product
        • Market opportunity by Product ($ billion)
        • Data Table on Market opportunity by Product ($ billion)

      9 Market Segmentation by Gender

      • 9.1 Market segments
        • Chart on Gender - Market share 2024-2029 (%)
        • Data Table on Gender - Market share 2024-2029 (%)
      • 9.2 Comparison by Gender
        • Chart on Comparison by Gender
        • Data Table on Comparison by Gender
      • 9.3 Female - Market size and forecast 2024-2029
        • Chart on Female - Market size and forecast 2024-2029 ($ billion)
        • Data Table on Female - Market size and forecast 2024-2029 ($ billion)
        • Chart on Female - Year-over-year growth 2024-2029 (%)
        • Data Table on Female - Year-over-year growth 2024-2029 (%)
      • 9.4 Male - Market size and forecast 2024-2029
        • Chart on Male - Market size and forecast 2024-2029 ($ billion)
        • Data Table on Male - Market size and forecast 2024-2029 ($ billion)
        • Chart on Male - Year-over-year growth 2024-2029 (%)
        • Data Table on Male - Year-over-year growth 2024-2029 (%)
      • 9.5 Market opportunity by Gender
        • Market opportunity by Gender ($ billion)
        • Data Table on Market opportunity by Gender ($ billion)

      10 Market Segmentation by Distribution Channel

      • 10.1 Market segments
        • Chart on Distribution Channel - Market share 2024-2029 (%)
        • Data Table on Distribution Channel - Market share 2024-2029 (%)
      • 10.2 Comparison by Distribution Channel
        • Chart on Comparison by Distribution Channel
        • Data Table on Comparison by Distribution Channel
      • 10.3 Offline - Market size and forecast 2024-2029
        • Chart on Offline - Market size and forecast 2024-2029 ($ billion)
        • Data Table on Offline - Market size and forecast 2024-2029 ($ billion)
        • Chart on Offline - Year-over-year growth 2024-2029 (%)
        • Data Table on Offline - Year-over-year growth 2024-2029 (%)
      • 10.4 Online - Market size and forecast 2024-2029
        • Chart on Online - Market size and forecast 2024-2029 ($ billion)
        • Data Table on Online - Market size and forecast 2024-2029 ($ billion)
        • Chart on Online - Year-over-year growth 2024-2029 (%)
        • Data Table on Online - Year-over-year growth 2024-2029 (%)
      • 10.5 Market opportunity by Distribution Channel
        • Market opportunity by Distribution Channel ($ billion)
        • Data Table on Market opportunity by Distribution Channel ($ billion)

      11 Market Segmentation by Material

      • 11.1 Market segments
        • Chart on Material - Market share 2024-2029 (%)
        • Data Table on Material - Market share 2024-2029 (%)
      • 11.2 Comparison by Material
        • Chart on Comparison by Material
        • Data Table on Comparison by Material
      • 11.3 Cotton - Market size and forecast 2024-2029
        • Chart on Cotton - Market size and forecast 2024-2029 ($ billion)
        • Data Table on Cotton - Market size and forecast 2024-2029 ($ billion)
        • Chart on Cotton - Year-over-year growth 2024-2029 (%)
        • Data Table on Cotton - Year-over-year growth 2024-2029 (%)
      • 11.4 Silk - Market size and forecast 2024-2029
        • Chart on Silk - Market size and forecast 2024-2029 ($ billion)
        • Data Table on Silk - Market size and forecast 2024-2029 ($ billion)
        • Chart on Silk - Year-over-year growth 2024-2029 (%)
        • Data Table on Silk - Year-over-year growth 2024-2029 (%)
      • 11.5 Satin - Market size and forecast 2024-2029
        • Chart on Satin - Market size and forecast 2024-2029 ($ billion)
        • Data Table on Satin - Market size and forecast 2024-2029 ($ billion)
        • Chart on Satin - Year-over-year growth 2024-2029 (%)
        • Data Table on Satin - Year-over-year growth 2024-2029 (%)
      • 11.6 Nylon - Market size and forecast 2024-2029
        • Chart on Nylon - Market size and forecast 2024-2029 ($ billion)
        • Data Table on Nylon - Market size and forecast 2024-2029 ($ billion)
        • Chart on Nylon - Year-over-year growth 2024-2029 (%)
        • Data Table on Nylon - Year-over-year growth 2024-2029 (%)
      • 11.7 Others - Market size and forecast 2024-2029
        • Chart on Others - Market size and forecast 2024-2029 ($ billion)
        • Data Table on Others - Market size and forecast 2024-2029 ($ billion)
        • Chart on Others - Year-over-year growth 2024-2029 (%)
        • Data Table on Others - Year-over-year growth 2024-2029 (%)
      • 11.8 Market opportunity by Material
        • Market opportunity by Material ($ billion)
        • Data Table on Market opportunity by Material ($ billion)

      12 Customer Landscape

      • 12.1 Customer landscape overview
        • Analysis of price sensitivity, lifecycle, customer purchase basket, adoption rates, and purchase criteria

      13 Geographic Landscape

      • 13.1 Geographic segmentation
        • Chart on Market share by geography 2024-2029 (%)
        • Data Table on Market share by geography 2024-2029 (%)
      • 13.2 Geographic comparison
        • Chart on Geographic comparison
        • Data Table on Geographic comparison
      • 13.3 APAC - Market size and forecast 2024-2029
        • Chart on APAC - Market size and forecast 2024-2029 ($ billion)
        • Data Table on APAC - Market size and forecast 2024-2029 ($ billion)
        • Chart on APAC - Year-over-year growth 2024-2029 (%)
        • Data Table on APAC - Year-over-year growth 2024-2029 (%)
      • 13.4 Europe - Market size and forecast 2024-2029
        • Chart on Europe - Market size and forecast 2024-2029 ($ billion)
        • Data Table on Europe - Market size and forecast 2024-2029 ($ billion)
        • Chart on Europe - Year-over-year growth 2024-2029 (%)
        • Data Table on Europe - Year-over-year growth 2024-2029 (%)
      • 13.5 North America - Market size and forecast 2024-2029
        • Chart on North America - Market size and forecast 2024-2029 ($ billion)
        • Data Table on North America - Market size and forecast 2024-2029 ($ billion)
        • Chart on North America - Year-over-year growth 2024-2029 (%)
        • Data Table on North America - Year-over-year growth 2024-2029 (%)
      • 13.6 South America - Market size and forecast 2024-2029
        • Chart on South America - Market size and forecast 2024-2029 ($ billion)
        • Data Table on South America - Market size and forecast 2024-2029 ($ billion)
        • Chart on South America - Year-over-year growth 2024-2029 (%)
        • Data Table on South America - Year-over-year growth 2024-2029 (%)
      • 13.7 Middle East and Africa - Market size and forecast 2024-2029
        • Chart on Middle East and Africa - Market size and forecast 2024-2029 ($ billion)
        • Data Table on Middle East and Africa - Market size and forecast 2024-2029 ($ billion)
        • Chart on Middle East and Africa - Year-over-year growth 2024-2029 (%)
        • Data Table on Middle East and Africa - Year-over-year growth 2024-2029 (%)
      • 13.8 China - Market size and forecast 2024-2029
        • Chart on China - Market size and forecast 2024-2029 ($ billion)
        • Data Table on China - Market size and forecast 2024-2029 ($ billion)
        • Chart on China - Year-over-year growth 2024-2029 (%)
        • Data Table on China - Year-over-year growth 2024-2029 (%)
      • 13.9 Japan - Market size and forecast 2024-2029
        • Chart on Japan - Market size and forecast 2024-2029 ($ billion)
        • Data Table on Japan - Market size and forecast 2024-2029 ($ billion)
        • Chart on Japan - Year-over-year growth 2024-2029 (%)
        • Data Table on Japan - Year-over-year growth 2024-2029 (%)
      • 13.10 India - Market size and forecast 2024-2029
        • Chart on India - Market size and forecast 2024-2029 ($ billion)
        • Data Table on India - Market size and forecast 2024-2029 ($ billion)
        • Chart on India - Year-over-year growth 2024-2029 (%)
        • Data Table on India - Year-over-year growth 2024-2029 (%)
      • 13.11 Germany - Market size and forecast 2024-2029
        • Chart on Germany - Market size and forecast 2024-2029 ($ billion)
        • Data Table on Germany - Market size and forecast 2024-2029 ($ billion)
        • Chart on Germany - Year-over-year growth 2024-2029 (%)
        • Data Table on Germany - Year-over-year growth 2024-2029 (%)
      • 13.12 UK - Market size and forecast 2024-2029
        • Chart on UK - Market size and forecast 2024-2029 ($ billion)
        • Data Table on UK - Market size and forecast 2024-2029 ($ billion)
        • Chart on UK - Year-over-year growth 2024-2029 (%)
        • Data Table on UK - Year-over-year growth 2024-2029 (%)
      • 13.13 South Korea - Market size and forecast 2024-2029
        • Chart on South Korea - Market size and forecast 2024-2029 ($ billion)
        • Data Table on South Korea - Market size and forecast 2024-2029 ($ billion)
        • Chart on South Korea - Year-over-year growth 2024-2029 (%)
        • Data Table on South Korea - Year-over-year growth 2024-2029 (%)
      • 13.14 Saudi Arabia - Market size and forecast 2024-2029
        • Chart on Saudi Arabia - Market size and forecast 2024-2029 ($ billion)
        • Data Table on Saudi Arabia - Market size and forecast 2024-2029 ($ billion)
        • Chart on Saudi Arabia - Year-over-year growth 2024-2029 (%)
        • Data Table on Saudi Arabia - Year-over-year growth 2024-2029 (%)
      • 13.15 US - Market size and forecast 2024-2029
        • Chart on US - Market size and forecast 2024-2029 ($ billion)
        • Data Table on US - Market size and forecast 2024-2029 ($ billion)
        • Chart on US - Year-over-year growth 2024-2029 (%)
        • Data Table on US - Year-over-year growth 2024-2029 (%)
      • 13.16 France - Market size and forecast 2024-2029
        • Chart on France - Market size and forecast 2024-2029 ($ billion)
        • Data Table on France - Market size and forecast 2024-2029 ($ billion)
        • Chart on France - Year-over-year growth 2024-2029 (%)
        • Data Table on France - Year-over-year growth 2024-2029 (%)
      • 13.17 Canada - Market size and forecast 2024-2029
        • Chart on Canada - Market size and forecast 2024-2029 ($ billion)
        • Data Table on Canada - Market size and forecast 2024-2029 ($ billion)
        • Chart on Canada - Year-over-year growth 2024-2029 (%)
        • Data Table on Canada - Year-over-year growth 2024-2029 (%)
      • 13.18 Market opportunity by geography
        • Market opportunity by geography ($ billion)
        • Data Tables on Market opportunity by geography ($ billion)

      14 Drivers, Challenges, and Opportunity/Restraints

      • 14.1 Market drivers
        • 14.2 Market challenges
          • 14.3 Impact of drivers and challenges
            • Impact of drivers and challenges in 2024 and 2029
          • 14.4 Market opportunities/restraints

            15 Competitive Landscape

            • 15.1 Overview
              • 15.2 Competitive Landscape
                • Overview on criticality of inputs and factors of differentiation
              • 15.3 Landscape disruption
                • Overview on factors of disruption
              • 15.4 Industry risks
                • Impact of key risks on business

              16 Competitive Analysis

              • 16.1 Companies profiled
                • Companies covered
              • 16.2 Company ranking index
                • Company ranking index
              • 16.3 Market positioning of companies
                • Matrix on companies position and classification
              • 16.4 American Eagle Outfitters Inc.
                • American Eagle Outfitters Inc. - Overview
                • American Eagle Outfitters Inc. - Business segments
                • American Eagle Outfitters Inc. - Key offerings
                • American Eagle Outfitters Inc. - Segment focus
                • SWOT
              • 16.5 BAREWEB INC.
                • BAREWEB INC. - Overview
                • BAREWEB INC. - Product / Service
                • BAREWEB INC. - Key offerings
                • SWOT
              • 16.6 Chantelle SA
                • Chantelle SA - Overview
                • Chantelle SA - Product / Service
                • Chantelle SA - Key offerings
                • SWOT
              • 16.7 Embry Holdings Ltd.
                • Embry Holdings Ltd. - Overview
                • Embry Holdings Ltd. - Product / Service
                • Embry Holdings Ltd. - Key offerings
                • SWOT
              • 16.8 Hanesbrands Inc.
                • Hanesbrands Inc. - Overview
                • Hanesbrands Inc. - Business segments
                • Hanesbrands Inc. - Key news
                • Hanesbrands Inc. - Key offerings
                • Hanesbrands Inc. - Segment focus
                • SWOT
              • 16.9 Hanky Panky Ltd.
                • Hanky Panky Ltd. - Overview
                • Hanky Panky Ltd. - Product / Service
                • Hanky Panky Ltd. - Key offerings
                • SWOT
              • 16.10 Jockey International Inc.
                • Jockey International Inc. - Overview
                • Jockey International Inc. - Product / Service
                • Jockey International Inc. - Key offerings
                • SWOT
              • 16.11 PVH Corp.
                • PVH Corp. - Overview
                • PVH Corp. - Business segments
                • PVH Corp. - Key offerings
                • PVH Corp. - Segment focus
                • SWOT
              • 16.12 Shenzhen Huijie Group Co. Ltd.
                • Shenzhen Huijie Group Co. Ltd. - Overview
                • Shenzhen Huijie Group Co. Ltd. - Product / Service
                • Shenzhen Huijie Group Co. Ltd. - Key offerings
                • SWOT
              • 16.13 Sockkobe Co. Ltd.
                • Sockkobe Co. Ltd. - Overview
                • Sockkobe Co. Ltd. - Product / Service
                • Sockkobe Co. Ltd. - Key offerings
                • SWOT
              • 16.14 Stella McCartney Ltd.
                • Stella McCartney Ltd. - Overview
                • Stella McCartney Ltd. - Product / Service
                • Stella McCartney Ltd. - Key offerings
                • SWOT
              • 16.15 Urban Outfitters Inc.
                • Urban Outfitters Inc. - Overview
                • Urban Outfitters Inc. - Business segments
                • Urban Outfitters Inc. - Key offerings
                • Urban Outfitters Inc. - Segment focus
                • SWOT
              • 16.16 Victorias Secret and Co.
                • Victorias Secret and Co. - Overview
                • Victorias Secret and Co. - Product / Service
                • Victorias Secret and Co. - Key offerings
                • SWOT
              • 16.17 Wacoal Holdings Corp.
                • Wacoal Holdings Corp. - Overview
                • Wacoal Holdings Corp. - Business segments
                • Wacoal Holdings Corp. - Key news
                • Wacoal Holdings Corp. - Key offerings
                • Wacoal Holdings Corp. - Segment focus
                • SWOT
              • 16.18 Zivame Platform
                • Zivame Platform - Overview
                • Zivame Platform - Product / Service
                • Zivame Platform - Key offerings
                • SWOT

              17 Appendix

              • 17.1 Scope of the report
                • 17.2 Inclusions and exclusions checklist
                  • Inclusions checklist
                  • Exclusions checklist
                • 17.3 Currency conversion rates for US$
                  • Currency conversion rates for US$
                • 17.4 Research methodology
                  • Research methodology
                • 17.5 Data procurement
                  • Information sources
                • 17.6 Data validation
                  • Data validation
                • 17.7 Validation techniques employed for market sizing
                  • Validation techniques employed for market sizing
                • 17.8 Data synthesis
                  • Data synthesis
                • 17.9 360 degree market analysis
                  • 360 degree market analysis
                • 17.10 List of abbreviations
                  • List of abbreviations

                Research Methodology

                Technavio presents a detailed picture of the market by way of study, synthesis, and summation of data from multiple sources. The analysts have presented the various facets of the market with a particular focus on identifying the key industry influencers. The data thus presented is comprehensive, reliable, and the result of extensive research, both primary and secondary.

                INFORMATION SOURCES

                Primary sources

                • Manufacturers and suppliers
                • Channel partners
                • Industry experts
                • Strategic decision makers

                Secondary sources

                • Industry journals and periodicals
                • Government data
                • Financial reports of key industry players
                • Historical data
                • Press releases

                DATA ANALYSIS

                Data Synthesis

                • Collation of data
                • Estimation of key figures
                • Analysis of derived insights

                Data Validation

                • Triangulation with data models
                • Reference against proprietary databases
                • Corroboration with industry experts

                REPORT WRITING

                Qualitative

                • Market drivers
                • Market challenges
                • Market trends
                • Five forces analysis

                Quantitative

                • Market size and forecast
                • Market segmentation
                • Geographical insights
                • Competitive landscape

                Interested in this report?

                Get your sample now to see our research methodology and insights!

                Download Now

                Frequently Asked Questions

                Intimate Apparel market growth will increase by $ 32 bn during 2025-2029 .

                The Intimate Apparel market is expected to grow at a CAGR of 6.6% during 2025-2029 .

                Intimate Apparel market is segmented by Product( Lower inner wear, Upper inner wear, Sleepwear and loungewear, Thermal wear, Others) Gender( Female, Male) Distribution Channel( Offline, Online, North America, South America, Middle East and Africa)

                American Eagle Outfitters Inc., BAREWEB INC., Chantelle SA, Debenhams Plc, Embry Holdings Ltd., Hanesbrands Inc., Hanky Panky Ltd., Jockey International Inc., Lise Charmel, Marks and Spencer Group plc, MAS Holdings Pvt. Ltd., PVH Corp., Shenzhen Huijie Group Co. Ltd., Sockkobe Co. Ltd., Stella McCartney Ltd., Triumph Intertrade AG, Urban Outfitters Inc., Victorias Secret and Co., Wacoal Holdings Corp., Zivame Platform are a few of the key vendors in the Intimate Apparel market.

                APAC will register the highest growth rate of 48% among the other regions. Therefore, the Intimate Apparel market in APAC is expected to garner significant business opportunities for the vendors during the forecast period.

                China, Japan, India, Germany, UK, South Korea, Saudi Arabia, US, France, Canada

                • Preference for visually appealing intimate apparel among fashion-conscious customers is the driving factor this market.
                • especially womenMost people is the driving factor this market.
                • especially women is the driving factor this market.
                • are particular about their outfits. Although intimate apparel products are worn under outer garments is the driving factor this market.
                • the consumer preference for visually appealing ones with better features is high. While men intimate apparel products have limited options (except for different fit and raw material technology) is the driving factor this market.
                • women intimate apparel products come in different varieties is the driving factor this market.
                • colors is the driving factor this market.
                • and designs to cater to the requirements of different occasions. Bridal intimate apparel products is the driving factor this market.
                • for instance is the driving factor this market.
                • are trending in the market in focus.Many market competitors are coming up with innovative intimate apparel to cater to working women requirements. For instance is the driving factor this market.
                • seamless panties are available in the market in focus is the driving factor this market.
                • which are intended to be worn under formal dresses and pants. The availability of intimate apparel products that cater to different requirements is the driving factor this market.
                • therefore is the driving factor this market.
                • attracts customers. Thus is the driving factor this market.
                • due to such factors the market in focus is expected to witness steady growth throughout the forecast period. is the driving factor this market.

                The Intimate Apparel market vendors should focus on grabbing business opportunities from the Lower inner wear segment as it accounted for the largest market share in the base year.