Low Foam Surfactants Market Analysis APAC, Europe, North America, Middle East and Africa, South America - China, US, Germany, Russia, Japan - Size and Forecast 2024-2028

Low Foam Surfactants Market Analysis APAC, Europe, North America, Middle East and Africa, South America - China, US, Germany, Russia, Japan - Size and Forecast 2024-2028

Published: Jul 2024 191 Pages SKU: IRTNTR70489

Market Overview at a Glance

$6.23 B
Market Opportunity
6.26%
CAGR
5.79
YoY growth 2023-2024(%)

Low Foam Surfactants Market Size 2024-2028

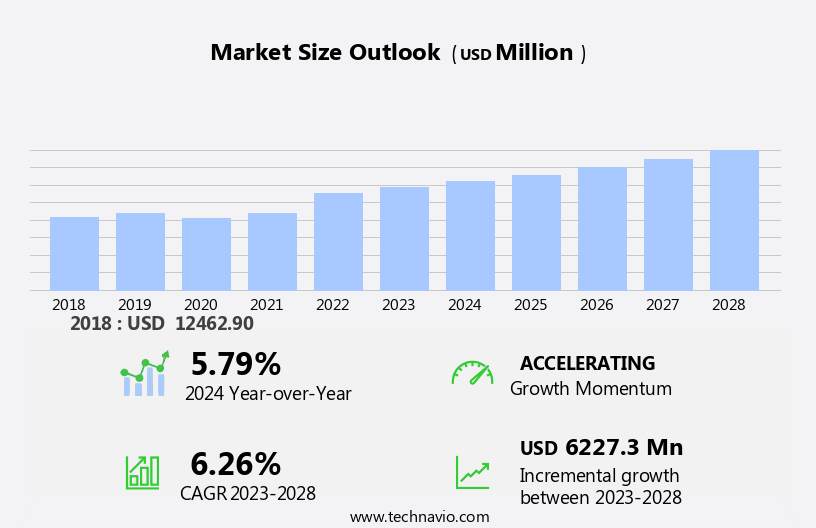
The low foam surfactants market size is forecast to increase by USD 6.23 billion at a CAGR of 6.26% between 2023 and 2028.

  •  The global market for low foam surfactants is experiencing significant growth due to the rising demand for personal care products and increasing usage in detergents and cleaning agents, particularly in developing economies. These surfactants, along with amphoteric surfactants such as betaines, are excellent viscosity builders. Low foam surfactants offer numerous benefits, including improved rinsing, reduced water usage, and enhanced product performance. These factors have led to a surge in demand for low foam surfactants in various industries, including household care, industrial and institutional cleaning, and personal care. As a result, major manufacturers are investing heavily in research and development to meet the growing demand for these high-performance ingredients.

What will be the Size of the Market during the forecast period?

Low Foam Surfactants Market Size

 Request Free Sample

  • The market for low foaming surfactants has gained significant traction in various industries due to their unique properties that offer advantages in applications where minimal foam generation is essential. Surfactants, also known as surface active agents, are compounds that reduce the surface tension between two liquids or between a liquid and a solid. They are widely used in industries such as industrial cleaning, household detergents, agriculture, and environmental applications. Low foaming surfactants are specifically engineered to minimize the production of foam during use. This characteristic is crucial in industries where excessive foam can lead to operational inefficiencies, increased water usage, and potential environmental concerns.
  • The alkoxylation process is a common method used to produce low foaming surfactants. This process involves reacting an alcohol with an alkylating agent, such as an alkyl halide, to form alkoxylated alcohols. The industrial cleaning sector relies heavily on low foaming surfactants for applications like metal cleaning and pulp and paper processing. In metal cleaning, these surfactants aid In the removal of contaminants without generating excessive foam. In the pulp and paper industry, low foaming surfactants are used to enhance the wetting properties of cleaning solutions, improving the efficiency of the cleaning process. In the household detergents sector, low foaming surfactants are gaining popularity due to their eco-friendly and sustainable attributes.

How is this Low Foam Surfactants Industry segmented?

The low foam surfactants industry research report provides comprehensive data (region-wise segment analysis), with forecasts and estimates in "USD billion" for the period 2024-2028, as well as historical data from 2018-2022 for the following segments.
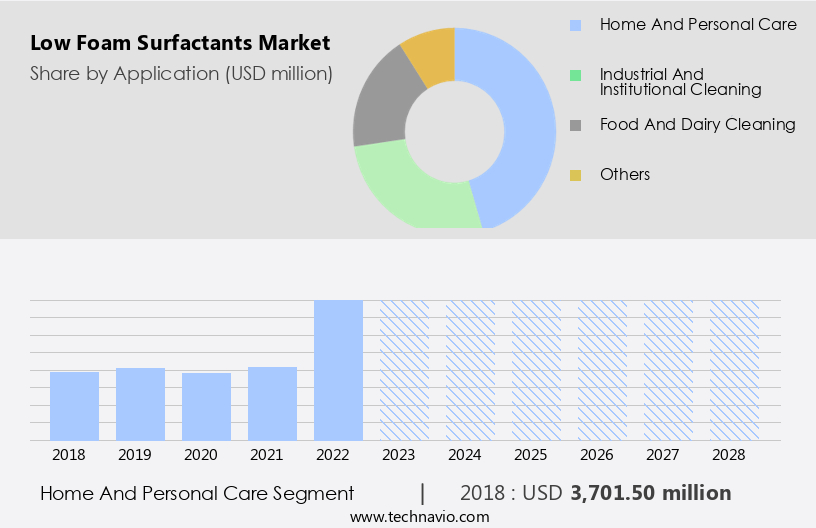
  • Application
    • Home and personal care
    • Industrial and institutional cleaning
    • Food and dairy cleaning
    • Others
  • Type
    • Non-ionic
    • Cationic
    • Amphoteric
  • Geography
    • APAC
      • China
      • Japan
    • Europe
      • Germany
      • Russia
    • North America
      • US
    • Middle East and Africa
    • South America

By Application Insights

The home and personal care segment is estimated to witness significant growth during the forecast period. The use of low foam surfactants in various industries, particularly In the food processing sector and home and personal care applications, is on the rise due to their effectiveness in reducing water surface tension and improving cleaning performance. These surfactants, which include non-ionic, anionic, cationic, and amphoteric types, function as surface active agents in detergents and other cleaning formulations. Their ability to enhance the wetting and spreading properties of water makes them indispensable in dishwashing, floor and wall cleaning, and laundering formulations. The increasing consumer preference for eco-friendly and environmentally responsible products is also fueling the demand for low foam surfactants, as they offer superior cleaning performance with minimal environmental impact.

Low Foam Surfactants Market Size

Get a glance at the market report of share of various segments Request Free Sample

The home and personal care segment was valued at USD 3.7 billion in 2018 and showed a gradual increase during the forecast period.

Regional Analysis

APAC is estimated to contribute 39% to the growth of the global market during the forecast period. Technavio's analysts have elaborately explained the regional trends and drivers that shape the market during the forecast period.

Low Foam Surfactants Market Share by Geography

For more insights on the market size of various regions, Request Free Sample

The Asia Pacific region is projected to witness substantial expansion In the market over the coming years. This growth can be attributed to the rising demand for surfactants in various industries, including personal care, textiles, detergents, and food processing. Countries such as India, China, Thailand, Indonesia, Australia, Japan, Malaysia, the Philippines, and South Korea are key contributors to this market's growth. The increasing urbanization and the escalating consumption of laundry cleaners in households are significant factors fueling the demand for detergents in countries like China and India. Consequently, the market In the Asia Pacific region is anticipated to experience strong growth during the forecast period.

Market Dynamics

Our researchers analyzed the data with 2023 as the base year, along with the key drivers, trends, and challenges. A holistic analysis of drivers will help companies refine their marketing strategies to gain a competitive advantage.

What are the key market drivers leading to the rise In the adoption of Low Foam Surfactants Industry?

  • Rising demand for personal care products is the key driver of the market. The development of a wide range of personal care products is expected to drive the growth of the global market during the forecast period. The high consumption of low foam surfactants in personal care applications is contributed to the growing use of cosmetics and personal care products, such as hair care, skincare, and baby care products. 
  • Low foam surfactants help in cleaning the dirt and producing foam in shower gels, shampoos, and hair conditioners. These surfactants, along with amphoteric surfactants such as betaines, are excellent viscosity builders. Hence, they are highly used in mild shampoos, facial creams, shaving creams, soaps, and conditioners.

What are the market trends shaping the Low Foam Surfactants Industry?

  • Increasing R and D activities is the upcoming market trend. Major companies present in the global market have increased their R and D expenditure to reduce manufacturing costs and provide products with enhanced properties and applications. In recent years, the global market has witnessed a significant increase in R and D spending. 
  • Hence, to maintain a competitive edge and gain market shares, manufacturers are highly focusing on a new range of product development and innovations. Clariant International Plc (Clariant International) offers low foaming surfactants such as Genapol EP 0244, Genapol PN 30, and Genapol EP 2564, which are mainly used as metal surface cleaners. The strong wetting property of these products has increased their adoption among end-users for the formulation of metal cleaners, crop-protecting agents, and home care and industrial cleaning products.

What challenges does the Low Foam Surfactants Industry face during its growth?

  • High cost of low foam surfactants is a key challenge affecting the industry growth. The high cost of low foam surfactants limits their use in various applications, such as personal care, laundry, and other industrial cleaning applications. 
  • The high cost of raw materials, such as fatty alcohol ethoxylates, amine oxides, sulfoxides, cocamide monoethanolamine, and cocamide diethanolamine, can increase the overall production cost of low foam surfactants, which can impede the growth of the market. Moreover, low foam surfactants are priced higher than conventional anionic surfactants. Raw material prices and economies of scale of low foam surfactants are the two major factors contributing to the high cost of production.

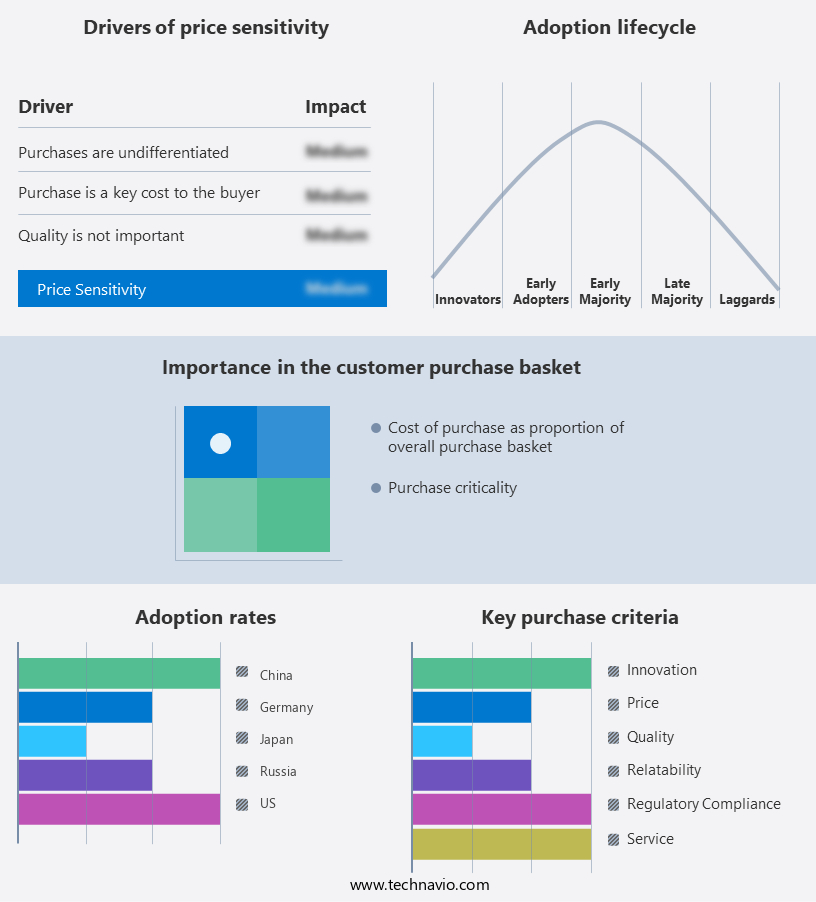
Exclusive Customer Landscape

The market forecasting report includes the adoption lifecycle of the market, covering from the innovator's stage to the laggard's stage. It focuses on adoption rates in different regions based on penetration. Furthermore, the market report also includes key purchase criteria and drivers of price sensitivity to help companies evaluate and develop their market growth analysis strategies.

Low Foam Surfactants Market Share by Geography

 Customer Landscape

Key Companies & Market Insights

Companies are implementing various strategies, such as strategic alliances, market forecast, partnerships, mergers and acquisitions, geographical expansion, and product/service launches, to enhance their presence in the industry.

The industry research and growth report includes detailed analyses of the competitive landscape of the market and information about key companies, including:

  • Air Products and Chemicals Inc.
  • Akzo Nobel NV
  • Arkema SA
  • Ashland Inc.
  • BASF SE
  • Clariant International Ltd.
  • Croda International Plc
  • Dow Inc.
  • Enaspol A.S.
  • EOC Group
  • Galaxy Surfactants Ltd.
  • Huntsman Corp
  • Innospec Inc.
  • Kao Corp.
  • KLK Oleo
  • Marubeni Corp.
  • Nufarm Ltd.
  • RAG Stiftung
  • Solvay SA
  • Stepan Co.
  • The Lubrizol Corp.

Qualitative and quantitative analysis of companies has been conducted to help clients understand the wider business environment as well as the strengths and weaknesses of key industry players. Data is qualitatively analyzed to categorize companies as pure play, category-focused, industry-focused, and diversified; it is quantitatively analyzed to categorize companies as dominant, leading, strong, tentative, and weak.

Research Analyst Overview

The market is witnessing significant growth due to the increasing demand from various industries such as industrial cleaning, household detergents, agriculture, and wastewater treatment. Surfactants, also known as surface active agents, are essential in reducing surface tension and improving wetting properties. In the context of this market, low foaming surfactants have gained popularity due to their environmental benefits. The production of low foaming surfactants involves the alkoxylation process, which utilizes alcohols and alkoxylated alcohols. This process results in synthetic surfactants that offer excellent detergency and dynamic surface tension reduction. Both industrial and household applications benefit from these properties.

In addition, the industrial sector, including pulp and paper, metal cleaning, metal working fluids, oilfield chemicals, and the personal care industry, is a significant consumer of surfactants. The personal care industry, in particular, is driven by the demand for eco-friendly and sustainable products. Environmental regulations have been a key factor In the growth of the low foaming surfactant market. These regulations aim to minimize environmental risks associated with surfactants, such as toxicity and pollution control. As a result, there is a growing trend towards the use of bio-based surfactants derived from renewable sources like vegetable oils and animal fats.

Moreover, the agriculture sector also utilizes surfactants for various applications, including agrochemicals and wastewater treatment facilities. The use of low foaming surfactants In these applications helps to minimize environmental impact and improve overall efficiency. In summary, the low foaming surfactant market is driven by the increasing demand from various industries, environmental regulations, and the shift towards eco-friendly and sustainable products. The production of low foaming surfactants involves the alkoxylation process, and their applications span across industrial and household sectors, agriculture, and personal care.

Market Scope

Report Coverage

Details

Page number

191

Base year

2023

Historic period

2018-2022

Forecast period

2024-2028

Growth momentum & CAGR

Accelerate at a CAGR of 6.26%

Market growth 2024-2028

USD 6.23 billion

Market structure

Fragmented

YoY growth 2023-2024(%)

5.79

Key countries

China, US, Germany, Russia, Japan,

Competitive landscape

Leading Companies, market growth and forecasting, Market Positioning of Companies, Competitive Strategies, and Industry Risks

Request Free Sample

What are the Key Data Covered in this Market Research and Growth Report?

  • CAGR of the Low Foam Surfactants industry during the forecast period
  • Detailed information on factors that will drive the growth and forecasting between 2024 and 2028
  • Precise estimation of the size of the market and its contribution of the industry in focus to the parent market
  • Accurate predictions about upcoming growth and trends and changes in consumer behaviour
  • Growth of the market across APAC, Europe, North America, Middle East and Africa, South America,
  • Thorough analysis of the market's competitive landscape and detailed information about companies
  • Comprehensive analysis of factors that will challenge the market growth of industry companies

We can help! Our analysts can customize this market research report to meet your requirements.

Get in touch

1 Executive Summary

  • 1.1 Market overview
    • Executive Summary - Chart on Market Overview
    • Executive Summary - Data Table on Market Overview
    • Executive Summary - Chart on Global Market Characteristics
    • Executive Summary - Chart on Market by Geography
    • Executive Summary - Chart on Market Segmentation by Application
    • Executive Summary - Chart on Market Segmentation by Type
    • Executive Summary - Chart on Incremental Growth
    • Executive Summary - Data Table on Incremental Growth
    • Executive Summary - Chart on Company Market Positioning

2 Market Landscape

  • 2.1 Market ecosystem
    • Parent Market
    • Data Table on - Parent Market
  • 2.2 Market characteristics
    • Market characteristics analysis
  • 2.3 Value chain analysis
    • Value Chain Analysis

3 Market Sizing

  • 3.1 Market definition
    • Offerings of companies included in the market definition
  • 3.2 Market segment analysis
    • Market segments
  • 3.3 Market size 2023
    • 3.4 Market outlook: Forecast for 2023-2028
      • Chart on Global - Market size and forecast 2023-2028 ($ million)
      • Data Table on Global - Market size and forecast 2023-2028 ($ million)
      • Chart on Global Market: Year-over-year growth 2023-2028 (%)
      • Data Table on Global Market: Year-over-year growth 2023-2028 (%)

    4 Historic Market Size

    • 4.1 Global Low Foam Surfactants Market 2018 - 2022
      • Historic Market Size - Data Table on Global Low Foam Surfactants Market 2018 - 2022 ($ million)
    • 4.2 Application segment analysis 2018 - 2022
      • Historic Market Size - Application Segment 2018 - 2022 ($ million)
    • 4.3 Type segment analysis 2018 - 2022
      • Historic Market Size - Type Segment 2018 - 2022 ($ million)
    • 4.4 Geography segment analysis 2018 - 2022
      • Historic Market Size - Geography Segment 2018 - 2022 ($ million)
    • 4.5 Country segment analysis 2018 - 2022
      • Historic Market Size - Country Segment 2018 - 2022 ($ million)

    5 Five Forces Analysis

    • 5.1 Five forces summary
      • Five forces analysis - Comparison between 2023 and 2028
    • 5.2 Bargaining power of buyers
      • Bargaining power of buyers - Impact of key factors 2023 and 2028
    • 5.3 Bargaining power of suppliers
      • Bargaining power of suppliers - Impact of key factors in 2023 and 2028
    • 5.4 Threat of new entrants
      • Threat of new entrants - Impact of key factors in 2023 and 2028
    • 5.5 Threat of substitutes
      • Threat of substitutes - Impact of key factors in 2023 and 2028
    • 5.6 Threat of rivalry
      • Threat of rivalry - Impact of key factors in 2023 and 2028
    • 5.7 Market condition
      • Chart on Market condition - Five forces 2023 and 2028

    6 Market Segmentation by Application

    • 6.1 Market segments
      • Chart on Application - Market share 2023-2028 (%)
      • Data Table on Application - Market share 2023-2028 (%)
    • 6.2 Comparison by Application
      • Chart on Comparison by Application
      • Data Table on Comparison by Application
    • 6.3 Home and personal care - Market size and forecast 2023-2028
      • Chart on Home and personal care - Market size and forecast 2023-2028 ($ million)
      • Data Table on Home and personal care - Market size and forecast 2023-2028 ($ million)
      • Chart on Home and personal care - Year-over-year growth 2023-2028 (%)
      • Data Table on Home and personal care - Year-over-year growth 2023-2028 (%)
    • 6.4 Industrial and institutional cleaning - Market size and forecast 2023-2028
      • Chart on Industrial and institutional cleaning - Market size and forecast 2023-2028 ($ million)
      • Data Table on Industrial and institutional cleaning - Market size and forecast 2023-2028 ($ million)
      • Chart on Industrial and institutional cleaning - Year-over-year growth 2023-2028 (%)
      • Data Table on Industrial and institutional cleaning - Year-over-year growth 2023-2028 (%)
    • 6.5 Food and dairy cleaning - Market size and forecast 2023-2028
      • Chart on Food and dairy cleaning - Market size and forecast 2023-2028 ($ million)
      • Data Table on Food and dairy cleaning - Market size and forecast 2023-2028 ($ million)
      • Chart on Food and dairy cleaning - Year-over-year growth 2023-2028 (%)
      • Data Table on Food and dairy cleaning - Year-over-year growth 2023-2028 (%)
    • 6.6 Others - Market size and forecast 2023-2028
      • Chart on Others - Market size and forecast 2023-2028 ($ million)
      • Data Table on Others - Market size and forecast 2023-2028 ($ million)
      • Chart on Others - Year-over-year growth 2023-2028 (%)
      • Data Table on Others - Year-over-year growth 2023-2028 (%)
    • 6.7 Market opportunity by Application
      • Market opportunity by Application ($ million)
      • Data Table on Market opportunity by Application ($ million)

    7 Market Segmentation by Type

    • 7.1 Market segments
      • Chart on Type - Market share 2023-2028 (%)
      • Data Table on Type - Market share 2023-2028 (%)
    • 7.2 Comparison by Type
      • Chart on Comparison by Type
      • Data Table on Comparison by Type
    • 7.3 Non-ionic - Market size and forecast 2023-2028
      • Chart on Non-ionic - Market size and forecast 2023-2028 ($ million)
      • Data Table on Non-ionic - Market size and forecast 2023-2028 ($ million)
      • Chart on Non-ionic - Year-over-year growth 2023-2028 (%)
      • Data Table on Non-ionic - Year-over-year growth 2023-2028 (%)
    • 7.4 Cationic - Market size and forecast 2023-2028
      • Chart on Cationic - Market size and forecast 2023-2028 ($ million)
      • Data Table on Cationic - Market size and forecast 2023-2028 ($ million)
      • Chart on Cationic - Year-over-year growth 2023-2028 (%)
      • Data Table on Cationic - Year-over-year growth 2023-2028 (%)
    • 7.5 Amphoteric - Market size and forecast 2023-2028
      • Chart on Amphoteric - Market size and forecast 2023-2028 ($ million)
      • Data Table on Amphoteric - Market size and forecast 2023-2028 ($ million)
      • Chart on Amphoteric - Year-over-year growth 2023-2028 (%)
      • Data Table on Amphoteric - Year-over-year growth 2023-2028 (%)
    • 7.6 Market opportunity by Type
      • Market opportunity by Type ($ million)
      • Data Table on Market opportunity by Type ($ million)

    8 Customer Landscape

    • 8.1 Customer landscape overview
      • Analysis of price sensitivity, lifecycle, customer purchase basket, adoption rates, and purchase criteria

    9 Geographic Landscape

    • 9.1 Geographic segmentation
      • Chart on Market share by geography 2023-2028 (%)
      • Data Table on Market share by geography 2023-2028 (%)
    • 9.2 Geographic comparison
      • Chart on Geographic comparison
      • Data Table on Geographic comparison
    • 9.3 APAC - Market size and forecast 2023-2028
      • Chart on APAC - Market size and forecast 2023-2028 ($ million)
      • Data Table on APAC - Market size and forecast 2023-2028 ($ million)
      • Chart on APAC - Year-over-year growth 2023-2028 (%)
      • Data Table on APAC - Year-over-year growth 2023-2028 (%)
    • 9.4 Europe - Market size and forecast 2023-2028
      • Chart on Europe - Market size and forecast 2023-2028 ($ million)
      • Data Table on Europe - Market size and forecast 2023-2028 ($ million)
      • Chart on Europe - Year-over-year growth 2023-2028 (%)
      • Data Table on Europe - Year-over-year growth 2023-2028 (%)
    • 9.5 North America - Market size and forecast 2023-2028
      • Chart on North America - Market size and forecast 2023-2028 ($ million)
      • Data Table on North America - Market size and forecast 2023-2028 ($ million)
      • Chart on North America - Year-over-year growth 2023-2028 (%)
      • Data Table on North America - Year-over-year growth 2023-2028 (%)
    • 9.6 Middle East and Africa - Market size and forecast 2023-2028
      • Chart on Middle East and Africa - Market size and forecast 2023-2028 ($ million)
      • Data Table on Middle East and Africa - Market size and forecast 2023-2028 ($ million)
      • Chart on Middle East and Africa - Year-over-year growth 2023-2028 (%)
      • Data Table on Middle East and Africa - Year-over-year growth 2023-2028 (%)
    • 9.7 South America - Market size and forecast 2023-2028
      • Chart on South America - Market size and forecast 2023-2028 ($ million)
      • Data Table on South America - Market size and forecast 2023-2028 ($ million)
      • Chart on South America - Year-over-year growth 2023-2028 (%)
      • Data Table on South America - Year-over-year growth 2023-2028 (%)
    • 9.8 China - Market size and forecast 2023-2028
      • Chart on China - Market size and forecast 2023-2028 ($ million)
      • Data Table on China - Market size and forecast 2023-2028 ($ million)
      • Chart on China - Year-over-year growth 2023-2028 (%)
      • Data Table on China - Year-over-year growth 2023-2028 (%)
    • 9.9 Germany - Market size and forecast 2023-2028
      • Chart on Germany - Market size and forecast 2023-2028 ($ million)
      • Data Table on Germany - Market size and forecast 2023-2028 ($ million)
      • Chart on Germany - Year-over-year growth 2023-2028 (%)
      • Data Table on Germany - Year-over-year growth 2023-2028 (%)
    • 9.10 US - Market size and forecast 2023-2028
      • Chart on US - Market size and forecast 2023-2028 ($ million)
      • Data Table on US - Market size and forecast 2023-2028 ($ million)
      • Chart on US - Year-over-year growth 2023-2028 (%)
      • Data Table on US - Year-over-year growth 2023-2028 (%)
    • 9.11 Russia - Market size and forecast 2023-2028
      • Chart on Russia - Market size and forecast 2023-2028 ($ million)
      • Data Table on Russia - Market size and forecast 2023-2028 ($ million)
      • Chart on Russia - Year-over-year growth 2023-2028 (%)
      • Data Table on Russia - Year-over-year growth 2023-2028 (%)
    • 9.12 Japan - Market size and forecast 2023-2028
      • Chart on Japan - Market size and forecast 2023-2028 ($ million)
      • Data Table on Japan - Market size and forecast 2023-2028 ($ million)
      • Chart on Japan - Year-over-year growth 2023-2028 (%)
      • Data Table on Japan - Year-over-year growth 2023-2028 (%)
    • 9.13 Market opportunity by geography
      • Market opportunity by geography ($ million)
      • Data Tables on Market opportunity by geography ($ million)

    10 Drivers, Challenges, and Opportunity/Restraints

    • 10.1 Market drivers
      • 10.2 Market challenges
        • 10.3 Impact of drivers and challenges
          • Impact of drivers and challenges in 2023 and 2028
        • 10.4 Market opportunities/restraints

          11 Competitive Landscape

          • 11.1 Overview
            • 11.2 Competitive Landscape
              • Overview on criticality of inputs and factors of differentiation
            • 11.3 Landscape disruption
              • Overview on factors of disruption
            • 11.4 Industry risks
              • Impact of key risks on business

            12 Competitive Analysis

            • 12.1 Companies profiled
              • Companies covered
            • 12.2 Market positioning of companies
              • Matrix on companies position and classification
            • 12.3 Air Products and Chemicals Inc.
              • Air Products and Chemicals Inc. - Overview
              • Air Products and Chemicals Inc. - Business segments
              • Air Products and Chemicals Inc. - Key news
              • Air Products and Chemicals Inc. - Key offerings
              • Air Products and Chemicals Inc. - Segment focus
            • 12.4 Akzo Nobel NV
              • Akzo Nobel NV - Overview
              • Akzo Nobel NV - Business segments
              • Akzo Nobel NV - Key news
              • Akzo Nobel NV - Key offerings
              • Akzo Nobel NV - Segment focus
            • 12.5 Arkema SA
              • Arkema SA - Overview
              • Arkema SA - Business segments
              • Arkema SA - Key news
              • Arkema SA - Key offerings
              • Arkema SA - Segment focus
            • 12.6 Ashland Inc.
              • Ashland Inc. - Overview
              • Ashland Inc. - Business segments
              • Ashland Inc. - Key news
              • Ashland Inc. - Key offerings
              • Ashland Inc. - Segment focus
            • 12.7 BASF SE
              • BASF SE - Overview
              • BASF SE - Business segments
              • BASF SE - Key news
              • BASF SE - Key offerings
              • BASF SE - Segment focus
            • 12.8 Clariant International Ltd.
              • Clariant International Ltd. - Overview
              • Clariant International Ltd. - Business segments
              • Clariant International Ltd. - Key news
              • Clariant International Ltd. - Key offerings
              • Clariant International Ltd. - Segment focus
            • 12.9 Croda International Plc
              • Croda International Plc - Overview
              • Croda International Plc - Business segments
              • Croda International Plc - Key news
              • Croda International Plc - Key offerings
              • Croda International Plc - Segment focus
            • 12.10 Dow Inc.
              • Dow Inc. - Overview
              • Dow Inc. - Business segments
              • Dow Inc. - Key news
              • Dow Inc. - Key offerings
              • Dow Inc. - Segment focus
            • 12.11 Galaxy Surfactants Ltd.
              • Galaxy Surfactants Ltd. - Overview
              • Galaxy Surfactants Ltd. - Product / Service
              • Galaxy Surfactants Ltd. - Key offerings
            • 12.12 Huntsman Corp
              • Huntsman Corp - Overview
              • Huntsman Corp - Business segments
              • Huntsman Corp - Key news
              • Huntsman Corp - Key offerings
              • Huntsman Corp - Segment focus
            • 12.13 Innospec Inc.
              • Innospec Inc. - Overview
              • Innospec Inc. - Business segments
              • Innospec Inc. - Key offerings
              • Innospec Inc. - Segment focus
            • 12.14 Kao Corp.
              • Kao Corp. - Overview
              • Kao Corp. - Business segments
              • Kao Corp. - Key news
              • Kao Corp. - Key offerings
              • Kao Corp. - Segment focus
            • 12.15 RAG Stiftung
              • RAG Stiftung - Overview
              • RAG Stiftung - Product / Service
              • RAG Stiftung - Key offerings
            • 12.16 Solvay SA
              • Solvay SA - Overview
              • Solvay SA - Business segments
              • Solvay SA - Key news
              • Solvay SA - Key offerings
              • Solvay SA - Segment focus
            • 12.17 Stepan Co.
              • Stepan Co. - Overview
              • Stepan Co. - Business segments
              • Stepan Co. - Key news
              • Stepan Co. - Key offerings
              • Stepan Co. - Segment focus

            13 Appendix

            • 13.1 Scope of the report
              • 13.2 Inclusions and exclusions checklist
                • Inclusions checklist
                • Exclusions checklist
              • 13.3 Currency conversion rates for US$
                • Currency conversion rates for US$
              • 13.4 Research methodology
                • Research methodology
              • 13.5 Data procurement
                • Information sources
              • 13.6 Data validation
                • Data validation
              • 13.7 Validation techniques employed for market sizing
                • Validation techniques employed for market sizing
              • 13.8 Data synthesis
                • Data synthesis
              • 13.9 360 degree market analysis
                • 360 degree market analysis
              • 13.10 List of abbreviations
                • List of abbreviations

              Research Methodology

              Technavio presents a detailed picture of the market by way of study, synthesis, and summation of data from multiple sources. The analysts have presented the various facets of the market with a particular focus on identifying the key industry influencers. The data thus presented is comprehensive, reliable, and the result of extensive research, both primary and secondary.

              INFORMATION SOURCES

              Primary sources

              • Manufacturers and suppliers
              • Channel partners
              • Industry experts
              • Strategic decision makers

              Secondary sources

              • Industry journals and periodicals
              • Government data
              • Financial reports of key industry players
              • Historical data
              • Press releases

              DATA ANALYSIS

              Data Synthesis

              • Collation of data
              • Estimation of key figures
              • Analysis of derived insights

              Data Validation

              • Triangulation with data models
              • Reference against proprietary databases
              • Corroboration with industry experts

              REPORT WRITING

              Qualitative

              • Market drivers
              • Market challenges
              • Market trends
              • Five forces analysis

              Quantitative

              • Market size and forecast
              • Market segmentation
              • Geographical insights
              • Competitive landscape

              Interested in this report?

              Get your sample now to see our research methodology and insights!

              Download Now

              Frequently Asked Questions

              Low Foam Surfactants market growth will increase by $ 6227.3 mn during 2024-2028.

              The Low Foam Surfactants market is expected to grow at a CAGR of 6.26% during 2024-2028.

              Low Foam Surfactants market is segmented by Application( Home and personal care, Industrial and institutional cleaning, Food and dairy cleaning, Others) Type( Non-ionic, Cationic, Amphoteric, MEA, South America)

              Air Products and Chemicals Inc., Akzo Nobel NV, Arkema SA, Ashland Inc., BASF SE, Clariant International Ltd., Croda International Plc, Dow Inc., Enaspol A.S., EOC Group, Galaxy Surfactants Ltd., Huntsman Corp, Innospec Inc., Kao Corp., KLK Oleo, Marubeni Corp., Nufarm Ltd., RAG Stiftung, Solvay SA, Stepan Co., The Lubrizol Corp. are a few of the key vendors in the Low Foam Surfactants market.

              APAC will register the highest growth rate of 39% among the other regions. Therefore, the Low Foam Surfactants market in APAC is expected to garner significant business opportunities for the vendors during the forecast period.

              China, US, Germany, Russia, Japan

              • Rising demand for personal care productsThe development of a wide range of personal care products is expected to drive the growth of the global low foam surfactants market during the forecast period. The high consumption of low foam surfactants in personal care applications is contributed to the growing use of cosmetics and personal care products is the driving factor this market.
              • such as hair care is the driving factor this market.
              • skincare is the driving factor this market.
              • and baby care products. Low foam surfactants help in cleaning the dirt and producing foam in shower gels is the driving factor this market.
              • shampoos is the driving factor this market.
              • and hair conditioners. These surfactants is the driving factor this market.
              • along with amphoteric surfactants such as betaines is the driving factor this market.
              • are excellent viscosity builders. Hence is the driving factor this market.
              • they are highly used in mild shampoos is the driving factor this market.
              • facial creams is the driving factor this market.
              • shaving creams is the driving factor this market.
              • soaps is the driving factor this market.
              • and conditioners. Surfactants that are compatible with the skin function as emulsifiers is the driving factor this market.
              • and they stabilize oil droplets or water in lotions and creams. These emulsifiers in sunscreen and skin care cosmetics are absorbed quickly by the skin and do not cause a greasy and shiny film on the skins surface. They also do not leave grease spots on the clothing. In lipstick and make-up is the driving factor this market.
              • surfactants are mainly used in the dispersion of color pigments. Hence is the driving factor this market.
              • the growing demand for personal care products is expected to boost the demand for surfactants is the driving factor this market.
              • which will drive the growth of the global low foam surfactants market during the forecast period. Consumers are interested in personal care products that are mild in nature and gentle to the skin. Low foam surfactants are less likely to cause irritation on the skin and eyes; hence is the driving factor this market.
              • they are widely accepted by personal care product manufacturers to develop a wide range of personal care products. Hence is the driving factor this market.
              • the growth of the global personal care market is expected to boost the demand for low foam surfactants. In February 2022 is the driving factor this market.
              • Dow Inc announced an agreement with Locus Performance Ingredients to sell Locus PIs line of sophorolipid biosurfactants to the personal care market. Such factors will foster the growth of the global low foam surfactants market during the forecast period. is the driving factor this market.

              The Low Foam Surfactants market vendors should focus on grabbing business opportunities from the Home and personal care segment as it accounted for the largest market share in the base year.
              RIA - Research AI Assistant
              Ask RIA