Luxury Apparel Market Size 2026-2030
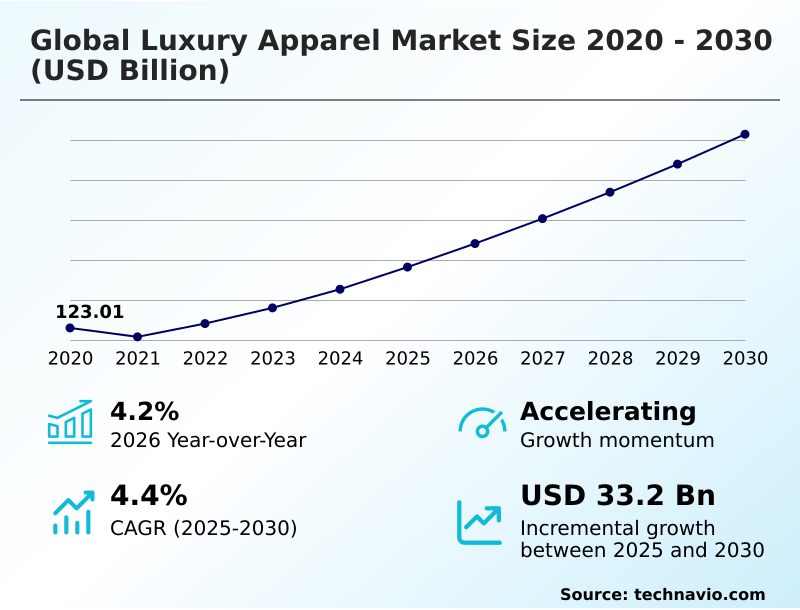
The luxury apparel market size is valued to increase by USD 33.20 billion, at a CAGR of 4.4% from 2025 to 2030. Strategic mainstreaming of circular ecosystems and regenerative luxury models will drive the luxury apparel market.
Major Market Trends & Insights
- APAC dominated the market and accounted for a 42.3% growth during the forecast period.
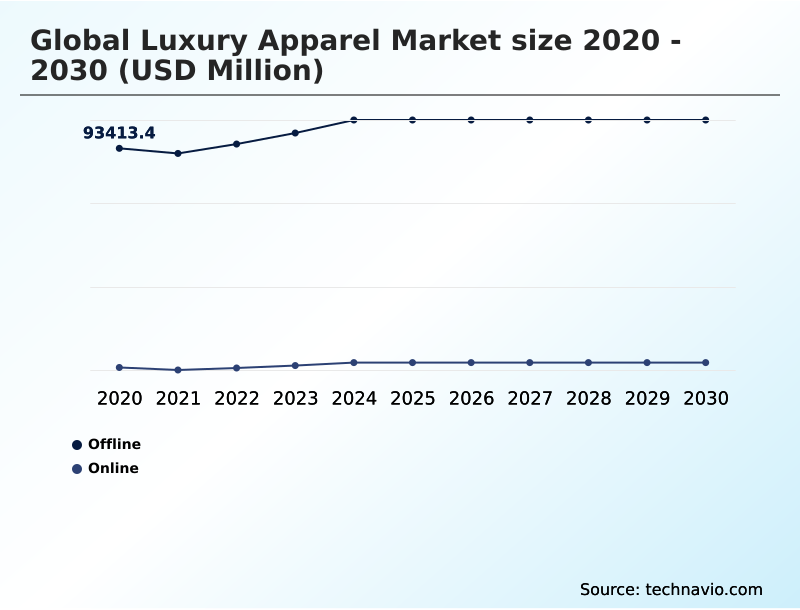
- By Distribution Channel - Offline segment was valued at USD 101.66 billion in 2024
- By End-user - Men segment accounted for the largest market revenue share in 2024
Market Size & Forecast
- Market Opportunities: USD 48.42 billion
- Market Future Opportunities: USD 33.20 billion
- CAGR from 2025 to 2030 : 4.4%
Market Summary
- The luxury apparel market is undergoing a significant transformation, moving beyond seasonal trends to prioritize enduring value and sustainability. Core to this shift is the rise of quiet luxury, where discerning consumers favor artisanal craftsmanship and exceptional materials over conspicuous logos.
- This trend is reinforced by the adoption of technologies like the digital product passport, which uses blockchain authentication to provide supply chain transparency and verify authenticity, building consumer trust. A key driver is the move toward circular ecosystems, with brands launching brand-owned resale platforms and emphasizing repairability to extend garment lifecycles.
- For instance, a fashion house can leverage data from its resale platform to refine production forecasts, reducing overstock by over 20% and aligning with sustainability mandates. However, the industry faces challenges from structural consumer polarization, where aspirational buyers retreat while top-tier clients demand greater exclusivity.
- Success hinges on balancing brand heritage with innovation, delivering a seamless omnichannel shopping experience, and proving cultural legitimacy in a discerning global landscape.
What will be the Size of the Luxury Apparel Market during the forecast period?
Get Key Insights on Market Forecast (PDF) Get Free Sample
How is the Luxury Apparel Market Segmented?
The luxury apparel industry research report provides comprehensive data (region-wise segment analysis), with forecasts and estimates in "USD million" for the period 2026-2030, as well as historical data from 2020-2024 for the following segments.
- Distribution channel
- Offline
- Online
- End-user
- Men
- Women
- Product type
- Clothing
- Footwear
- Others
- Geography
- APAC
- China
- Japan
- South Korea
- North America
- US
- Canada
- Mexico
- Europe
- France
- Italy
- UK
- Middle East and Africa
- UAE
- Saudi Arabia
- South Africa
- South America
- Brazil
- Argentina
- Colombia
- Rest of World (ROW)
- APAC
By Distribution Channel Insights
The offline segment is estimated to witness significant growth during the forecast period.
The offline segment remains the primary channel for the luxury apparel market, functioning as a vital theater for brand storytelling and consumer engagement.
Physical boutiques provide an indispensable tactile environment where consumers can appreciate the artisanal craftsmanship and premium fiber quality that define haute couture and justify premium pricing.
These locations are evolving into experiential retail environment hubs, integrating art and hospitality to foster deep brand loyalty. This strategy is essential for managing brand dilution risk and reinforcing cultural legitimacy.
As brands pivot, underperforming stores are being replaced with hyper-localized flagships in key hubs, blending heritage-led storytelling with technology.
These high-concept spaces, showcasing everything from luxury sportswear to avant-garde design and luxury outerwear, see improved performance, with some achieving a 15% reduction in stock discrepancies through advanced inventory management optimization.
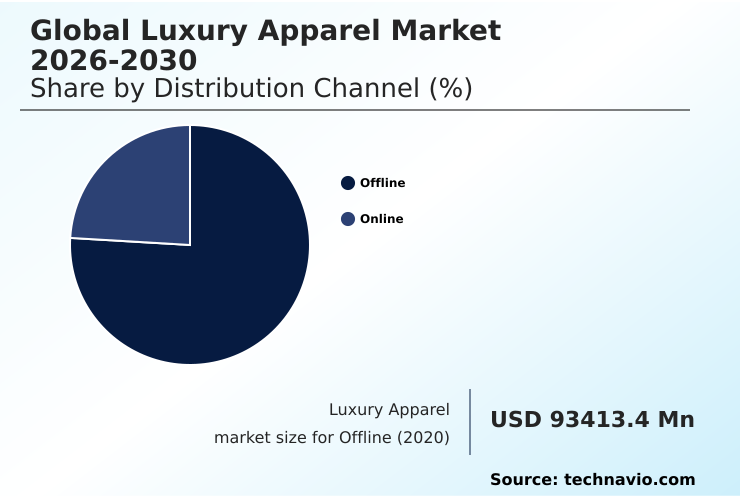
The Offline segment was valued at USD 101.66 billion in 2024 and showed a gradual increase during the forecast period.
Regional Analysis
APAC is estimated to contribute 42.3% to the growth of the global market during the forecast period.Technavio’s analysts have elaborately explained the regional trends and drivers that shape the market during the forecast period.
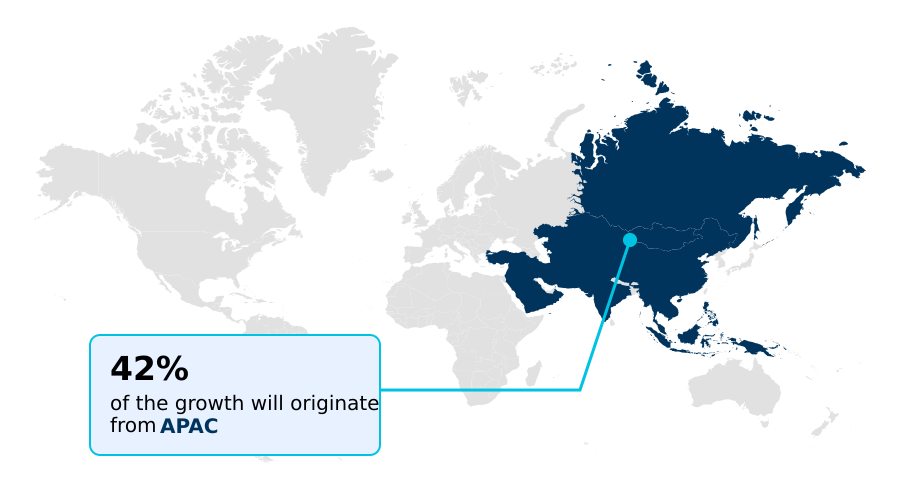
See How Luxury Apparel Market Demand is Rising in APAC Get Free Sample
The geographic landscape is shifting, with APAC representing 42.3% of incremental growth, driven by wealth-centric demand in emerging hubs. While North America remains a key market, brands are adapting their fashion maison strategy to cater to diverse regional tastes.
In Asia, a strong digital narrative is crucial, with consumers responding to brands that integrate technical fashion element innovations and demonstrate cultural legitimacy. The adoption of blockchain authentication is higher in these markets, where it addresses consumer concerns about counterfeits.
In Europe, the focus is on the sustainable luxury model, with regulations pushing for greater transparency. The growth of sustainable menswear, for instance, is 30% faster in Europe than in other regions.
This regional divergence challenges global luxury pricing power and requires a nuanced approach to product and marketing.
Market Dynamics
Our researchers analyzed the data with 2025 as the base year, along with the key drivers, trends, and challenges. A holistic analysis of drivers will help companies refine their marketing strategies to gain a competitive advantage.
- The luxury apparel market is at a strategic inflection point where long-term value creation is being redefined. A central debate revolves around the impact of circularity on brand value, as companies balance the opportunities of the resale market with the need to protect exclusivity.
- This is closely linked to the aesthetic shift of quiet luxury vs logo-heavy designs, a trend driven by sophisticated consumers who prioritize craftsmanship over overt branding. Technology is a key enabler in this new landscape, with the role of AI in personalized clienteling becoming critical for fostering loyalty among top-tier customers.
- Firms using AI to tailor recommendations have seen repeat purchase rates increase by double digits compared to those that do not. Furthermore, the digital product passport adoption benefits extend beyond anti-counterfeiting to include enhanced storytelling and transparent lifecycle tracking.
- This directly addresses the growing demand for sustainable material sourcing in luxury, allowing brands to verifiably showcase their commitment to ethical and environmental standards. Successfully navigating the complexities of luxury apparel supply chain challenges while integrating technology in luxury retail is paramount. As companies analyze the profound consumer shift to experiential luxury, they must re-evaluate physical and digital touchpoints.
- Understanding the nuances of men's luxury apparel market trends and effectively managing brand equity in resale markets will separate the leaders from the laggards in the coming years.
What are the key market drivers leading to the rise in the adoption of Luxury Apparel Industry?
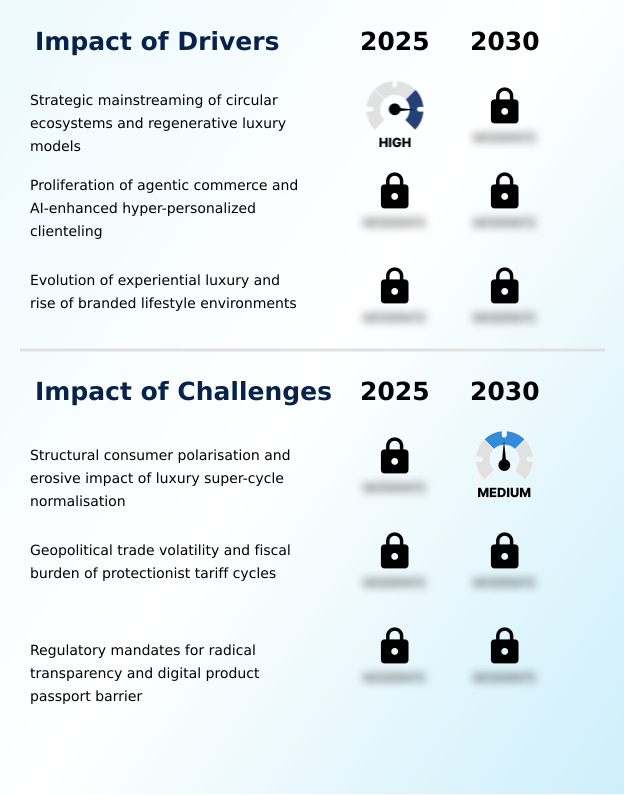
- The strategic mainstreaming of circular ecosystems and regenerative luxury models is a key driver for the luxury apparel market.
- A primary driver is the strategic adoption of sustainability, which aligns with evolving eco-literate shopper values.
- The implementation of a digital product passport is becoming standard, meeting the supply chain transparency mandate and reducing counterfeit risks by 40% in some pilot programs. This focus on authenticity reinforces the appeal of quiet luxury.
- Brands are launching brand-owned resale platforms to control their secondary market, mitigating brand dilution risk while capturing a new revenue stream. The push for regenerative sourcing of materials is also gaining momentum.
- This is complemented by investments in high-fidelity retail and a sophisticated digital engagement strategy, where interactive online experiences have been shown to increase conversion rates by over 18%.
What are the market trends shaping the Luxury Apparel Industry?
- The market is increasingly shaped by the proliferation of wealth-centric demand, driven by a growing population of high-net-worth individuals.
- A key trend is the pivot toward experiential luxury, where brands create immersive retail worlds. This move caters to sustained high-net-worth individual spending following the post-pandemic super-cycle. Heritage-led storytelling is now central to brand narratives, distinguishing authentic players. This is coupled with hyper-personalized clienteling, where AI-driven platforms have improved customer retention by up to 25%.
- As aspirational consumer behavior wanes, the focus shifts to longevity, fueling luxury resale market growth and the adoption of circular ecosystems. Firms offering bespoke tailoring are seeing renewed interest, with digital fitting technologies reducing material waste by 15%, highlighting a shift from transient fashion to enduring investment pieces.
What challenges does the Luxury Apparel Industry face during its growth?
- A key challenge affecting industry growth is the structural consumer polarization and the erosive impact of luxury super-cycle normalization.
- The market faces challenges from heightened consumer price sensitivity, even among affluent demographics, which complicates pricing for items made from premium fiber. Delivering a seamless omnichannel shopping experience across digital and physical realms remains a complex operational hurdle, with integration failures leading to a 10% dip in customer satisfaction for some brands.
- Balancing the high costs of haute couture and made-to-measure services against fluctuating demand requires sophisticated inventory management optimization. The expansion of categories like luxury sportswear and the establishment of men-only flagship stores demand significant capital investment.
- Moreover, ineffective regional heritage marketing can fail to connect with local consumers, a risk that has led to regional sales underperforming projections by as much as 15% in certain new market entries.
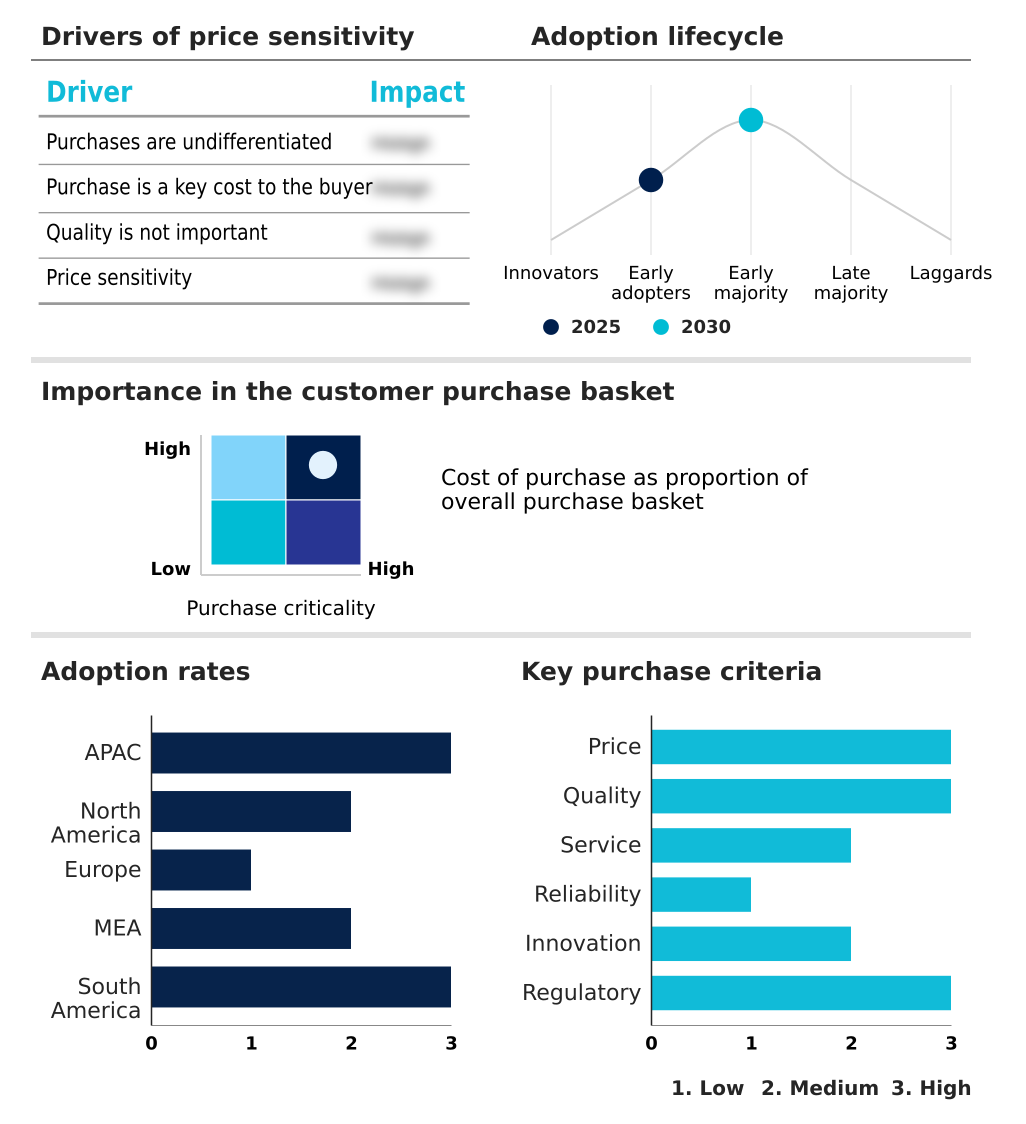
Exclusive Technavio Analysis on Customer Landscape
The luxury apparel market forecasting report includes the adoption lifecycle of the market, covering from the innovator’s stage to the laggard’s stage. It focuses on adoption rates in different regions based on penetration. Furthermore, the luxury apparel market report also includes key purchase criteria and drivers of price sensitivity to help companies evaluate and develop their market growth analysis strategies.
Customer Landscape of Luxury Apparel Industry
Competitive Landscape
Companies are implementing various strategies, such as strategic alliances, luxury apparel market forecast, partnerships, mergers and acquisitions, geographical expansion, and product/service launches, to enhance their presence in the industry.
Brunello Cucinelli SpA - Offerings center on high-end apparel defined by superior craftsmanship, exclusive design, and significant brand heritage, including ready-to-wear collections, couture, and bespoke services.
The industry research and growth report includes detailed analyses of the competitive landscape of the market and information about key companies, including:
- Brunello Cucinelli SpA
- Burberry Group plc
- Chanel Ltd.
- Ermenegildo Zegna NV
- Giorgio Armani SpA
- Guccio Gucci SpA
- Hermes International SA
- Hugo Boss AG
- Kering SA
- LVMH Moet Hennessy
- Michael Kors Inc.
- Moncler SPA
- Prada SpA
- PVH Corp.
- Ralph Lauren Corp.
- Salvatore Ferragamo SpA
- Tapestry Inc.
Qualitative and quantitative analysis of companies has been conducted to help clients understand the wider business environment as well as the strengths and weaknesses of key industry players. Data is qualitatively analyzed to categorize companies as pure play, category-focused, industry-focused, and diversified; it is quantitatively analyzed to categorize companies as dominant, leading, strong, tentative, and weak.
Recent Development and News in Luxury apparel market
- In September 2024, Kering SA announced a strategic roadmap focused on elevating brand desirability and streamlining operations, including the divestment of non-core beauty activities to concentrate on its primary apparel and leather goods portfolios.
- In November 2024, Prada SpA expanded its creative leadership by appointing a new Chief Creative Officer for one of its major acquired brands, signaling a move to refresh design language and capture a younger demographic.
- In February 2025, Loewe, part of the LVMH group, opened its largest Asian flagship store in Shanghai, a 'CASA Loewe' concept featuring store-exclusive collections to cater to local consumer tastes and reinforce its presence in the critical Chinese market.
- In April 2025, Burberry Group plc launched a new digital platform integrating blockchain technology to offer customers a 'digital product passport' for its iconic trench coats, enhancing transparency and combating counterfeits.
Dive into Technavio’s robust research methodology, blending expert interviews, extensive data synthesis, and validated models for unparalleled Luxury Apparel Market insights. See full methodology.
| Market Scope | |
|---|---|
| Page number | 281 |
| Base year | 2025 |
| Historic period | 2020-2024 |
| Forecast period | 2026-2030 |
| Growth momentum & CAGR | Accelerate at a CAGR of 4.4% |
| Market growth 2026-2030 | USD 33203.2 million |
| Market structure | Fragmented |
| YoY growth 2025-2026(%) | 4.2% |
| Key countries | China, Japan, South Korea, India, Australia, Indonesia, US, Canada, Mexico, France, Italy, UK, Germany, Switzerland, Spain, UAE, Saudi Arabia, Qatar, South Africa, Egypt, Brazil, Argentina and Colombia |
| Competitive landscape | Leading Companies, Market Positioning of Companies, Competitive Strategies, and Industry Risks |
Research Analyst Overview
- The luxury apparel market is pivoting toward a model defined by artisanal craftsmanship and intrinsic value. The prevailing trend of quiet luxury has shifted boardroom focus to brand heritage and heritage-led storytelling as primary differentiators. This move is supported by technologies like the digital product passport, which leverages blockchain authentication to ensure transparency.
- In response to consumer demand and regulatory pressure, firms are integrating circular ecosystems and regenerative sourcing into their core strategies, often launching a brand-owned resale platform. For instance, companies that have integrated repair services have seen a 15% increase in customer lifetime value.
- The market is also seeing a blend of traditional haute couture with modern luxury sportswear and technical fashion element details. Offerings like bespoke tailoring and made-to-measure services are being enhanced through a sophisticated omnichannel shopping experience.
- Success now depends on proving cultural legitimacy through both product excellence—from premium fiber in luxury outerwear to avant-garde design—and a compelling digital narrative that resonates with a discerning global audience.
What are the Key Data Covered in this Luxury Apparel Market Research and Growth Report?
-
What is the expected growth of the Luxury Apparel Market between 2026 and 2030?
-
USD 33.20 billion, at a CAGR of 4.4%
-
-
What segmentation does the market report cover?
-
The report is segmented by Distribution Channel (Offline, and Online), End-user (Men, and Women), Product Type (Clothing, Footwear, and Others) and Geography (APAC, North America, Europe, Middle East and Africa, South America)
-
-
Which regions are analyzed in the report?
-
APAC, North America, Europe, Middle East and Africa and South America
-
-
What are the key growth drivers and market challenges?
-
Strategic mainstreaming of circular ecosystems and regenerative luxury models, Structural consumer polarisation and erosive impact of luxury super-cycle normalisation
-
-
Who are the major players in the Luxury Apparel Market?
-
Brunello Cucinelli SpA, Burberry Group plc, Chanel Ltd., Ermenegildo Zegna NV, Giorgio Armani SpA, Guccio Gucci SpA, Hermes International SA, Hugo Boss AG, Kering SA, LVMH Moet Hennessy, Michael Kors Inc., Moncler SPA, Prada SpA, PVH Corp., Ralph Lauren Corp., Salvatore Ferragamo SpA and Tapestry Inc.
-
Market Research Insights
- The market is defined by a complex interplay of dynamics, including the normalization of the post-pandemic super-cycle and increasing structural consumer polarization. High-net-worth individual spending remains robust, yet growing consumer price sensitivity among aspirational buyers is a significant factor.
- Brands are responding with a dual strategy: reinforcing exclusivity to maintain luxury pricing power while adopting a sustainable luxury model to appeal to eco-literate shopper values. Effective inventory management optimization has become critical, with leading firms using AI to reduce excess stock by over 25%.
- A sophisticated digital engagement strategy is also non-negotiable, as platforms that personalize the customer journey see a 15% higher conversion rate compared to static websites.
We can help! Our analysts can customize this luxury apparel market research report to meet your requirements.
 RIA -
RIA - 
