Sports Apparel Market Size 2025-2029
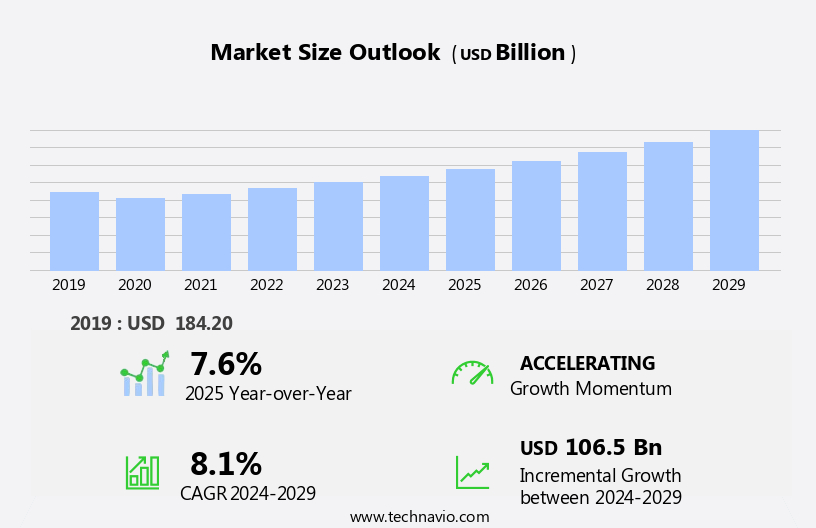
The sports apparel market size is forecast to increase by USD 106.5 billion, at a CAGR of 8.1% between 2024 and 2029.
- The market is driven by the increasing availability of innovative and high-performance apparel, leading to product premiumization. Consumers are increasingly willing to invest in sports apparel that offers superior comfort, functionality, and style. Technological advancements in sports apparel, such as hiking gears and moisture-wicking fabric, temperature regulation, and integrated technology, further fuel this trend. However, the market faces challenges from the volatility in prices of raw materials, particularly cotton and synthetic fibers. This price instability can impact the profitability of sports apparel manufacturers and retailers, necessitating effective supply chain management and pricing strategies. To capitalize on market opportunities, companies must focus on product innovation, sustainable sourcing, and efficient supply chain management.
- Navigating the challenges of raw material price volatility requires a proactive approach, including hedging strategies, alternative sourcing, and supply chain optimization. Overall, the market presents significant growth potential, with a focus on product innovation and effective supply chain management being key to success.
What will be the Size of the Sports Apparel Market during the forecast period?
Explore in-depth regional segment analysis with market size data - historical 2019-2023 and forecasts 2025-2029 - in the full report.
Request Free Sample
The market continues to evolve, driven by advancements in fabric technology, customer preferences, and industry trends. Synthetic fibers, such as quick-drying and moisture-wicking materials, dominate the landscape, catering to various sectors including soccer, running, and golf. Price point and customer segmentation play crucial roles in product development, with offerings ranging from budget-friendly options to high-performance, technologically-advanced garments. Body mapping and breathable fabrics are key features in performance apparel, ensuring optimal comfort and functionality. Ski apparel and snowboarding apparel incorporate quick-drying fabrics to tackle the challenges of winter sports. Wearable Technology and stretch fabrics are revolutionizing training shoes and training apparel, enabling better tracking of performance metrics and enhancing workouts.
How is this Sports Apparel Industry segmented?
The sports apparel industry research report provides comprehensive data (region-wise segment analysis), with forecasts and estimates in "USD billion" for the period 2025-2029, as well as historical data from 2019-2023 for the following segments.
- End-user
- Men
- Women
- Children
- Distribution Channel
- Offline
- Online
- Apparel Type
- Jerseys
- Shorts
- Athletic Shoes
- Compression Wear
- Sports Category
- Soccer
- Basketball
- Running
- Gym and Fitness
- Geography
- North America
- US
- Europe
- France
- Germany
- Italy
- UK
- APAC
- China
- India
- Japan
- South Korea
- South America
- Brazil
- Rest of World (ROW)
- North America
By End-user Insights
The men segment is estimated to witness significant growth during the forecast period.
The market encompasses various categories, including soccer apparel, smart clothing, athletic apparel, yoga apparel, Running Apparel, performance apparel, athletic socks, ski apparel, golf apparel, tennis apparel, team uniforms, and more. These apparel types incorporate advanced technologies such as moisture-wicking fabrics, quick-drying fabrics, body mapping, and wearable technology. Consumers increasingly prioritize ethical sourcing and demand transparency in supply chains. Customer segmentation plays a crucial role in market dynamics, with the men's segment experiencing significant growth due to increased sports participation and marketing initiatives. Men's sports apparel offers various options like athletic shorts, compression tights, and fashionable designs, catering to diverse preferences.
Brands focus on improving distribution channels and marketing efforts to capture latent demand. Product development continues to evolve, with an emphasis on natural fibers, compression garments, and performance metrics. Fabric testing, quality control, and product lifecycle management are essential aspects of the industry. Sublimation printing, screen printing, and other techniques add unique designs to sports apparel. Sports bras, cycling apparel, and other specialized apparel cater to specific customer needs. Merino wool, running shoes, Basketball Apparel, and other essentials complete the diverse sports apparel landscape. The market is expected to continue evolving, with innovation and customer satisfaction driving growth.
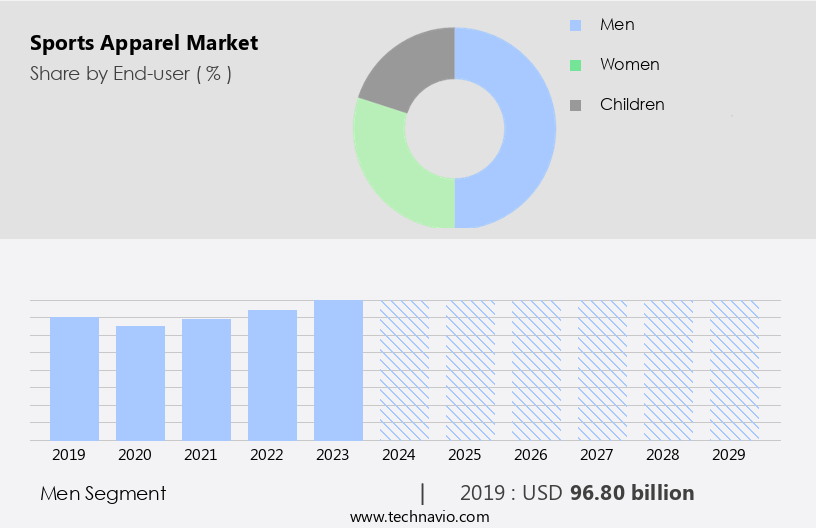
The Men segment was valued at USD 96.80 billion in 2019 and showed a gradual increase during the forecast period.
Regional Analysis
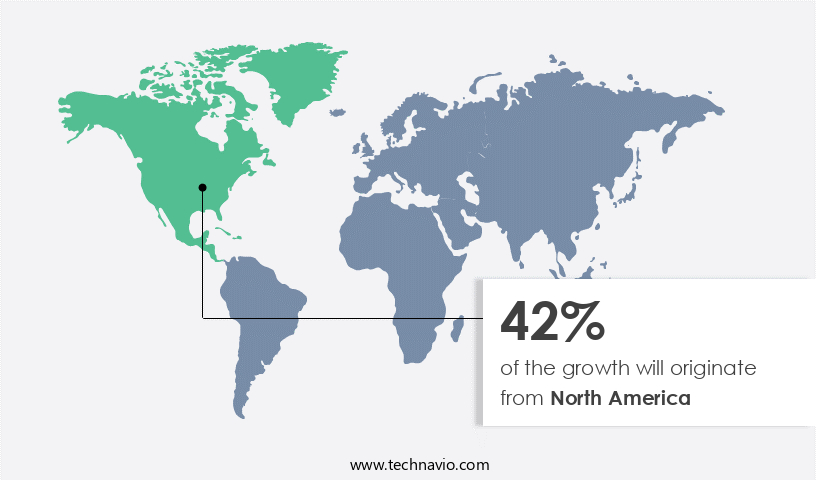
North America is estimated to contribute 42% to the growth of the global market during the forecast period.Technavio's analysts have elaborately explained the regional trends and drivers that shape the market during the forecast period.
The North American the market experiences growth due to the rising trend of active lifestyles and increased participation in various sports activities. Soccer, basketball, and rugby are among the popular sports in the region. Athletes and fitness enthusiasts seek performance-enhancing apparel, leading to the demand for smart clothing, synthetic fibers, and moisture-wicking fabrics. Ethical sourcing and customer reviews play a significant role in consumer decision-making. Performance metrics, such as breathability and quick-drying capabilities, are essential features in running, golf, and ski apparel.
Customer segmentation targets specific demographics, including millennials and athletes. Product development focuses on wearable technology, stretch fabrics, and sublimation printing. Training shoes, training apparel, and team uniforms are also in demand. Natural fibers like merino wool and compression garments offer comfort and durability. Competitors continually innovate to cater to diverse sports and fitness needs, ensuring product lifecycle management and quality control.
Market Dynamics
Our researchers analyzed the data with 2024 as the base year, along with the key drivers, trends, and challenges. A holistic analysis of drivers will help companies refine their marketing strategies to gain a competitive advantage.
In the dynamic and ever-evolving world of sports, the demand for high-performance apparel continues to soar. From functional fitness wear to stylish athletic attire, the market caters to diverse needs. Innovative materials like moisture-wicking polyester and quick-drying nylon dominate the scene. Comfort and flexibility are paramount, with elastane and spandex blends ensuring a perfect fit. Technical features such as UV protection, breathability, and insulation add value. Brands invest in research and development, integrating advanced technologies like temperature regulation and odor resistance. Sustainability is a growing concern, with eco-friendly fabrics and ethical manufacturing processes gaining popularity. The market is a vibrant fusion of fashion, functionality, and technology, constantly pushing boundaries to meet the demands of modern athletes.
What are the key market drivers leading to the rise in the adoption of Sports Apparel Industry?
- The availability of innovative sports apparel significantly contributes to the market trend toward product premiumization.
- The market is driven by innovation, as advanced fabrications, design, and technology enhance the performance of athletes in various sports. Premium-priced products are emerging due to consumer demand for high-quality, innovative items. Market competitors, including Nike, Adidas, New Balance, PUMA, Skechers, Under Armour, and ASICS, are recognized for their innovative offerings. Technological advancements, such as moisture-wicking and breathable fabrics, have led to the development of sport-specific apparel for basketball, football, rugby, trail running, golf, and more. Consumers value performance metrics, such as durability, flexibility, and comfort, when selecting sports apparel.
- Ethical sourcing and sustainable practices are also becoming increasingly important in the market. Smart clothing, including performance-enhancing athletic socks and yoga apparel, is gaining popularity due to its ability to monitor and improve athletic performance. Customer reviews play a significant role in influencing purchasing decisions, highlighting the importance of delivering high-quality products and exceptional customer service.
What are the market trends shaping the Sports Apparel Industry?
- The trend in the market is being shaped by technological advancements. Technological innovations continue to revolutionize the design and functionality of athletic clothing.
- The market is driven by consumer demand for advanced technology and innovative features in clothing designed for physical activity. Manufacturers prioritize product development to enhance user experience, focusing on wicking, comfort, and sustainability. Quality is a significant consideration for consumers, who seek cost-effective, high-performance apparel for activities like running and golfing. Ski apparel-equipments and training apparel, including quick-drying and breathable fabrics, are popular choices. Fabric testing is essential to ensure the durability and effectiveness of these materials. In the competitive landscape, companies emphasize product lifecycle management to maintain a strong market presence.
- Raw material technology plays a crucial role in improving the functionality and appeal of sports apparel. Consumers expect their athletic clothing to provide superior comfort, moisture management, and flexibility, making it an essential investment for their fitness journey.
What challenges does the Sports Apparel Industry face during its growth?
- The volatility in the prices of raw materials used in the production of sports apparel poses a significant challenge and significantly impacts the growth of the sports apparel industry.
- The market is experiencing significant dynamics due to various factors. The integration of wearable technology in sports apparel is a notable trend, with companies investing in tech-infused garments to cater to consumers' evolving needs. Simultaneously, the preference for stretch fabrics and moisture-wicking materials continues to grow, driving demand for gym apparel, tennis apparel, and Outdoor Apparel. Manufacturers, including Adidas, Nike, and PUMA, face profit margin fluctuations due to the volatile prices of raw materials such as polyester, nylon, and spandex. Additionally, the increasing competition among companies has led to an influx of local players, triggering price wars and putting pressure on profit margins.
- Sublimation printing and team uniforms remain popular in the market, with baseball apparel and snowboarding apparel being key categories. Hiking apparel also experiences steady growth due to the increasing popularity of outdoor activities. Overall, the market is expected to continue its growth trajectory, with manufacturers focusing on innovation, quality, and affordability to stay competitive.
Exclusive Customer Landscape
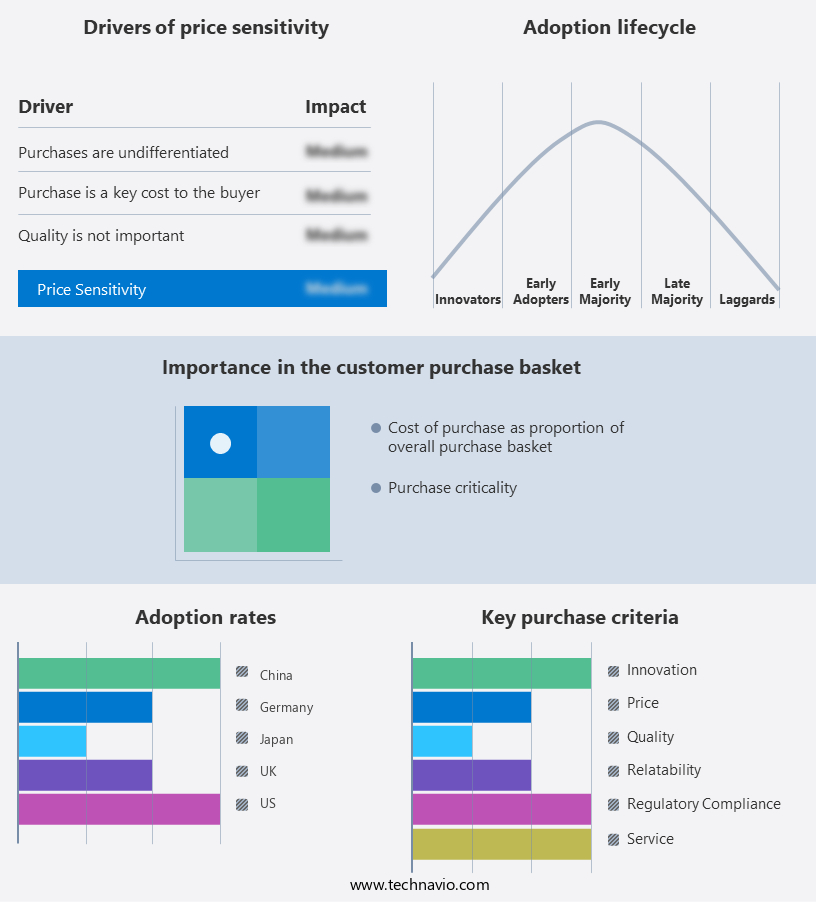
The sports apparel market forecasting report includes the adoption lifecycle of the market, covering from the innovator's stage to the laggard's stage. It focuses on adoption rates in different regions based on penetration. Furthermore, the sports apparel market report also includes key purchase criteria and drivers of price sensitivity to help companies evaluate and develop their market growth analysis strategies.
Customer Landscape
Key Companies & Market Insights
Companies are implementing various strategies, such as strategic alliances, sports apparel market forecast, partnerships, mergers and acquisitions, geographical expansion, and product/service launches, to enhance their presence in the industry.
Adidas AG - This company specializes in innovative sports apparel, featuring the Lift Your Mind Tee, Windbreaker, and City Escape Graphic Tee.
The industry research and growth report includes detailed analyses of the competitive landscape of the market and information about key companies, including:
- Adidas AG
- ASICS Corp.
- Columbia Sportswear Co.
- Decathlon SA
- Fila Holdings Corp.
- Group Rossignol USA Inc.
- Hanesbrands Inc.
- K Swiss Inc.
- Levi Strauss and Co.
- Li Ning Co. Ltd.
- Lululemon Athletica Inc.
- Mizuno Corp.
- New Balance Athletics Inc.
- Nike Inc.
- PUMA SE
- Ralph Lauren Corp.
- Russell Brands LLC
- Umbro
- Under Armour Inc.
- VF Corp.
- Yonex Co. Ltd.
Qualitative and quantitative analysis of companies has been conducted to help clients understand the wider business environment as well as the strengths and weaknesses of key industry players. Data is qualitatively analyzed to categorize companies as pure play, category-focused, industry-focused, and diversified; it is quantitatively analyzed to categorize companies as dominant, leading, strong, tentative, and weak.
Recent Development and News in Sports Apparel Market
- In January 2024, Adidas and Allbirds, two major players in the market, announced a partnership to co-create sustainable footwear products, combining Adidas' manufacturing expertise with Allbirds' eco-friendly materials (Adidas press release). This collaboration marks a significant stride towards sustainable production in the sports apparel industry.
- In March 2024, Under Armour completed the acquisition of MyFitnessPal, a leading health and fitness tracking application, for approximately USD345 million (Under Armour SEC filing). This acquisition aimed to strengthen Under Armour's digital presence and expand its reach in the health and wellness market.
- In May 2024, Lululemon Athletica announced the launch of its new activewear line, 'Metallica,' in collaboration with the iconic rock band (Lululemon press release). This strategic partnership marked a foray into the male demographic for Lululemon, broadening its customer base and market share.
- In April 2025, Nike secured a major regulatory approval to expand its manufacturing facility in Vietnam, increasing its production capacity by 50% (Nike press release). This expansion will help Nike meet the growing demand for sports apparel and maintain its market dominance.
Research Analyst Overview
- The market is characterized by its continuous evolution, driven by advancements in material science and technology. Bamboo fabric and technical fabrics, for instance, offer superior breathability and moisture-wicking properties, appealing to performance-conscious consumers. Brands are leveraging value proposition and brand positioning to differentiate their offerings, with adaptive clothing and e-sports apparel catering to specific niches. social media marketing and influencer partnerships are crucial for customer engagement and brand loyalty. Transparency in labor practices and supply chain is increasingly important for customer retention. Retail channels, from brick-and-mortar stores to online marketplaces, are adapting to meet evolving consumer preferences.
- Fabric testing and quality control are essential aspects of product lifecycle management, ensuring the delivery of reliable, high-quality products. Ethical sourcing and sustainable practices are gaining importance, with natural fibers like merino wool and compression garments emerging as popular alternatives. Sublimation printing and screen printing add a personal touch to team uniforms and gym apparel, catering to the unique needs of various sports and fitness communities. The ongoing integration of technology, customer feedback, and sustainability continues to shape the dynamic and evolving the market.
- Product safety, sustainability, and customization are key trends. Brands are investing in recycled polyester, organic cotton, and sustainable materials, while incorporating biometric sensors and design software for personalized fit and fitness tracking. Pricing strategy, market research, and sales forecasting are essential components of a successful business model. Inventory management, quality assurance, and returns and exchanges are crucial for operational efficiency. Textile technology innovations, such as 3D printing apparel and virtual try-on, are shaping the future of the industry. Fair trade and sustainability initiatives, along with pricing transparency, are becoming increasingly important for brand reputation.
Dive into Technavio's robust research methodology, blending expert interviews, extensive data synthesis, and validated models for unparalleled Sports Apparel Market insights. See full methodology.
|
Market Scope |
|
|
Report Coverage |
Details |
|
Page number |
206 |
|
Base year |
2024 |
|
Historic period |
2019-2023 |
|
Forecast period |
2025-2029 |
|
Growth momentum & CAGR |
Accelerate at a CAGR of 8.1% |
|
Market growth 2025-2029 |
USD 106.5 billion |
|
Market structure |
Fragmented |
|
YoY growth 2024-2025(%) |
7.6 |
|
Key countries |
US, China, Germany, UK, India, Japan, South Korea, France, Brazil, and Italy |
|
Competitive landscape |
Leading Companies, Market Positioning of Companies, Competitive Strategies, and Industry Risks |
What are the Key Data Covered in this Sports Apparel Market Research and Growth Report?
- CAGR of the Sports Apparel industry during the forecast period
- Detailed information on factors that will drive the growth and forecasting between 2025 and 2029
- Precise estimation of the size of the market and its contribution of the industry in focus to the parent market
- Accurate predictions about upcoming growth and trends and changes in consumer behaviour
- Growth of the market across North America, APAC, Europe, South America, and Middle East and Africa
- Thorough analysis of the market's competitive landscape and detailed information about companies
- Comprehensive analysis of factors that will challenge the sports apparel market growth of industry companies
We can help! Our analysts can customize this sports apparel market research report to meet your requirements.
 RIA -
RIA - 
