
Machine Learning In Pharmaceutical Industry Market Size 2025-2029
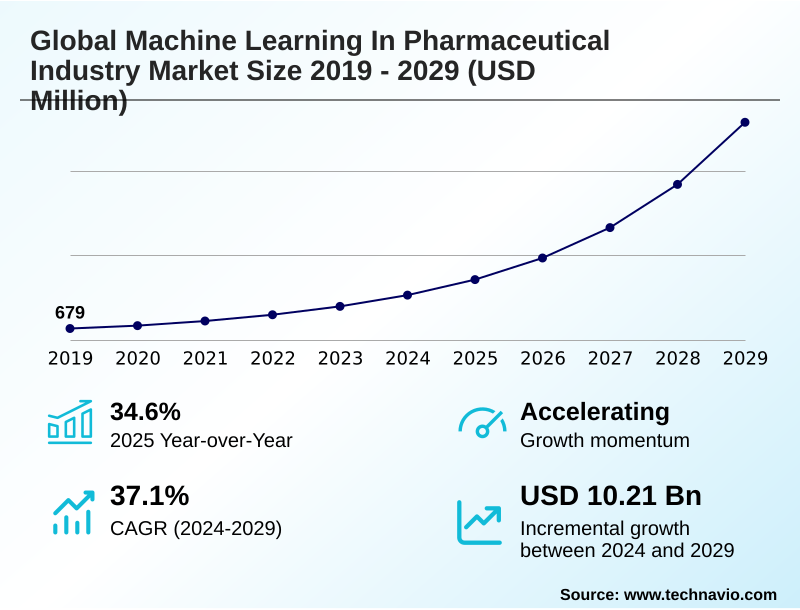
The machine learning in pharmaceutical industry market size is valued to increase by USD 10.21 billion, at a CAGR of 37.1% from 2024 to 2029. Increasing data volume and complexity will drive the machine learning in pharmaceutical industry market.
Major Market Trends & Insights
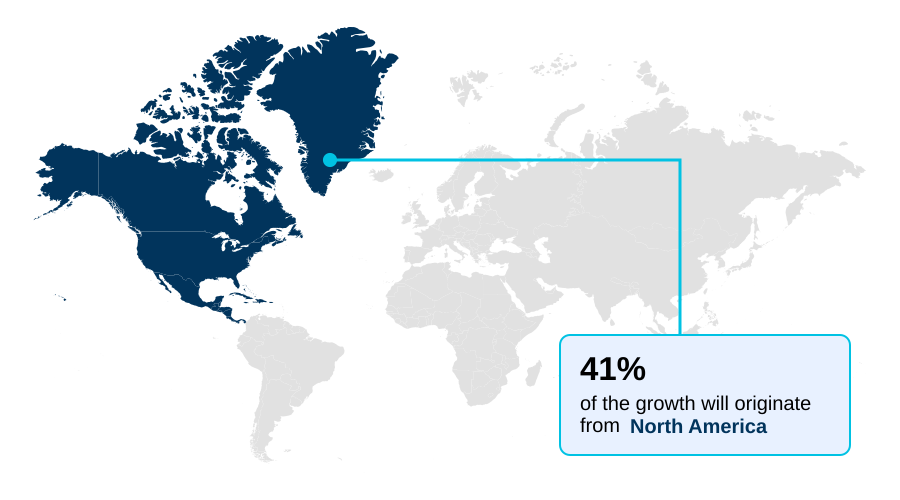
- North America dominated the market and accounted for a 41.3% growth during the forecast period.
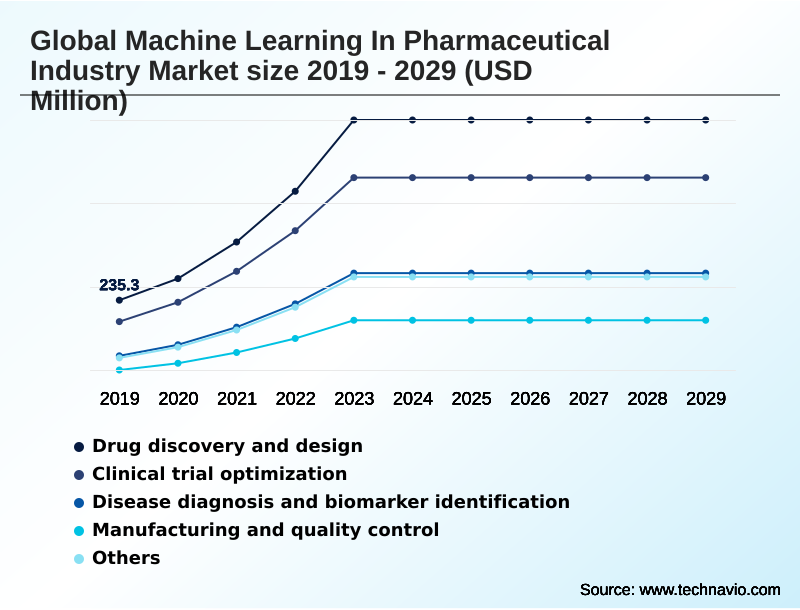
- By Application - Drug discovery and design segment was valued at USD 673.7 million in 2023
- By Technology - Supervised learning segment accounted for the largest market revenue share in 2023
Market Size & Forecast
- Market Opportunities: USD 12.19 billion
- Market Future Opportunities: USD 10.21 billion
- CAGR from 2024 to 2029 : 37.1%
Market Summary
- The machine learning in pharmaceutical industry market is advancing rapidly, driven by the imperative to enhance R&D efficiency and accelerate therapeutic innovation. The integration of supervised learning and deep learning is transforming core processes, from initial drug discovery and design to late-stage clinical trial optimization.
- A key driver is the explosion of multi-omics data, which requires sophisticated bioinformatics and computational biology techniques to unlock actionable insights. For instance, a firm can leverage machine learning for protein folding to analyze real-world evidence, identifying novel patterns in disease progression that inform the development of precision medicine.
- This AI-powered approach facilitates more effective patient stratification and the identification of digital biomarkers. However, progress is tempered by challenges such as ensuring data interoperability and addressing the shortage of talent with expertise in both pharmaceutical sciences and AI. The adoption of federated learning is emerging as a solution to privacy concerns, enabling collaborative research without compromising sensitive information.
- As generative adversarial networks and variational autoencoders mature, their role in de novo drug design will continue to expand, pushing the boundaries of molecular innovation.
What will be the Size of the Machine Learning In Pharmaceutical Industry Market during the forecast period?
Get Key Insights on Market Forecast (PDF) Get Free Sample
How is the Machine Learning In Pharmaceutical Industry Market Segmented?
The machine learning in pharmaceutical industry industry research report provides comprehensive data (region-wise segment analysis), with forecasts and estimates in "USD million" for the period 2025-2029, as well as historical data from 2019-2023 for the following segments.
- Application
- Drug discovery and design
- Clinical trial optimization
- Disease diagnosis and biomarker identification
- Manufacturing and quality control
- Others
- Technology
- Supervised learning
- Deep learning
- Unsupervised learning
- Reinforcement learning
- Others
- Deployment
- Cloud-based
- Hybrid
- On premises
- Geography
- North America
- US
- Canada
- Mexico
- APAC
- China
- India
- Japan
- Europe
- Germany
- UK
- France
- South America
- Brazil
- Argentina
- Colombia
- Middle East and Africa
- Saudi Arabia
- UAE
- South Africa
- Rest of World (ROW)
- North America
By Application Insights
The drug discovery and design segment is estimated to witness significant growth during the forecast period.
The drug discovery and design segment is a cornerstone of the market, where AI in drug development is redefining molecular innovation. Machine learning facilitates accelerated target identification and validation, moving beyond traditional high-throughput screening.
Techniques such as in silico simulation and predictive toxicology are instrumental in early-stage research. The use of AI in computational chemistry for admet prediction streamlines preclinical workflows, with some platforms reducing preclinical screening timelines by over 40%.
Generative AI for molecule synthesis and advanced algorithms for lead optimization are enabling de novo drug design, expanding the chemical space for novel therapeutics.
This AI-accelerated drug discovery process, supported by ML models for admet prediction and robust methods for AI for target validation, is critical for bringing new treatments to market more efficiently.
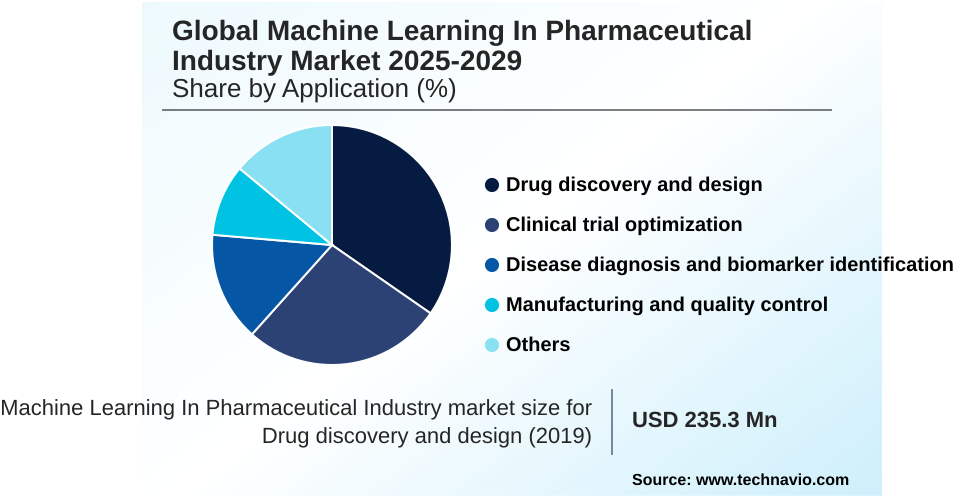
The Drug discovery and design segment was valued at USD 673.7 million in 2023 and showed a gradual increase during the forecast period.
Regional Analysis
North America is estimated to contribute 41.3% to the growth of the global market during the forecast period.Technavio’s analysts have elaborately explained the regional trends and drivers that shape the market during the forecast period.
See How Machine Learning In Pharmaceutical Industry Market Demand is Rising in North America Get Free Sample
The geographic landscape of the machine learning in pharmaceutical industry market is led by North America, which accounts for over 41% of the incremental growth, with the United States at the forefront of innovation.
The region's dominance is supported by a strong R&D infrastructure and significant venture capital investment in AI for precision oncology and immuno-oncology.
Meanwhile, APAC is the fastest-growing region, with a projected CAGR of 37.9%, driven by countries like China, India, and Japan. These markets are rapidly adopting unsupervised learning and reinforcement learning techniques for molecular modeling and genomic data analysis.
The application of reinforcement learning for dosing and AI for target validation are key focus areas.
Europe remains a significant market, with a focus on ethical AI and federated learning in healthcare to navigate stringent data privacy regulations while advancing research.
Market Dynamics
Our researchers analyzed the data with 2024 as the base year, along with the key drivers, trends, and challenges. A holistic analysis of drivers will help companies refine their marketing strategies to gain a competitive advantage.
- Exploring the future of machine learning in the pharmaceutical industry reveals a landscape rich with specialized applications. The focus is on applying machine learning to optimize clinical trials and using deep learning for novel drug candidate design, which are becoming standard practice.
- The role of federated learning in multi-institutional research is crucial for overcoming data-sharing barriers, directly supporting the impact of AI on personalized medicine development. To ensure safety, supervised learning models for predictive toxicology screening are essential. In discovery, unsupervised learning techniques for disease subtyping and reinforcement learning for adaptive treatment regimens are creating more nuanced therapeutic strategies.
- Furthermore, generative AI applications in small molecule synthesis are accelerating compound creation. The synergy achieved through machine learning integration with digital biomarkers allows for continuous patient monitoring, while AI-driven analysis of real-world evidence for drug safety improves post-market surveillance. Addressing the challenges of implementing AI in pharmaceutical R&D is a key industry priority.
- Firms are focused on improving manufacturing quality control with machine learning and leveraging machine learning for biomarker identification in oncology. The question of how AI accelerates lead optimization in drug discovery is being answered as platforms demonstrate they are more than twice as effective as legacy methods. All these advancements are guided by ethical considerations for AI in patient stratification.
- The use of AI platforms for genomic and proteomic data analysis, the benefits of AI-powered pharmacovigilance systems, and the refinement of machine learning models for predicting drug-target interactions all signify how machine learning reduces drug development costs.
What are the key market drivers leading to the rise in the adoption of Machine Learning In Pharmaceutical Industry Industry?
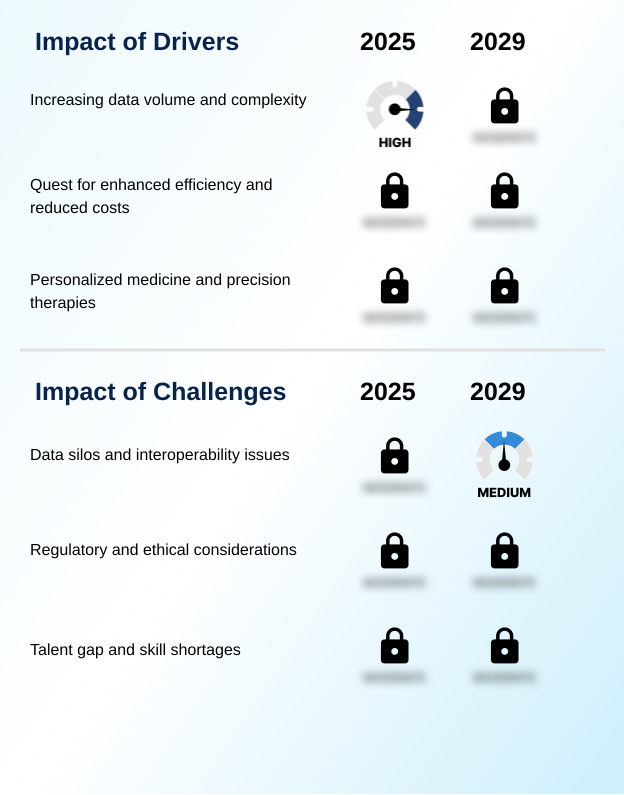
- The increasing volume and complexity of data generated across the pharmaceutical value chain is a primary driver for the market.
- The market's expansion is fueled by several key drivers, most notably the relentless pursuit of greater R&D efficiency. Machine learning platforms are reducing research expenditures by an average of 20% by automating and optimizing early-stage discovery processes.
- The growing emphasis on ML for personalized medicine is another significant driver, as algorithms analyze complex genomic data to tailor treatments for specific patient cohorts.
- This approach not only improves efficacy but also accelerates clinical development timelines by up to 25%.
- The increasing volume and complexity of healthcare data necessitates advanced analytical tools, making machine learning in bioinformatics and real-world data analytics with AI indispensable for extracting meaningful insights and advancing AI for precision oncology.
What are the market trends shaping the Machine Learning In Pharmaceutical Industry Industry?
- The rise of generative AI for de novo drug design is a prominent trend, revolutionizing the creation of novel molecular structures with desired therapeutic properties.
- Key trends are reshaping the competitive landscape, led by the rise of generative AI for molecule synthesis. This approach can accelerate hit identification by up to 50% compared to traditional screening methods. The increasing adoption of federated learning is another pivotal trend, enabling collaborative research across institutions without compromising data privacy.
- Models trained using this method have shown a 15% improvement in diagnostic accuracy for certain rare diseases. Furthermore, the integration of deep learning for medical imaging with digital biomarkers and wearable technology is transforming patient monitoring.
- This allows for the collection of continuous, real-world data, improving the precision of clinical trial endpoints and supporting the development of AI for digital therapeutics. These trends in AI-accelerated drug discovery are pivotal for innovation.
What challenges does the Machine Learning In Pharmaceutical Industry Industry face during its growth?
- Pervasive data silos and a lack of interoperability across disparate systems and organizations present a significant challenge to market growth.
- Despite its potential, the market faces significant challenges that can impede progress. The prevalence of data silos and a lack of interoperability remain primary hurdles, with data fragmentation issues known to increase project timelines by up to 40%. Navigating complex regulatory and ethical considerations, including the need for explainable AI in pharma, creates uncertainty and can slow innovation.
- Another critical restraint is the talent gap; the shortage of professionals with interdisciplinary skills in both data science and pharmacology leads to an 18% higher cost for specialized roles. Overcoming these obstacles, including addressing AI ethics in drug development and the high cost of ML models for ADMET prediction, is essential for sustained growth.
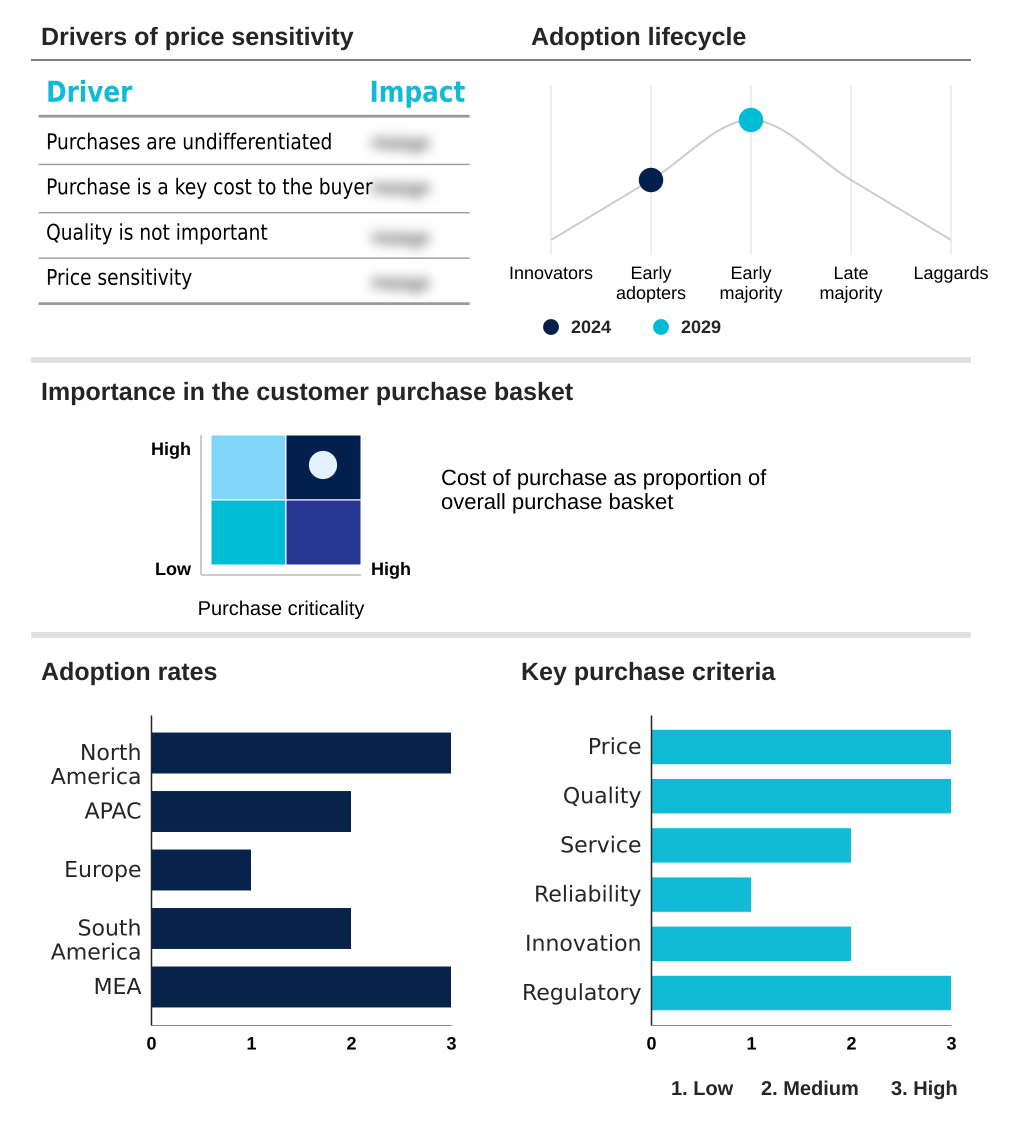
Exclusive Technavio Analysis on Customer Landscape
The machine learning in pharmaceutical industry market forecasting report includes the adoption lifecycle of the market, covering from the innovator’s stage to the laggard’s stage. It focuses on adoption rates in different regions based on penetration. Furthermore, the machine learning in pharmaceutical industry market report also includes key purchase criteria and drivers of price sensitivity to help companies evaluate and develop their market growth analysis strategies.
Customer Landscape of Machine Learning In Pharmaceutical Industry Industry
Competitive Landscape
Companies are implementing various strategies, such as strategic alliances, machine learning in pharmaceutical industry market forecast, partnerships, mergers and acquisitions, geographical expansion, and product/service launches, to enhance their presence in the industry.
AbbVie Inc. - Key offerings focus on AI-driven platforms for drug discovery, clinical trial optimization, and predictive analytics, accelerating the development of novel therapies.
The industry research and growth report includes detailed analyses of the competitive landscape of the market and information about key companies, including:
- AbbVie Inc.
- Amgen Inc.
- AstraZeneca Plc
- Atomwise Inc.
- Bayer AG
- Bristol Myers Squibb Co.
- Eli Lilly and Co.
- F. Hoffmann La Roche Ltd.
- GlaxoSmithKline Plc
- ICON plc
- Insilico Medicine
- IQVIA Holdings Inc.
- Johnson and Johnson Services
- Merck and Co. Inc.
- Novartis AG
- Pfizer Inc.
- Recursion Pharmaceuticals Inc.
- Sanofi SA
- Takeda Pharmaceutical Ltd.
Qualitative and quantitative analysis of companies has been conducted to help clients understand the wider business environment as well as the strengths and weaknesses of key industry players. Data is qualitatively analyzed to categorize companies as pure play, category-focused, industry-focused, and diversified; it is quantitatively analyzed to categorize companies as dominant, leading, strong, tentative, and weak.
Recent Development and News in Machine learning in pharmaceutical industry market
- In September 2024, a major US-based pharmaceutical company announced a strategic partnership with a leading AI firm to establish a dedicated AI-driven drug discovery center aimed at accelerating the identification of drug candidates across multiple therapeutic areas.
- In November 2024, a leading pharmaceutical company launched a new AI-driven platform designed to accelerate the development of precision oncology therapies by leveraging machine learning to analyze patient tumor profiles and genomic data.
- In January 2025, a consortium of major academic medical centers and pharmaceutical companies initiated a federated learning project to develop a collaborative AI model for predicting patient response to immunotherapy without sharing raw patient data.
- In March 2025, the European Medicines Agency (EMA) published a new draft guidance document that outlines principles for the use of artificial intelligence in medicinal products, emphasizing transparency, data quality, and human oversight.
Dive into Technavio’s robust research methodology, blending expert interviews, extensive data synthesis, and validated models for unparalleled Machine Learning In Pharmaceutical Industry Market insights. See full methodology.
| Market Scope | |
|---|---|
| Page number | 321 |
| Base year | 2024 |
| Historic period | 2019-2023 |
| Forecast period | 2025-2029 |
| Growth momentum & CAGR | Accelerate at a CAGR of 37.1% |
| Market growth 2025-2029 | USD 10212.8 million |
| Market structure | Fragmented |
| YoY growth 2024-2025(%) | 34.6% |
| Key countries | US, Canada, Mexico, China, India, Japan, South Korea, Australia, Indonesia, Germany, UK, France, Italy, The Netherlands, Spain, Brazil, Argentina, Colombia, Saudi Arabia, UAE, South Africa, Israel and Turkey |
| Competitive landscape | Leading Companies, Market Positioning of Companies, Competitive Strategies, and Industry Risks |
Research Analyst Overview
- The machine learning in pharmaceutical industry market is defined by its continuous evolution, where advanced algorithms are fundamentally reshaping R&D paradigms. The integration of supervised learning, deep learning, and unsupervised learning facilitates breakthroughs in drug discovery and design, from initial target identification to complex in silico simulation.
- Key technologies like generative adversarial networks and variational autoencoders are enabling de novo drug design, while reinforcement learning models optimize adaptive clinical trials. In diagnostics, machine learning drives biomarker identification and enhances disease diagnosis.
- A critical boardroom-level consideration is the strategic adoption of federated learning, which allows for multi-institutional collaboration on sensitive multi-omics data while adhering to privacy regulations, thereby expanding research capabilities. The application of these technologies—including predictive toxicology, patient stratification, and pharmacovigilance—delivers tangible efficiencies. For example, some integrated platforms have achieved a 30% reduction in data processing time for preclinical development.
- This powerful combination of computational biology, bioinformatics, and precision medicine, leveraging knowledge graphs and graph neural networks for insights from real-world evidence, is accelerating everything from small molecule design and protein engineering to lead optimization and high-throughput screening.
What are the Key Data Covered in this Machine Learning In Pharmaceutical Industry Market Research and Growth Report?
-
What is the expected growth of the Machine Learning In Pharmaceutical Industry Market between 2025 and 2029?
-
USD 10.21 billion, at a CAGR of 37.1%
-
-
What segmentation does the market report cover?
-
The report is segmented by Application (Drug discovery and design, Clinical trial optimization, Disease diagnosis and biomarker identification, Manufacturing and quality control, and Others), Technology (Supervised learning, Deep learning, Unsupervised learning, Reinforcement learning, and Others), Deployment (Cloud-based, Hybrid, and On premises) and Geography (North America, APAC, Europe, South America, Middle East and Africa)
-
-
Which regions are analyzed in the report?
-
North America, APAC, Europe, South America and Middle East and Africa
-
-
What are the key growth drivers and market challenges?
-
Increasing data volume and complexity, Data silos and interoperability issues
-
-
Who are the major players in the Machine Learning In Pharmaceutical Industry Market?
-
AbbVie Inc., Amgen Inc., AstraZeneca Plc, Atomwise Inc., Bayer AG, Bristol Myers Squibb Co., Eli Lilly and Co., F. Hoffmann La Roche Ltd., GlaxoSmithKline Plc, ICON plc, Insilico Medicine, IQVIA Holdings Inc., Johnson and Johnson Services, Merck and Co. Inc., Novartis AG, Pfizer Inc., Recursion Pharmaceuticals Inc., Sanofi SA and Takeda Pharmaceutical Ltd.
-
Market Research Insights
- The market's momentum is sustained by the tangible business outcomes of AI in drug development. For instance, predictive analytics for drug safety has enhanced pharmacovigilance, while AI for clinical trial recruitment has improved enrollment efficiency. Enterprises adopting AI-powered R&D platforms report significant gains, with some achieving a 30% reduction in preclinical screening timelines.
- The application of deep learning in pharmacology and ML for personalized medicine is not just theoretical; it delivers direct value. Moreover, AI in pharmaceutical manufacturing is streamlining operations, with implementations showing a capability to reduce packaging line defects by over 50%.
- This focus on measurable improvement solidifies the strategic importance of machine learning in genomics and AI-driven biomarker discovery, ensuring continued investment in these transformative technologies.
We can help! Our analysts can customize this machine learning in pharmaceutical industry market research report to meet your requirements.
 RIA -
RIA - 
