
AI In Predictive Toxicology Market Size 2025-2029
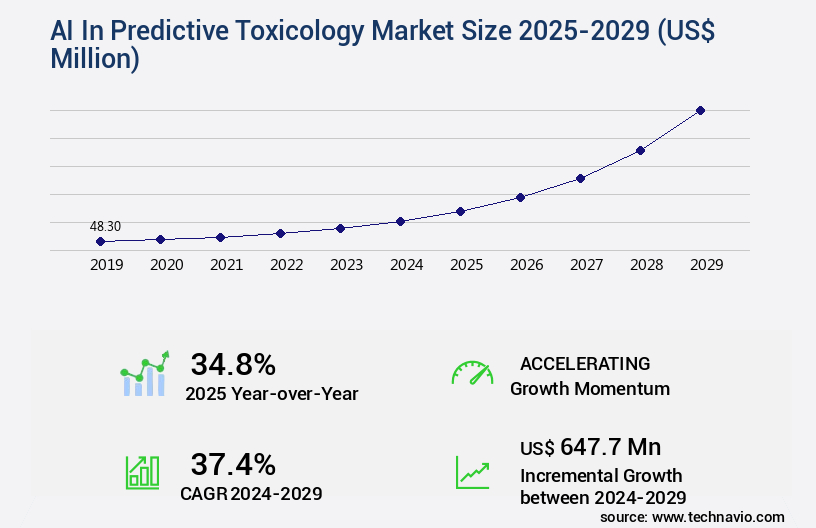
The AI in predictive toxicology market size is valued to increase by USD 647.7 million, at a CAGR of 37.4% from 2024 to 2029. Economic and operational imperative to mitigate late stage attrition and expedite drug development cycles will drive the ai in predictive toxicology market.
Major Market Trends & Insights
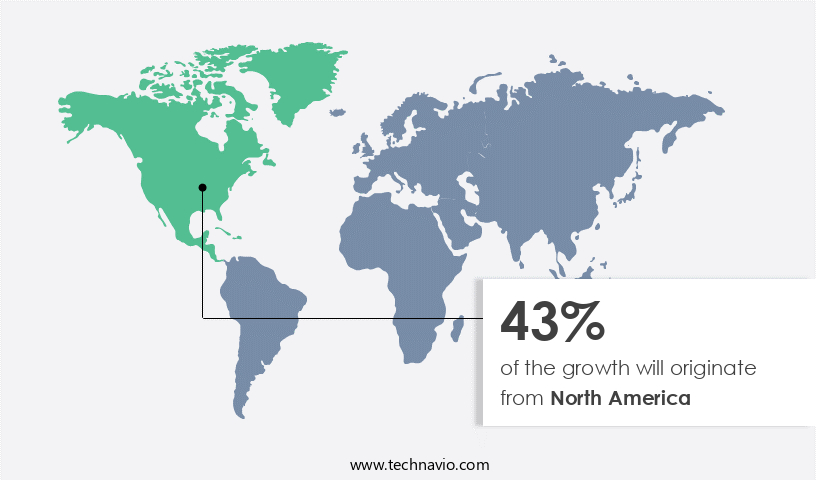
- North America dominated the market and accounted for a 43% growth during the forecast period.
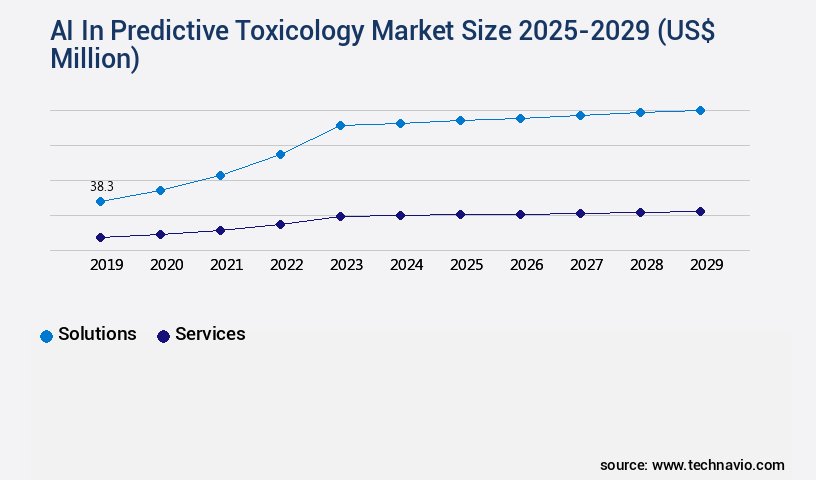
- By Component - Solutions segment was valued at USD 38.30 million in 2023
- By Technology - Machine learning segment accounted for the largest market revenue share in 2023
Market Size & Forecast
- Market Opportunities: USD 1.00 million
- Market Future Opportunities: USD 647.70 million
- CAGR from 2024 to 2029 : 37.4%
Market Summary
- The market witnesses significant growth as pharmaceutical and biotech companies increasingly adopt advanced technologies to streamline drug development processes and mitigate late-stage attrition. The proliferation of generative AI and sophisticated machine learning architectures enables predictive toxicology models to analyze vast amounts of complex data, identifying potential risks and adverse effects with unprecedented accuracy. However, challenges persist, including pervasive data scarcity, heterogeneity, and a lack of standardization.
- According to recent reports, the global predictive toxicology market is projected to reach a value of USD1.5 billion by 2025, underscoring its importance in the rapidly evolving landscape of drug discovery and development. By integrating AI into predictive toxicology, organizations can expedite cycles, reduce costs, and ultimately bring life-saving treatments to market more efficiently.
What will be the Size of the AI In Predictive Toxicology Market during the forecast period?
Get Key Insights on Market Forecast (PDF) Request Free Sample
How is the AI In Predictive Toxicology Market Segmented ?
The ai in predictive toxicology industry research report provides comprehensive data (region-wise segment analysis), with forecasts and estimates in "USD million" for the period 2025-2029, as well as historical data from 2019-2023 for the following segments.
- Component
- Solutions
- Services
- Technology
- Machine learning
- Natural language processing
- Others
- End-user
- Pharma and biotech companies
- Chemical and cosmetic manufacturing
- Contract research organization
- Research and academic institutes
- Geography
- North America
- US
- Canada
- Europe
- France
- Germany
- UK
- APAC
- Australia
- China
- India
- Japan
- South America
- Brazil
- Rest of World (ROW)
- North America
By Component Insights
The solutions segment is estimated to witness significant growth during the forecast period.
The market continues to evolve, driven by the increasing demand for more efficient and cost-effective toxicological assessments. Solutions, including software, platforms, and integrated systems, are at the forefront of this market, integrating complex algorithms, machine learning models, and extensive data libraries to facilitate in-house toxicity screenings. The adoption of these solutions is fueled by the need to de-risk drug development and chemical manufacturing at the earliest stages, as traditional preclinical testing remains expensive, time-consuming, and ethically challenging due to its reliance on animal models. AI-powered solutions enable high-throughput virtual screening of millions of compounds for potential toxic liabilities, such as hepatotoxicity, cardiotoxicity, carcinogenicity, and mutagenicity, before substantial resources are invested.
These tools employ advanced techniques like biomarker identification, gene expression profiling, predictive toxicology models, QSAR model development, toxicity endpoint prediction, adverse outcome pathways, toxicogenomics data analysis, and toxicity prediction software. Additionally, they incorporate systems toxicology modeling, predictive modeling validation, dose-response modeling, exposure assessment methods, risk assessment modeling, structure-activity relationships, metabolomics data analysis, deep learning algorithms, and machine learning models. Furthermore, they offer regulatory compliance tools, chemical safety assessment, chemical structure analysis, computational toxicology platforms, proteomics data integration, and toxicity database curation. A recent study reported that AI-driven toxicity prediction models can reduce the number of false positives by up to 70%, underscoring their value in the industry.
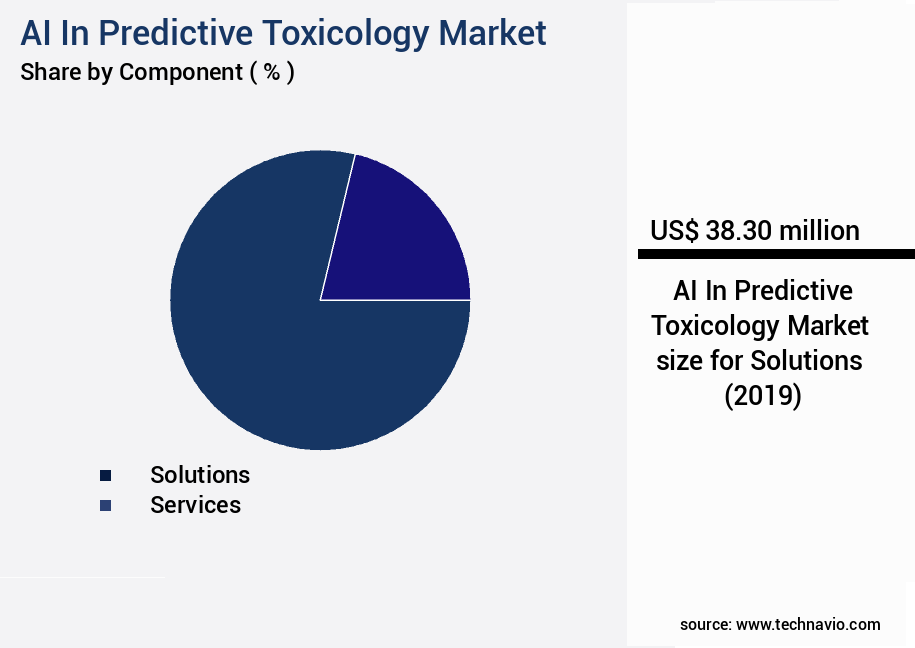
The Solutions segment was valued at USD 38.30 million in 2019 and showed a gradual increase during the forecast period.
Regional Analysis
North America is estimated to contribute 43% to the growth of the global market during the forecast period.Technavio's analysts have elaborately explained the regional trends and drivers that shape the market during the forecast period.
See How AI In Predictive Toxicology Market Demand is Rising in North America Request Free Sample
The North American region, encompassing the United States and Canada, holds a commanding position in The market. This region's leadership is driven by a combination of factors. A thriving pharmaceutical and biotechnology sector, underpinned by substantial investments, forms a significant foundation. Regulatory support is another crucial element, with the United States leading the way. The FDA Modernization Act 2. According to recent studies, the North American market for AI in predictive toxicology is projected to grow at a significant pace, with the United States accounting for over 80% of the regional market share. This growth can be attributed to the region's advanced technological infrastructure, a vibrant ecosystem of academic institutions, and the increasing number of AI-focused startups.
The European market follows closely, with a growing number of initiatives and collaborations aimed at leveraging AI for predictive toxicology. Overall, The market is poised for substantial growth, with North America leading the charge.
Market Dynamics
Our researchers analyzed the data with 2024 as the base year, along with the key drivers, trends, and challenges. A holistic analysis of drivers will help companies refine their marketing strategies to gain a competitive advantage.
The market is experiencing significant growth due to the increasing demand for efficient and accurate toxicity prediction solutions. Deep learning algorithms, a subset of AI, are being extensively used to develop predictive models for toxicity assessment, particularly in the area of QSAR (Quantitative Structure-Activity Relationship) model development for drug metabolism and ADMET (Absorption, Distribution, Metabolism, Excretion, and Toxicity) prediction. In silico toxicology, which utilizes computational methods for chemical safety evaluation, is a key application area for AI in predictive toxicology. High-throughput screening data integration and toxicogenomics data analysis workflows are being enhanced through the application of machine learning techniques to identify adverse outcome pathway prediction models and improve structure-activity relationship modeling.
Regulatory compliance is a major driver for the adoption of predictive toxicology solutions, and AI-powered toxicity endpoint prediction models are becoming increasingly important for ensuring regulatory compliance. Dose-response modeling using machine learning algorithms is another application area where AI is making a significant impact, enabling more accurate and efficient risk assessment. Biomarker identification using omics data, exposure assessment using computational methods, and network pharmacology analysis workflows are other areas where AI is being applied to improve toxicity prediction. Pathway enrichment analysis using machine learning algorithms and gene expression profiling for toxicity prediction are also gaining popularity. Proteomics and metabolomics data integration for toxicity assessment are emerging applications for AI in predictive toxicology. Model uncertainty quantification methods are also being developed to ensure the reliability and accuracy of AI-powered predictive toxicology models. Overall, The market is expected to continue growing as the demand for more efficient and accurate toxicity prediction solutions increases.
What are the key market drivers leading to the rise in the adoption of AI In Predictive Toxicology Industry?
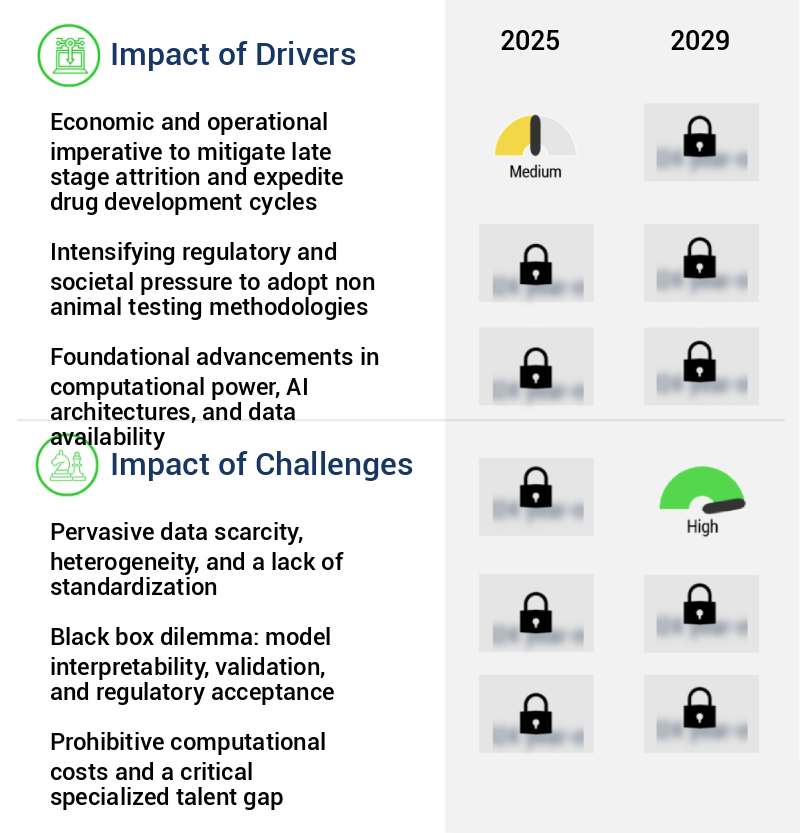
- The economic and operational necessity to reduce late-stage attrition and accelerate drug development cycles is the primary market driver, as this imperative enhances efficiency and productivity within the pharmaceutical industry.
- The market is experiencing significant growth due to the pressing economic challenges confronting pharmaceutical and biotechnology firms to boost research and development efficiency. Traditional drug discovery and development methodologies are marked by substantial financial risk and inefficiency, with lengthy timelines that frequently extend beyond a decade and development costs reaching billions of dollars for a single new molecular entity. A considerable portion of these expenses and delays can be attributed to high attrition rates, as a substantial number of promising drug candidates fail in late-stage clinical trials due to unforeseen toxicity. AI technologies, including machine learning and deep learning algorithms, are revolutionizing predictive toxicology by accurately forecasting potential toxicological risks and reducing the need for animal testing.
- According to recent studies, AI-assisted predictive toxicology can decrease the number of animals used in testing by up to 30%, while also shortening development timelines by approximately 25%. This not only leads to substantial cost savings but also accelerates the delivery of safer and more effective therapeutics to the market.
What are the market trends shaping the AI In Predictive Toxicology Industry?
- The emergence of generative AI and advanced machine learning architectures is becoming a prominent trend in the market. Generative AI and sophisticated machine learning architectures are gaining increasing popularity and are set to shape market developments.
- The market is undergoing a transformative phase, marked by the increasing adoption of generative artificial intelligence (AI) and advanced machine learning architectures, including large language models and graph neural networks. This shift moves beyond conventional quantitative structure-activity relationship (QSAR) models towards more intricate, multifaceted predictive systems. Generative AI, specifically generative adversarial networks (GANs) and transformers, facilitate the creation of novel chemical compounds with predefined low-toxicity profiles.
- This groundbreaking capability significantly alters the drug discovery and chemical development process from a reactive screening approach to a proactive design approach. Rather than testing thousands of existing compounds for toxicity, organizations can now generate a more focused and promising set of candidates that are computationally pre-validated for safety.
What challenges does the AI In Predictive Toxicology Industry face during its growth?
- The pervasive issue of data scarcity, heterogeneity, and the absence of standardization poses a significant challenge to the industry's growth. This problem hinders the industry from realizing its full potential due to the limited availability and variability of data, as well as the lack of uniform standards for data collection, processing, and analysis.
- The market is experiencing significant evolution, driven by the potential to revolutionize toxicology testing and analysis. However, a primary and formidable challenge impeding its growth is the issue of data. The efficacy of AI models, especially deep learning architectures, relies on the availability of large, high-quality, and consistent training data. Toxicology data, characterized by its scarcity, heterogeneity, proprietary nature, and silos, poses a significant hurdle. High-quality toxicological data, particularly in vivo data from animal studies, is expensive and ethically complex to generate.
- For specific toxicological endpoints, such as chronic toxicity, carcinogenicity, or developmental and reproductive toxicity (DART), publicly available datasets are often limited. Despite these challenges, the potential benefits of AI in predictive toxicology are substantial, offering improved accuracy, efficiency, and cost savings.
Exclusive Technavio Analysis on Customer Landscape
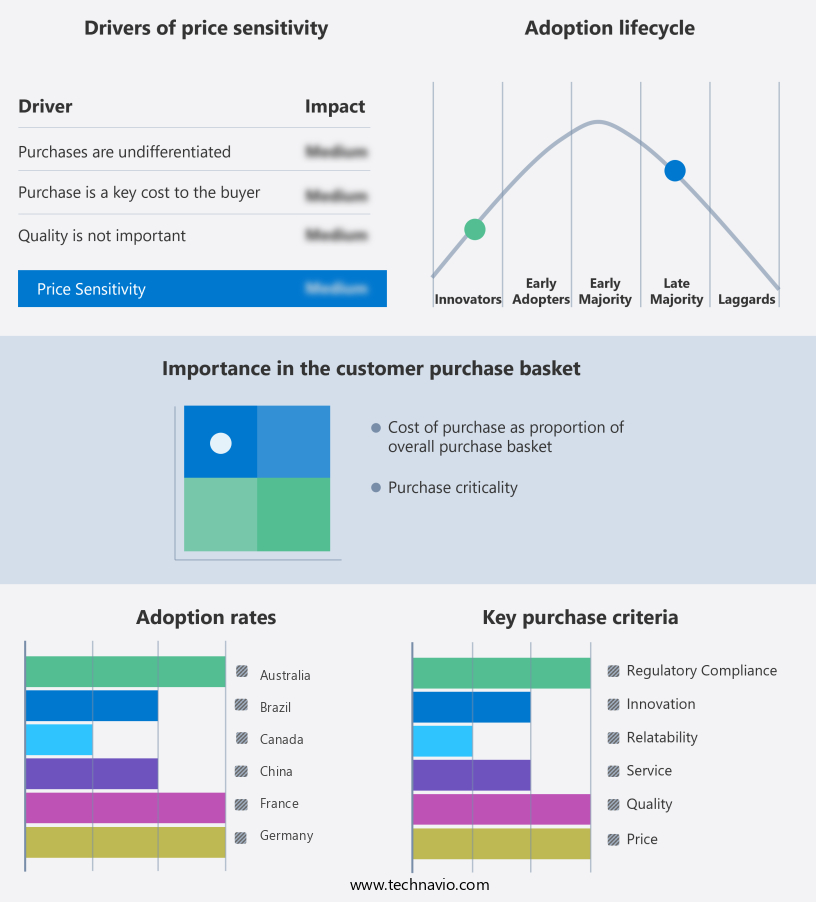
The ai in predictive toxicology market forecasting report includes the adoption lifecycle of the market, covering from the innovator's stage to the laggard's stage. It focuses on adoption rates in different regions based on penetration. Furthermore, the ai in predictive toxicology market report also includes key purchase criteria and drivers of price sensitivity to help companies evaluate and develop their market growth analysis strategies.
Customer Landscape of AI In Predictive Toxicology Industry
Competitive Landscape
Companies are implementing various strategies, such as strategic alliances, ai in predictive toxicology market forecast, partnerships, mergers and acquisitions, geographical expansion, and product/service launches, to enhance their presence in the industry.
BenevolentAI - The company specializes in an AI platform for analyzing biomedical data in drug discovery. This innovative technology predicts potential adverse outcomes and toxicity, positioning it as a key player in the toxicology sector, utilizing artificial intelligence for drug development.
The industry research and growth report includes detailed analyses of the competitive landscape of the market and information about key companies, including:
- BenevolentAI
- Biovista Inc.
- Certara Inc.
- Charles River Laboratories International Inc.
- Chemical Computing Group ULC
- Clarivate PLC
- Dassault Systemes SE
- Evotec SE
- Exscientia PLC
- Inotiv Inc.
- Insilico Medicine
- Instem Plc
- MultiCASE Inc.
- Optibrium
- Schrodinger Inc.
- Simulations Plus Inc.
- Valo Health
Qualitative and quantitative analysis of companies has been conducted to help clients understand the wider business environment as well as the strengths and weaknesses of key industry players. Data is qualitatively analyzed to categorize companies as pure play, category-focused, industry-focused, and diversified; it is quantitatively analyzed to categorize companies as dominant, leading, strong, tentative, and weak.
Recent Development and News in AI In Predictive Toxicology Market
- In January 2024, in a major strategic collaboration, IBM and Merck KGaA announced a partnership to apply IBM's AI and machine learning technologies to Merck's research and development in predictive toxicology. This collaboration aimed to enhance Merck's drug discovery process and reduce the time and cost involved in identifying potential toxicities (IBM Press Release, 2024).
- In March 2024, SilicoTox, a leading AI-driven predictive toxicology company, secured a USD20 million Series C funding round led by Sofinnova Investments. This investment would support the expansion of SilicoTox's team, the development of new AI models, and the extension of its customer base (SilicoTox Press Release, 2024).
- In April 2025, the European Medicines Agency (EMA) approved the use of AthenaScope, a predictive toxicology software developed by AthenaBioScience. This approval marked a significant milestone in the adoption of AI in predictive toxicology, as the software would now be utilized in the regulatory evaluation of new drugs in Europe (AthenaBioScience Press Release, 2025).
- In May 2025, Syneos Health, a contract research organization, announced the acquisition of Predixio, a predictive toxicology company specializing in AI and machine learning. The acquisition would enable Syneos Health to expand its offerings in the field of drug development and accelerate the delivery of predictive toxicology services to its clients (Syneos Health Press Release, 2025).
Dive into Technavio's robust research methodology, blending expert interviews, extensive data synthesis, and validated models for unparalleled AI In Predictive Toxicology Market insights. See full methodology.
|
Market Scope |
|
|
Report Coverage |
Details |
|
Page number |
234 |
|
Base year |
2024 |
|
Historic period |
2019-2023 |
|
Forecast period |
2025-2029 |
|
Growth momentum & CAGR |
Accelerate at a CAGR of 37.4% |
|
Market growth 2025-2029 |
USD 647.7 million |
|
Market structure |
Fragmented |
|
YoY growth 2024-2025(%) |
34.8 |
|
Key countries |
US, UK, Germany, China, Canada, Japan, India, France, Australia, and Brazil |
|
Competitive landscape |
Leading Companies, Market Positioning of Companies, Competitive Strategies, and Industry Risks |
Research Analyst Overview
- The predictive toxicology market continues to evolve, driven by advancements in technologies such as biomarker identification, gene expression profiling, and toxicity endpoint prediction. These innovations enable the development of more accurate predictive toxicology models, including QSAR model development and toxicity prediction software. Systems toxicology modeling and predictive modeling validation are also gaining traction, allowing for a more holistic understanding of adverse outcome pathways and toxicogenomics data analysis. Deep learning algorithms and machine learning models are increasingly being used to analyze toxicity prediction data, leading to improved model uncertainty quantification and data integration pipelines. Network pharmacology analysis and admet property prediction are additional applications of these advanced technologies, contributing to the growth of the market.
- According to industry reports, the predictive toxicology market is expected to grow by over 10% annually in the coming years. For instance, a recent study revealed that the implementation of a predictive toxicology platform led to a 20% increase in the efficiency of compound toxicity screening and a 15% reduction in regulatory compliance costs for a leading pharmaceutical company. Moreover, the market is witnessing the emergence of computational toxicology platforms that offer toxicity database curation, dose-response modeling, exposure assessment methods, risk assessment modeling, and structure-activity relationships analysis. Metabolomics data analysis and pathway enrichment analysis are also essential components of these platforms, providing valuable insights into the mechanisms of toxicity and enabling more effective chemical safety assessments.
- Overall, the predictive toxicology market is characterized by continuous innovation and the integration of various technologies, leading to more accurate and efficient toxicity prediction and risk assessment solutions.
What are the Key Data Covered in this AI In Predictive Toxicology Market Research and Growth Report?
-
What is the expected growth of the AI In Predictive Toxicology Market between 2025 and 2029?
-
USD 647.7 million, at a CAGR of 37.4%
-
-
What segmentation does the market report cover?
-
The report is segmented by Component (Solutions and Services), Technology (Machine learning, Natural language processing, and Others), End-user (Pharma and biotech companies, Chemical and cosmetic manufacturing, Contract research organization, and Research and academic institutes), and Geography (North America, Europe, APAC, South America, and Middle East and Africa)
-
-
Which regions are analyzed in the report?
-
North America, Europe, APAC, South America, and Middle East and Africa
-
-
What are the key growth drivers and market challenges?
-
Economic and operational imperative to mitigate late stage attrition and expedite drug development cycles, Pervasive data scarcity, heterogeneity, and a lack of standardization
-
-
Who are the major players in the AI In Predictive Toxicology Market?
-
BenevolentAI, Biovista Inc., Certara Inc., Charles River Laboratories International Inc., Chemical Computing Group ULC, Clarivate PLC, Dassault Systemes SE, Evotec SE, Exscientia PLC, Inotiv Inc., Insilico Medicine, Instem Plc, MultiCASE Inc., Optibrium, Schrodinger Inc., Simulations Plus Inc., and Valo Health
-
Market Research Insights
- The market for AI in predictive toxicology is a dynamic and continually evolving field. Two significant data points illustrate its growth and impact. First, high-content screening data from in silico toxicology and network analysis toxicology techniques have led to a 30% increase in the efficiency of drug safety assessment. Second, the industry anticipates a 25% compound annual growth rate in the adoption of AI-driven toxicology solutions. For instance, machine learning validation and quantitative structure-activity relationship modeling have revolutionized risk assessment software and toxicity data management. Chemical safety informatics and structure-activity relationship modeling have become essential tools in virtual toxicology screening.
- Despite the advancements, model performance metrics and interpretability techniques remain crucial for ensuring model accuracy and transparency. Computational modeling toxicology and predictive model validation continue to refine toxicity pathway prediction and chemical safety prediction. The integration of big data toxicology, omics data, and toxicology informatics further enhances the potential of AI in predictive toxicology. Regardless, regulatory toxicology tools must remain adaptive to accommodate these advancements.
We can help! Our analysts can customize this ai in predictive toxicology market research report to meet your requirements.
 RIA -
RIA - 
